PAI data mining components support offline scheduling, enabling you to train models and run CTR predictions on a recurring basis. This topic walks through an ad CTR prediction pipeline scheduled with DataWorks.
Background information
The pipeline works as follows:
-
Train a model on historical data in Platform for AI (PAI).
-
Schedule the model with DataWorks.
-
Perform CTR prediction for ad placements at midnight every day to select and deliver ads that meet specified criteria.
The dataset for this pipeline is randomly generated, so this topic focuses on building and scheduling the pipeline rather than evaluating its results.
Step 1: Prepare the dataset
The pipeline uses a MaxCompute partitioned table for its dataset. The training data includes historical records from September 19 and 20, 2016, and the prediction target is the data for September 21, 2016.
|
Field |
Type |
Description |
|
id |
STRING |
The unique identifier of the ad. |
|
age |
DOUBLE |
The age of the target audience. |
|
sex |
DOUBLE |
The gender of the target audience. 1 indicates male, and 0 indicates female. |
|
duration |
DOUBLE |
The duration, in seconds, the ad is displayed on the UI. |
|
place |
DOUBLE |
The ad placement position. The value ranges from 0 to 4, representing the positions from top to bottom. |
|
ctr |
DOUBLE |
Ad CTR. If the number of ad clicks divided by the number of impressions is greater than 0.03, this parameter is set to 1. Otherwise, it is set to 0. |
|
dt |
STRING |
The date in the YYYYMMDD format. |
Run the following command in a MaxCompute client to create a partitioned table named ad. For more information, see Create tables.
create table if not exists ad (id STRING,age DOUBLE,sex DOUBLE,duration DOUBLE,place DOUBLE,ctr DOUBLE ) partitioned by (dt STRING) ;
alter table ad add if not exists partition (dt='20160919') partition (dt='20160920');
The following table shows sample data for the ad table. You can use the Tunnel command to import partitioned table data. For more information, see Import Data.
|
id |
age |
sex |
duration |
place |
ctr |
dt |
|
0 |
49 |
1 |
9 |
0 |
0 |
20160919 |
|
1 |
17 |
1 |
3 |
1 |
1 |
20160919 |
|
2 |
44 |
0 |
4 |
0 |
0 |
20160919 |
|
3 |
14 |
1 |
9 |
1 |
0 |
20160919 |
|
4 |
44 |
1 |
5 |
4 |
0 |
20160919 |
|
5 |
10 |
1 |
9 |
3 |
1 |
20160919 |
|
6 |
42 |
1 |
7 |
3 |
0 |
20160919 |
|
7 |
51 |
1 |
3 |
1 |
1 |
20160919 |
|
8 |
18 |
0 |
3 |
3 |
0 |
20160919 |
|
9 |
39 |
0 |
8 |
4 |
1 |
20160919 |
|
10 |
45 |
1 |
3 |
2 |
0 |
20160919 |
|
11 |
57 |
0 |
8 |
2 |
0 |
20160919 |
|
12 |
14 |
0 |
7 |
2 |
1 |
20160919 |
Step 2: Create a pipeline
-
Create and open a custom pipeline. For more information, see Create a custom pipeline.
-
Build the pipeline.
-
In the component list on the left, under Source/Target, drag two Read Table components onto the canvas, and rename them to ad-1 and ad-2 respectively.
-
From the component list on the left, navigate to the Data Preprocessing folder and drag two Normalization components to the canvas.
-
From the component list on the left, navigate to and drag the Binary Logistic Regression component to the canvas.
-
From the component list on the left, navigate to the Machine Learning folder and drag the Predicted component to the canvas.
-
In the component list on the left, drag the Write Table component under Source/Target onto the canvas, and rename it to ad_result-1.
-
Connect the components to build a pipeline as shown in the following figure.
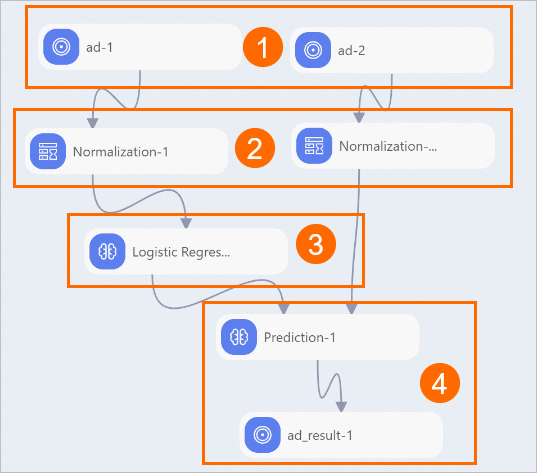
No.
Description
①
Import data sources.
②
Preprocess data.
③
Train the model.
④
Make predictions.
-
-
Configure the component parameters.
-
Click the ad-2 (training data source) and ad-1 (prediction data source) components on the canvas. In the right-side pane, configure the data sources for the pipeline.
Tab
Parameter
Description
Select Table
Table Name
Enter ad.
Partition
Select the Partition check box.
Parameter
Set this parameter to dt=@@{yyyyMMdd} to ensure that daily incremental data is used for prediction.
Field Details
Source Table Fields
After you configure parameters on the Select Table tab, the Source Table Fields are populated automatically. No manual configuration is required.
-
Click the Normalization-1 and Normalization-2 components on the canvas. On the Field Settings tab in the right-side pane, click Select Fields and select the DOUBLE and INT fields.
-
Click the Binary Logistic Regression component on the canvas. In the right-side pane, configure its parameters. Configure only the following parameters and leave the others at their default values.
Tab
Parameter
Description
Field Settings
Feature Columns For Training
Select the age, sex, duration, and place columns.
Target Column
Select the ctr column.
-
Click the Predicted component on the canvas. In the right-side pane, configure its parameters. Configure only the following parameters and leave the others at their default values.
Tab
Parameter
Description
Field Settings
Feature Columns
Select the age, sex, duration, and place columns.
Reserved Columns
Select the ctr column.
-
Click the ad_result-1 component on the canvas. On the Select Table tab in the right-side pane, set Output Table Name to
ad_result.
-
-
Click the Run icon
 in the upper-left corner of the canvas to run the pipeline.
 -
After the pipeline finishes running, right-click the ad_result-1 component and choose to view the prediction results.
The output includes the following columns:
-
prediction_result: whether the ad was clicked.1means clicked, and0means not clicked. -
prediction_score: the probability that the ad is clicked.
-
Step 3: Perform offline scheduling
-
Use DataWorks to create, configure, and commit a PAI task. For more information, see Create and run a PAI Studio node.
When you configure the scheduling task, set Time to run the prediction pipeline at midnight (00:00) every day. For more information, see Configure time properties.
-
On the task submission page, click O&M in the upper-right corner to view task logs. For more information, see Manage auto-triggered tasks.
Related documents
-
You can also submit an offline scheduling task from Designer. For more information, see Schedule Designer pipelines with DataWorks.
-
For more information about the Normalization component, see Normalization.
-
For more information about the classification component, see Logistic Regression for Binary Classification.