Fairness analysis
Fairness analysis identifies bias in AI models and prevents unfair outcomes based on attributes such as sex or race. By integrating responsible-ai-toolbox in PAI DSW, you can evaluate how model performance varies across sensitive features.
How it works
Fairness analysis identifies and corrects bias in AI systems so that decisions aren't influenced by irrelevant factors. The core principles are:
-
Avoid bias: Identify and reduce bias in data and algorithms so that AI systems don't produce unfair decisions based on personal attributes such as sex, race, or age.
-
Representative data: Train AI models on representative datasets that accurately reflect all user groups and prevent the marginalization of minorities.
-
Transparency and explainability: Improve AI system transparency with explainable AI techniques that help users and decision-makers understand why a model makes specific predictions.
-
Continuous monitoring and evaluation: Regularly monitor and evaluate AI systems to detect and correct bias that emerges over time.
-
Diversity and inclusion: Incorporate diverse perspectives in AI system design and development to ensure that problems are considered from multiple backgrounds and viewpoints.
-
Compliance and ethics: Follow regulations and ethical standards to ensure that AI applications don't cause harm or injustice.
The following example evaluates the fairness of an income prediction model across sex and race. The model predicts whether annual income exceeds $50K. This example shows how to use responsible-ai-toolbox for fairness analysis in PAI DSW.
Prerequisites
-
A DSW instance. If you don't have one, see Create a DSW instance. Recommended configuration:
-
Instance type: ecs.gn6v-c8g1.2xlarge
-
Image: Python 3.9 or later. This topic uses the following official image: tensorflow-pytorch-develop:2.14-pytorch2.1-gpu-py311-cu118-ubuntu22.04
-
Model framework: responsible-ai-toolbox supports regression and binary classification models built with scikit-learn, PyTorch, and TensorFlow.
-
-
Training dataset: Use your own dataset. To use the example dataset instead, follow Step 3: Prepare the dataset.
-
Trained model: Use your own model. To use the example model instead, follow Step 5: Train the model.
Step 1: Open DSW Gallery
-
Log on to the PAI console.
-
In the upper-left corner, select a region.
-
In the left-side navigation pane, choose QuickStart > Notebook Gallery. Search for Responsible AI - Fairness Analysis and click Open in DSW on the corresponding card.
-
Select a DSW instance and click Open Notebook. The Responsible AI - Fairness Analysis notebook opens.
Step 2: Install dependencies
Install the responsible-ai-toolbox package (raiwidgets) for fairness evaluation.
!pip install raiwidgets==0.34.1Step 3: Prepare the dataset
Run the following script to load the OpenML dataset 1590 for the example in this topic.
from raiutils.common.retries import retry_function
from sklearn.datasets import fetch_openml

class FetchOpenml(object):
    def __init__(self):
        pass
    # Fetch the OpenML dataset with data_id = 1590
    def fetch(self):
        return fetch_openml(data_id=1590, as_frame=True)

fetcher = FetchOpenml()
action_name = "Dataset download"
err_msg = "Failed to download openml dataset"
max_retries = 5
retry_delay = 60
data = retry_function(fetcher.fetch, action_name, err_msg,
                      max_retries=max_retries,
                      retry_delay=retry_delay)
You can also load your own dataset. The following code loads a CSV file:
import pandas as pd

# Load your own dataset in CSV format
# Use pandas to read the CSV file
data = pd.read_csv(filename)
Step 4: Preprocess the data
Get feature variables and the target variable
The target variable is the actual outcome that the model predicts. Feature variables are all other variables in each data instance. In this example:
-
class: Whether annual income exceeds $50K
-
sex: Gender
-
race: Race
-
age: Age
Run the following script to load the feature variables into X_raw and preview the first five rows:
# Get the feature variables, excluding the target variable.
X_raw = data.data
# Display the first 5 rows of feature variables, excluding the target variable.
X_raw.head(5)
Run the following script to encode the target variable and view its distribution. A value of 1 indicates income >$50K, and 0 indicates income <=$50K.
from sklearn.preprocessing import LabelEncoder

# Convert the target variable to a binary classification target
# data.target is the target variable "class"
y_true = (data.target == '>50K') * 1
y_true = LabelEncoder().fit_transform(y_true)

import matplotlib.pyplot as plt
import numpy as np

# View the distribution of the target variable
counts = np.bincount(y_true)
classes = ['<=50K', '>50K']
plt.bar(classes, counts)
Identify sensitive features
Run the following script to define sex and race as sensitive features and preview the data. The responsible-ai-toolbox evaluates whether model predictions are biased with respect to these sensitive features. In practice, set sensitive features based on your business requirements.
# Define "sex" and "race" as sensitive attributes
# First, select the columns related to sensitive attributes from the dataset to form a new DataFrame `sensitive_features`
sensitive_features = X_raw[['sex','race']]
sensitive_features.head(5)
Run the following script to remove the sensitive features from X_raw and preview the result:
# Remove the sensitive features from the feature variables
X = X_raw.drop(labels=['sex', 'race'],axis = 1)
X.head(5)
Encode and scale features
Run the following script to apply one-hot encoding and feature scaling, converting the data into a format suitable for responsible-ai-toolbox.
import pandas as pd
from sklearn.preprocessing import StandardScaler

# One-hot encoding
X = pd.get_dummies(X)

# Perform feature scaling on the dataset X
sc = StandardScaler()
X_scaled = sc.fit_transform(X)
X_scaled = pd.DataFrame(X_scaled, columns=X.columns)

X_scaled.head(5)
Split training and test data
Run the following script to allocate 20% of the data to the test dataset and the remaining 80% to the training dataset.
from sklearn.model_selection import train_test_split

# Split the feature variables X and target variable y into training and test sets according to the `test_size` ratio
X_train, X_test, y_train, y_test = \
    train_test_split(X_scaled, y_true, test_size=0.2, random_state=0, stratify=y_true)

# Use the same random seed to split the sensitive features into training and test sets, ensuring consistency with the above split
sensitive_features_train, sensitive_features_test = \
    train_test_split(sensitive_features, test_size=0.2, random_state=0, stratify=y_true)
Check the size of each dataset:
print("Training set size:", len(X_train))
print("Test set size:", len(X_test))
Reset the indexes of both datasets:
# Reset the DataFrame index to avoid index errors
X_train = X_train.reset_index(drop=True)
sensitive_features_train = sensitive_features_train.reset_index(drop=True)
X_test = X_test.reset_index(drop=True)
sensitive_features_test = sensitive_features_test.reset_index(drop=True)
Step 5: Train the model
The following example uses scikit-learn to train a logistic regression model on the training data.
scikit-learn
from sklearn.linear_model import LogisticRegression

# Create a logistic regression model
sk_model = LogisticRegression(solver='liblinear', fit_intercept=True)
# Train the model
sk_model.fit(X_train, y_train)
PyTorch
import torch
import torch.nn as nn
import torch.optim as optim

# Define logistic regression model
class LogisticRegression(nn.Module):
    def __init__(self, input_size):
        super(LogisticRegression, self).__init__()
        self.linear = nn.Linear(input_size, 1)

    def forward(self, x):
        outputs = torch.sigmoid(self.linear(x))
        return outputs

# Instantiate the model
input_size = X_train.shape[1]
pt_model = LogisticRegression(input_size)

# Loss function and optimizer
criterion = nn.BCELoss()
optimizer = optim.SGD(pt_model.parameters(), lr=5e-5)

# Train the model
num_epochs = 1
X_train_pt = X_train
y_train_pt = y_train
for epoch in range(num_epochs):
    # Forward pass
    # Convert DataFrame to Tensor
    if isinstance(X_train_pt, pd.DataFrame):
        X_train_pt = torch.tensor(X_train_pt.values)
        X_train_pt = X_train_pt.float()
    outputs = pt_model(X_train_pt)
    outputs = outputs.squeeze()
    # Convert ndarray to Tensor
    if isinstance(y_train_pt, np.ndarray):
        y_train_pt = torch.from_numpy(y_train_pt)
        y_train_pt = y_train_pt.float()
    loss = criterion(outputs, y_train_pt)

    # Backward pass and optimization
    optimizer.zero_grad()
    loss.backward()
    optimizer.step()
TensorFlow
import tensorflow as tf
from tensorflow.keras import layers

# Define the logistic regression model
tf_model = tf.keras.Sequential([
    layers.Dense(units=1, input_shape=(X_train.shape[-1],), activation='sigmoid')
])

# Compile the model using binary cross-entropy loss and stochastic gradient descent optimizer
tf_model.compile(optimizer='sgd', loss='binary_crossentropy', metrics=['accuracy'])

# Train the model
tf_model.fit(X_train, y_train, epochs=1, batch_size=32, verbose=0)
Step 6: Evaluate the model
Use the Fairness Dashboard from responsible-ai-toolbox to generate predictions on the test dataset and produce a fairness evaluation report.
The Fairness Dashboard groups predictions and actual outcomes by sensitive feature values. It compares predicted and actual outcomes across groups to reveal how model performance varies.
For example, with the sensitive feature "sex", the Fairness Dashboard classifies predictions (y_pred) and actual outcomes (y_test) by sex, then computes and compares selection rate, accuracy, and other metrics for "Male" and "Female".
The following example evaluates the scikit-learn model:
scikit-learn
from raiwidgets import FairnessDashboard
import os
from urllib.parse import urlparse
# Generate prediction results on the test dataset
y_pred_sk = sk_model.predict(X_test)

# Use responsible-ai-toolbox to compute data information for each sensitive group
metric_frame_sk = FairnessDashboard(sensitive_features=sensitive_features_test,
                  y_true=y_test,
                  y_pred=y_pred_sk, locale = 'zh-Hans')

# Set the URL redirect link
metric_frame_sk.config['baseUrl'] =  'https://{}-proxy-{}.dsw-gateway-{}.data.aliyuncs.com'.format(
    os.environ.get('JUPYTER_NAME').replace("dsw-",""),
    urlparse(metric_frame_sk.config['baseUrl']).port,
    os.environ.get('dsw_region') )
print(metric_frame_sk.config['baseUrl'])
PyTorch
from raiwidgets import FairnessDashboard
import torch
import os
from urllib.parse import urlparse
# Test the model and evaluate fairness
pt_model.eval()  # Set model to evaluation mode
X_test_pt = X_test
with torch.no_grad():
    X_test_pt = torch.tensor(X_test_pt.values)
    X_test_pt = X_test_pt.float()
    y_pred_pt = pt_model(X_test_pt).numpy()

# Use responsible-ai-toolbox to compute metrics for each sensitive group
metric_frame_pt = FairnessDashboard(sensitive_features=sensitive_features_test,
                           y_true=y_test,
                           y_pred=y_pred_pt.flatten().round(),locale='zh-Hans')

# Set the URL redirect link
metric_frame_pt.config['baseUrl'] =  'https://{}-proxy-{}.dsw-gateway-{}.data.aliyuncs.com'.format(
    os.environ.get('JUPYTER_NAME').replace("dsw-",""),
    urlparse(metric_frame_pt.config['baseUrl']).port,
    os.environ.get('dsw_region') )
print(metric_frame_pt.config['baseUrl'])
TensorFlow
from raiwidgets import FairnessDashboard
import os
from urllib.parse import urlparse
# Test the model and evaluate fairness
y_pred_tf = tf_model.predict(X_test).flatten()

# Use responsible-ai-toolbox to compute data information for each sensitive group
metric_frame_tf = FairnessDashboard(
                           sensitive_features=sensitive_features_test,
                           y_true=y_test,
                           y_pred=y_pred_tf.round(),locale='zh-Hans')

# Set the URL redirect link
metric_frame_tf.config['baseUrl'] =  'https://{}-proxy-{}.dsw-gateway-{}.data.aliyuncs.com'.format(
    os.environ.get('JUPYTER_NAME').replace("dsw-",""),
    urlparse(metric_frame_tf.config['baseUrl']).port,
    os.environ.get('dsw_region') )
print(metric_frame_tf.config['baseUrl'])
Key parameters:
-
sensitive_features: The sensitive attributes.
-
y_true: The actual outcomes from the test dataset.
-
y_pred: The model predictions.
-
locale (optional): The display language for the evaluation dashboard. Supports Simplified Chinese ("zh-Hans") and Traditional Chinese ("zh-Hant"). Defaults to English ("en").
Step 7: View the evaluation report
After evaluation completes, click the URL to view the full evaluation report.

If the evaluation page is stuck on "Calculating", see FAQ for a solution.
On the Fairness dashboard page, click Get Started. Configure the sensitive feature, performance metric, and fairness metric as described below to compare model metrics across sensitive feature groups.
Sensitive feature: sex
-
Sensitive feature: sex
-
Performance metric: Accuracy
-
Fairness metric: Demographic parity difference
-
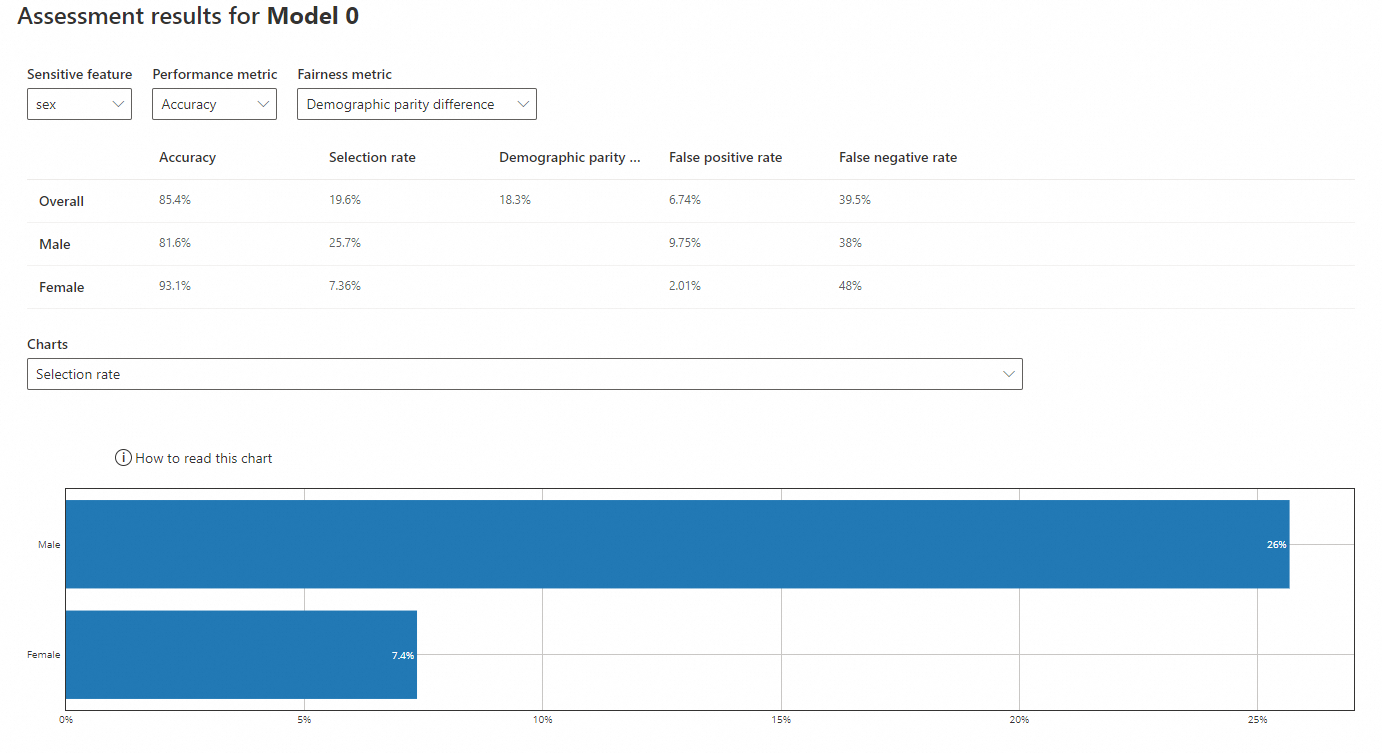
Accuracy: The proportion of correctly predicted samples out of the total. The model predicts male income with 81.6% accuracy and female income with 93.1% accuracy. Both values are close to the overall accuracy of 85.4%.
-
Selection rate: The probability that the model predicts the favorable outcome (income >$50K). The model predicts a 25.7% selection rate for males and 7.36% for females. The female selection rate is far below the overall rate of 19.6%.
-
Demographic parity difference: The difference in the probability of receiving a positive prediction across protected groups. A value closer to 0 indicates less bias between groups. The overall demographic parity difference is 18.3%.
Sensitive feature: race
-
Sensitive feature: race
-
Performance metric: Accuracy
-
Fairness metric: Demographic parity difference
-
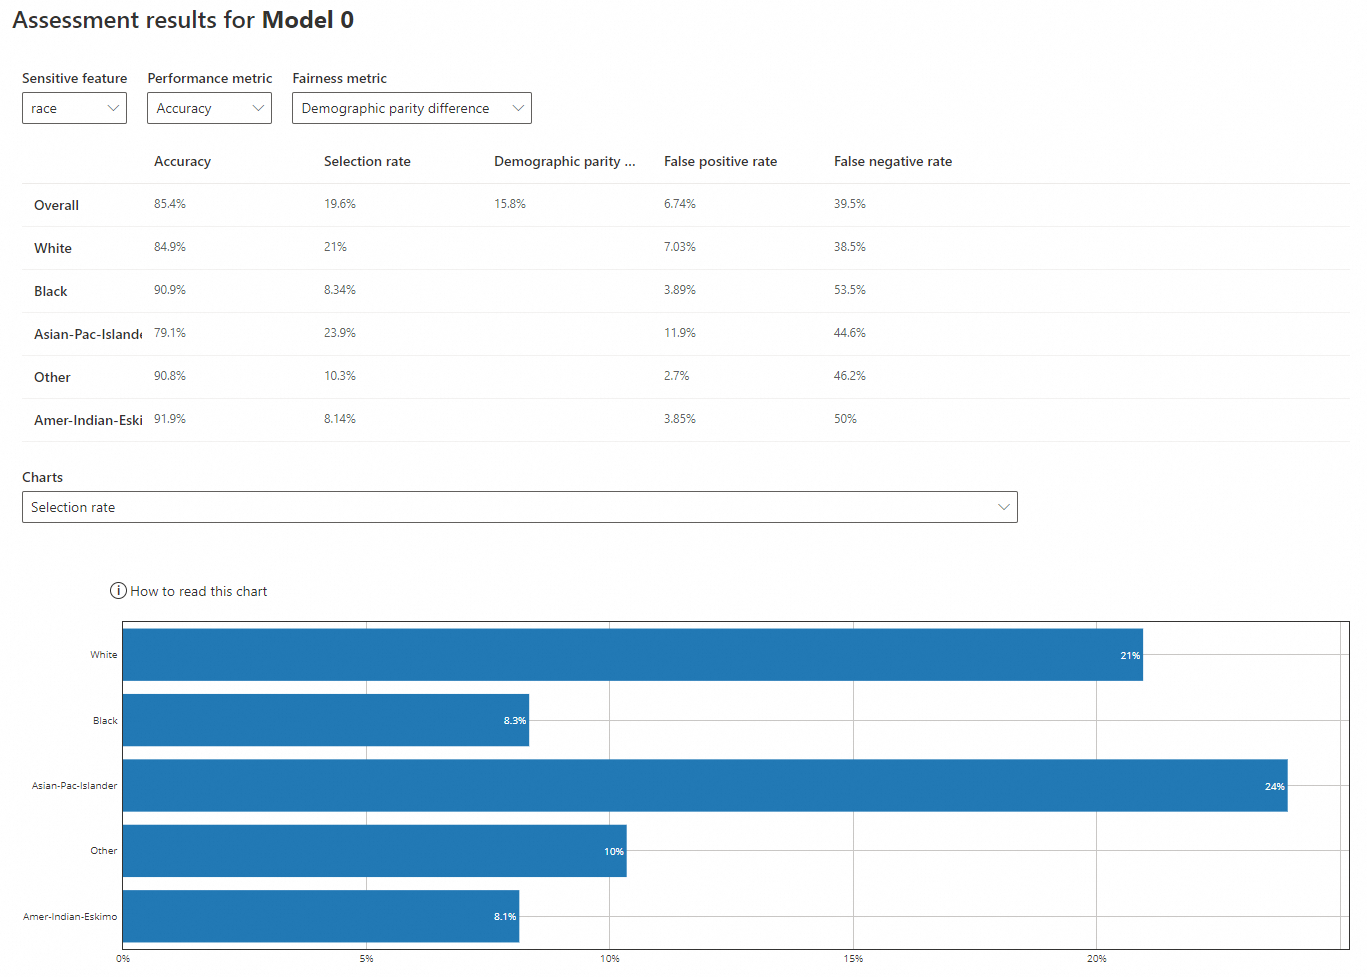
Accuracy: The proportion of correctly predicted samples out of the total. The model predicts income for "White" and "Asian-Pac-Islander" with 84.9% and 79.1% accuracy, compared to 90.9%, 90.8%, and 91.9% for "Black", "Other", and "Amer-Indian-Eskimo". All group accuracies are close to the overall accuracy of 85.4%.
-
Selection rate: The probability that the model predicts the favorable outcome (income >$50K). The selection rates for "White" (21%) and "Asian-Pac-Islander" (23.9%) are higher than those for "Black" (8.34%), "Other" (10.3%), and "Amer-Indian-Eskimo" (8.14%). These lower rates are far below the overall selection rate of 19.6%.
-
Demographic parity difference: The difference in the probability of receiving a positive prediction across protected groups. A value closer to 0 indicates less bias between groups. The overall demographic parity difference is 15.8%.
FAQ
Q: What if the Fairness Dashboard is stuck on "Calculating"?
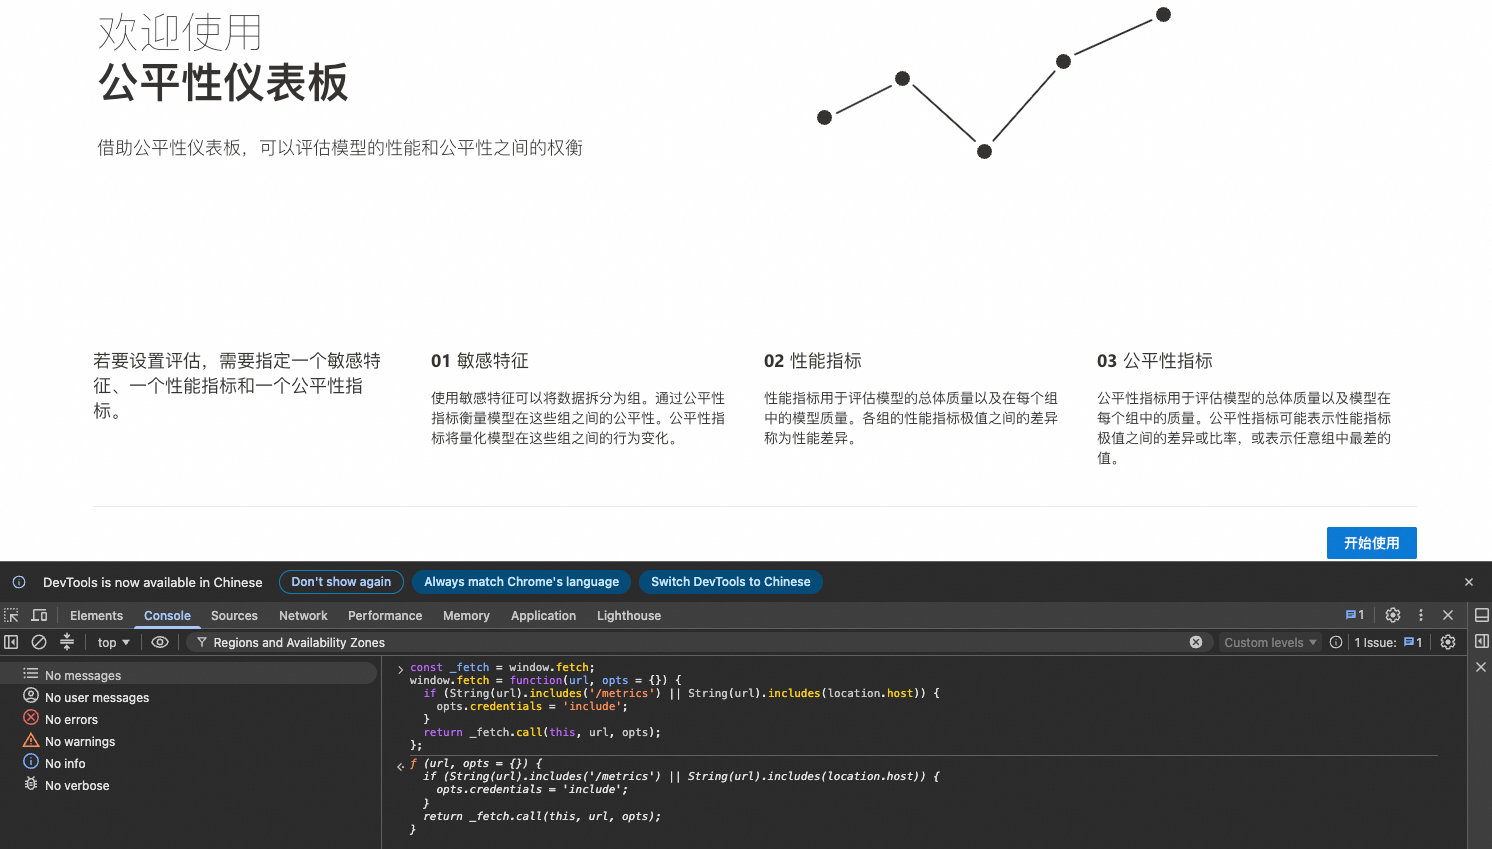
In the DSW environment, the Fairness Dashboard can get stuck on "Calculating" because cross-origin requests don't carry authentication credentials. To fix this, open the browser console (press F12 and switch to the Console tab) on the welcome page and run the following code:
const _fetch = window.fetch;
window.fetch = function(url, opts = {}) {
  if (String(url).includes('/metrics') || String(url).includes(location.host)) {
    opts.credentials = 'include';
  }
  return _fetch.call(this, url, opts);
};