PS Linear Regression combines a linear regression model with a parameter server (PS) architecture to handle large-scale training tasks — up to hundreds of billions of samples and billions of features. The PS architecture distributes both computation and model parameter storage across workers, improving training efficiency and scalability.
Use PS Linear Regression when your dataset is too large for single-machine training or when your feature space is extremely high-dimensional, including sparse formats.
How it works
-
Load training data from a MaxCompute input table. Dense format supports DOUBLE and BIGINT columns; sparse format uses STRING columns in key-value (KV) format.
-
Submit a training task. The PS architecture shards model parameters across server nodes and runs gradient updates in parallel across worker nodes.
-
After training completes, the model is saved as an offline model (default) or written to a MaxCompute table.
-
Run prediction using the saved model to generate output scores written to a separate output table.
Configure the component
Method 1: Visual interface
Add the PS Linear Regression component to your workflow in Designer, then configure its parameters in the right pane.
| Parameter type | Parameter | Required | Description |
|---|---|---|---|
| Fields setting | Feature Columns | Yes | The feature columns from the input data source to use for training. |
| Label Column | Yes | The label column. Supports DOUBLE and BIGINT data types. | |
| Is it a sparse format? | No | Select true if input data is in key-value (KV) format. Default: false. | |
| KV pair separator | No | The separator between key-value pairs. Default: space. Takes effect only when sparse format is enabled. | |
| Key-value separator | No | The separator between a key and its value. Default: colon (:). Takes effect only when sparse format is enabled. |
|
| Parameters setting | L1 weight | No | The L1 regularization coefficient. A larger value produces a sparser model with fewer non-zero elements. Valid values: non-negative floating-point numbers. Default: 1.0. |
| L2 weight | No | The L2 regularization coefficient. A larger value indicates that the absolute values of the model parameters are smaller. Valid values: non-negative floating-point numbers. Default: 0. | |
| Maximum iterations | No | The maximum number of training iterations. Set to 0 for no limit. Valid values: non-negative integers. Default: 100. | |
| Minimum convergence deviance | No | The stopping threshold for the optimization algorithm. Training stops when the improvement falls below this value. Valid values: [0, 1]. Default: 0.000001. | |
| Maximum feature ID | No | The maximum feature ID or feature dimension. Can be set higher than the actual value. If left blank, the system runs an SQL task to calculate it automatically. Valid values: non-negative integers. | |
| Execution tuning | Number of cores | No | The number of CPU cores to allocate. Default: system-allocated. |
| Memory size per core | No | The memory allocated per core, in MB. Default: system-allocated. |
L1 regularization drives sparsity — useful when many features are irrelevant and you want a sparse model. L2 regularization shrinks all coefficients proportionally — useful when features are correlated. If you are unsure which to use, start with L2 (set L1 weight to 0) and tune from there.
Method 2: PAI command
Run PAI commands through the SQL Script component.
Training command:
PAI -name ps_linearregression
    -project algo_public
    -DinputTableName="lm_test_input"
    -DmodelName="linear_regression_model"
    -DlabelColName="label"
    -DfeatureColNames="features"
    -Dl1Weight=1.0
    -Dl2Weight=0.0
    -DmaxIter=100
    -Depsilon=1e-6
    -DenableSparse=true
Prediction command:
drop table if exists logistic_regression_predict;
PAI -name prediction
    -DmodelName="linear_regression_model"
    -DoutputTableName="linear_regression_predict"
    -DinputTableName="lm_test_input"
    -DappendColNames="label,features"
    -DfeatureColNames="features"
    -DenableSparse=true
Parameters:
| Parameter | Required | Default value | Description |
|---|---|---|---|
inputTableName |
Yes | — | The name of the input table. |
modelName |
Yes | — | The name of the output model. |
labelColName |
Yes | — | The label column in the input table. Supports DOUBLE and BIGINT data types. |
featureColNames |
Yes | — | The feature columns in the input table. Dense format: DOUBLE and BIGINT. Sparse format: STRING. |
outputTableName |
No | — | The output table for model evaluation results. Required when enableFitGoodness is true. |
inputTablePartitions |
No | — | The partitions of the input table to use for training. |
enableSparse |
No | false |
Whether input data is in sparse (KV) format. Valid values: true, false. |
itemDelimiter |
No | Space | The separator between key-value pairs. Takes effect only when enableSparse is true. |
kvDelimiter |
No | : |
The separator between a key and its value. Takes effect only when enableSparse is true. |
enableModelIo |
No | true |
Whether to save the model as an offline model. If false, the model is written to a MaxCompute table. Valid values: true, false. |
maxIter |
No | 100 |
The maximum number of training iterations. Valid values: non-negative integers. |
epsilon |
No | 0.000001 |
The convergence threshold for the optimization algorithm. Training stops when improvement falls below this value. Valid values: [0, 1]. |
l1Weight |
No | 1.0 |
The L1 regularization coefficient. A larger value produces a sparser model. Valid values: non-negative floating-point numbers. |
l2Weight |
No | 0 |
The L2 regularization coefficient. A larger value indicates that the absolute values of the model parameters are smaller. Valid values: non-negative floating-point numbers. |
modelSize |
No | 0 |
The maximum feature ID or feature dimension. Can be greater than the actual value. If set to 0, the system calculates it automatically. Valid values: non-negative integers. |
coreNum |
No | System-allocated | The number of CPU cores per worker. |
memSizePerCore |
No | System-allocated | The memory per core, in MB. |
Example
This example trains a PS Linear Regression model on sparse KV-format data and runs prediction.
Step 1: Create input data
Run the following SQL statement in the SQL Script component to generate the input table.
drop table if exists lm_test_input;
create table lm_test_input as
select
*
from
(
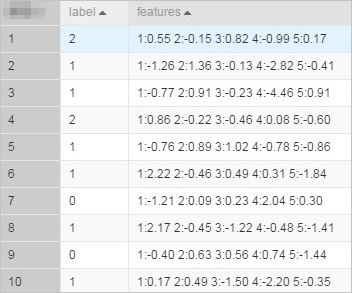
select cast(2 as BIGINT) as label, '1:0.55 2:-0.15 3:0.82 4:-0.99 5:0.17' as features
union all
select cast(1 as BIGINT) as label, '1:-1.26 2:1.36 3:-0.13 4:-2.82 5:-0.41' as features
union all
select cast(1 as BIGINT) as label, '1:-0.77 2:0.91 3:-0.23 4:-4.46 5:0.91' as features
union all
select cast(2 as BIGINT) as label, '1:0.86 2:-0.22 3:-0.46 4:0.08 5:-0.60' as features
union all
select cast(1 as BIGINT) as label, '1:-0.76 2:0.89 3:1.02 4:-0.78 5:-0.86' as features
union all
select cast(1 as BIGINT) as label, '1:2.22 2:-0.46 3:0.49 4:0.31 5:-1.84' as features
union all
select cast(0 as BIGINT) as label, '1:-1.21 2:0.09 3:0.23 4:2.04 5:0.30' as features
union all
select cast(1 as BIGINT) as label, '1:2.17 2:-0.45 3:-1.22 4:-0.48 5:-1.41' as features
union all
select cast(0 as BIGINT) as label, '1:-0.40 2:0.63 3:0.56 4:0.74 5:-1.44' as features
union all
select cast(1 as BIGINT) as label, '1:0.17 2:0.49 3:-1.50 4:-2.20 5:-0.35' as features
) tmp;The table has two columns: label (BIGINT) and features (STRING in KV format). Each features value encodes feature IDs and values separated by colons, with pairs separated by spaces — for example, 1:0.55 2:-0.15.
In KV format, feature IDs must be positive integers and feature values must be real numbers. If feature IDs are strings, serialize the data first. If feature values are categorical strings, apply feature discretization before training.
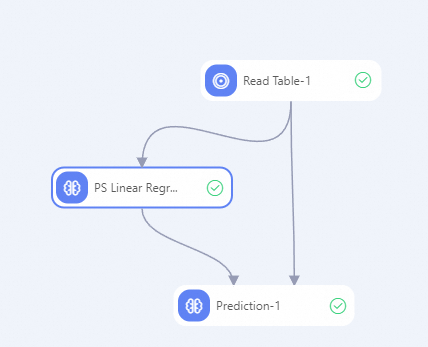
Step 2: Build the workflow
Build a workflow in Designer using the components shown below. For details on workflow creation, see Algorithm modeling.
Step 3: Configure the components
Read Table-1:
On the Select Table tab, set Table Name to lm_test_input.
PS Linear Regression:
Use the settings below. Leave all other parameters at their defaults.
| Parameter type | Parameter | Value |
|---|---|---|
| Fields setting | Is it a sparse format? | true |
| Feature Columns | features |
|
| Label Column | label |
|
| Execution tuning | Number of cores | 3 |
| Memory size per core | 1024 MB |
Prediction:
Use the settings below. Leave all other parameters at their defaults.
| Parameter type | Parameter | Value |
|---|---|---|
| Fields setting | Feature Columns | features |
| Verbatim Output Column | label, features |
|
| Sparse Matrix | Selected | |
| Key-value separator | : (colon) |
|
| KV pair separator | (leave blank to use space) |
Step 4: Run the workflow
Click the Run button ![]() on the canvas to start the workflow.
on the canvas to start the workflow.
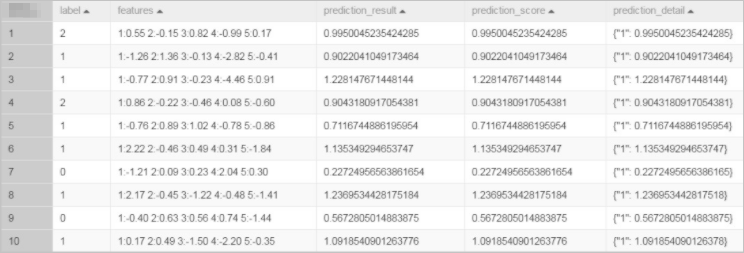
Step 5: View prediction results
After the workflow completes, right-click the Prediction-1 component and choose View Data > Prediction Result Output.
Run the same example with PAI commands
The following commands reproduce the workflow above using the PAI command interface. All commands use the same lm_test_input table.
Train:
PAI -name ps_linearregression
    -project algo_public
    -DinputTableName="lm_test_input"
    -DmodelName="linear_regression_model"
    -DlabelColName="label"
    -DfeatureColNames="features"
    -Dl1Weight=1.0
    -Dl2Weight=0.0
    -DmaxIter=100
    -Depsilon=1e-6
    -DenableSparse=true
Predict:
drop table if exists logistic_regression_predict;
PAI -name prediction
    -DmodelName="linear_regression_model"
    -DoutputTableName="linear_regression_predict"
    -DinputTableName="lm_test_input"
    -DappendColNames="label,features"
    -DfeatureColNames="features"
    -DenableSparse=true
The prediction output table (linear_regression_predict) contains the original label and features columns appended with the predicted scores.