x13_auto_arima is an algorithm for time series analysis that automatically selects an Autoregressive Integrated Moving Average (ARIMA) model. The algorithm is based on the procedure implemented by Gomez and Maravall (1998) in TRAMO (1996) and its subsequent revisions. It automatically identifies and selects the optimal ARIMA parameters to account for the seasonal and trend characteristics of the data. This automated process simplifies model building and improves prediction accuracy and efficiency.
Algorithm description
The x13_auto_arima component selects a model as follows:
Default model estimation
If
frequency = 1, the default model is(0,1,1).If
frequency > 1, the default model is(0,1,1)(0,1,1).Identification of differencing orders
If you set the diff and seasonalDiff parameters, this step is skipped.
You can use
unit root teststo determine the difference d and the seasonal difference D.Identification of ARMA model orders
The most appropriate model is selected based on the Bayesian information criterion (BIC). The maxOrder and maxSeasonalOrder parameters are used in this step.
Comparison of the identified model with the default model
The Ljung-Box Q statistic is used to compare the models. If both models are unacceptable, the
(3,d,1)(0,D,1)model is used.Final model checks
For more information about ARIMA, see Wikipedia. The algorithm has the following limits on the data scale:
Supported scales
Rows: A maximum of 1,200 records per group.
Columns: One numeric column.
Resource calculation method
If
groupColNamesis not set, the default calculation method applies.coreNum=1 memSizePerCore=4096Configuring groupColNames and the default calculation method
coreNum=floor(Total number of rows/120000)
memSizePerCore=4096
Limits
MaxCompute is the supported compute engine.
Component configuration
Method 1: Use the Designer UI
In your Designer workflow, add the x13_auto_arima component and configure its parameters in the pane that appears on the right.
Parameter type | Parameter | Description |
Field settings | Time series | Required. This column is used only to sort the value column. The specific values are not used in calculations. |
Value column | Required. | |
Group column | Optional. The group columns. To specify multiple columns, separate them with commas (,), for example, col0,col1. A time series is created for each group. | |
Parameter settings | Start date | The supported format is year.seasonal. Example: 1986.1. |
Series frequency | The value must be a positive integer in the range of (0, 12]. | |
Maximum p and q | The value must be a positive integer in the range of (0, 4]. | |
Maximum seasonal p and q | The value must be a number in the range of (0, 2]. | |
Maximum difference d | The value must be a positive integer in the range of (0, 2]. | |
Maximum seasonal difference d | You can enter a number in the range (0, 1]. | |
Difference d | The value must be a positive integer in the range of (0, 2]. If you set both the diff and maxDiff parameters, the maxDiff parameter is ignored. You must set the diff and seasonalDiff parameters together. | |
Seasonal difference d | Enter a value in the range (0, 1]. If you set both the seasonalDiff and maxSeasonalDiff parameters, the maxSeasonalDiff parameter is ignored. | |
Number of predictions | The number of entries to predict. For example, if you use the daily sales data of the last month to predict the sales for the next week, set this parameter to 7. If you specify group columns, this number of entries is predicted for each group. The value must be a positive integer in the range of (0, 120]. | |
Prediction confidence interval | The default value is 0.95. | |
Tolerance | Optional. The default value is 1e-5. | |
Maximum iterations | The value must be a positive integer. The default value is 1500. | |
Execution tuning | Number of cores | The number of workers. By default, the system automatically calculates this value. |
Memory size | The amount of memory per worker in MB. |
Method 2: Use a PAI command
You can use a PAI command to configure the parameters of the x13_auto_arima component. You can use the SQL script component to run PAI commands. For more information, see SQL Script.
PAI -name x13_auto_arima
    -project algo_public
    -DinputTableName=pai_ft_x13_arima_input
    -DseqColName=id
    -DvalueColName=number
    -Dstart=1949.1
    -Dfrequency=12
    -DpredictStep=12
    -DoutputPredictTableName=pai_ft_x13_arima_out_predict2
    -DoutputDetailTableName=pai_ft_x13_arima_out_detail2
Parameter | Required | Default value | Description |
inputTableName | Yes | None | The name of the input table. |
inputTablePartitions | No | All partitions are used by default. | The feature columns in the input table to use for training. |
seqColName | Yes | None | The time series column. This column is used only to sort the valueColName column. |
valueColName | Yes | None | The value column. |
groupColNames | No | None | The group columns. To specify multiple columns, separate them with commas (,), such as "col0,col1". A time series is created for each group. |
start | No | 1.1 | The start date of the time series. The value must be a string in the |
frequency | No | 12 Note A value of 12 indicates 12 months per year. | The frequency of the time series. The value must be a positive integer in the range of (0, 12]. For more information, see Time series format. |
maxOrder | No | 2 | The maximum values of p and q. The value must be a positive integer in the range of [0, 4]. |
maxSeasonalOrder | No | 1 | The maximum values for the seasonal parameters p and q are integers in the range [0,2]. |
maxDiff | No | 2 | The maximum value of difference d. The value must be a positive integer in the range of [0, 2]. |
maxSeasonalDiff | No | 1 | The maximum value of the seasonal difference d, which must be an integer in the range [0,1]. |
diff | No | -1 Note A value of -1 indicates that diff is not specified. | The difference d. The value must be a positive integer in the range of [0, 2]. If you set both the diff and maxDiff parameters, the maxDiff parameter is ignored. You must set the diff and seasonalDiff parameters together. |
seasonalDiff | No | -1 Note A value of -1 indicates that seasonalDiff is not specified. | The seasonal difference d. The value must be a positive integer in the range of [0, 1]. If you set both the seasonalDiff and maxSeasonalDiff parameters, the maxSeasonalDiff parameter is ignored. |
maxiter | No | 1500 | The maximum number of iterations. The value must be a positive integer. |
tol | No | 1e-5 | The tolerance. The value must be of the DOUBLE type. |
predictStep | No | 12 | The number of prediction entries. The value must be a number in the range of (0, 365]. |
confidenceLevel | No | 0.95 | The prediction confidence level. The value must be a number in the range of (0, 1). |
outputPredictTableName | Yes | None | The prediction output table. |
outputDetailTableName | Yes | None | The table that contains the detailed information. |
outputTablePartition | No | The output is not written to a partition by default. | The output partition. Specify the partition name. |
coreNum | No | Automatically calculated by default. | The number of workers. This parameter is used with the memSizePerCore parameter. The value must be a positive integer. |
memSizePerCore | No | Automatically calculated by default. | The memory size of each worker, in MB. The value must be a positive integer in the range of [1024, 64 × 1024]. |
lifecycle | No | By default, a lifecycle is not configured. | The lifecycle of the output table. |
Time series format
The start and frequency parameters specify two time dimensions, ts1 and ts2, for the data in the value column:
frequency: The frequency of data within a unit period. This is the frequency of ts2 within each ts1.
start: The start date in the
n1.n2format. This indicates that the start date is the n2th ts2 in the n1th ts1.
Time unit | ts1 | ts2 | frequency | start |
12 months/year | Year | Month | 12 | 1949.2 indicates the second month of 1949. |
Quarterly | Year | Quarter | 4 | 1949.2 indicates the second quarter of 1949. |
7 days/week | Week | Day | 7 | 1949.2 indicates the second day of the 1949th week. |
1 | Any time unit | 1 | 1 | 1949.1 indicates 1949 (year, day, or hour). |
For example, if value=[1,2,3,5,6,7,8,9,10,11,12,13,14,15]:
start=1949.3, frequency=12indicates that the data is monthly (12 months per year) and the prediction starts from May 1950.year
Jan
Feb
Mar
Apr
May
Jun
Jul
Aug
Sep
Oct
Nov
Dec
1949
1
2
3
4
5
6
7
8
9
10
1950
11
12
13
14
15
start=1949.3, frequency=4indicates that the data is quarterly (four quarters per year) and the prediction starts from the first quarter of 1953.Year
Qtr1
Qtr2
Qtr3
Qtr4
1949
1
2
1950
3
4
5
6
1951
7
8
9
10
1952
11
12
13
14
1953
15
start=1949.3, frequency=7indicates that the data is recorded 7 days per week. The prediction starts from 1951.04.week
Sun
Mon
Tue
Wed
Thu
Fri
Sat
1949
1
2
3
4
5
1950
6
7
8
9
10
11
12
1951
13
14
15
start=1949.1, frequency=1indicates any time unit, and the prediction starts from 1963.cycle
p1
1949
1
1950
2
1951
3
1952
4
1953
5
1954
6
1955
7
1956
8
1957
9
1958
10
1959
11
1960
12
1961
13
1962
14
1963
15
Examples
Prepare data
This example uses the AirPassengers.csv dataset, which contains the number of international airline passengers per month from 1949 to 1960. The following table shows a sample of the data. For more information about the dataset, see AirPassengers.
id | number |
1 | 112 |
2 | 118 |
3 | 132 |
4 | 129 |
5 | 121 |
... | ... |
You can run the following Tunnel command on the MaxCompute client to upload the data. For more information about how to install and configure the MaxCompute client, see Connect to MaxCompute using the client (odpscmd). For more information about Tunnel commands, see Tunnel commands.
create table pai_ft_x13_arima_input(id bigint,number bigint);
tunnel upload xxx/airpassengers.csv pai_ft_x13_arima_input -h true;
Run the PAI command
You can use the SQL Script component or the ODPS SQL component to run the following PAI command.
PAI -name x13_auto_arima
    -project algo_public
    -DinputTableName=pai_ft_x13_arima_input
    -DseqColName=id
    -DvalueColName=number
    -Dstart=1949.1
    -Dfrequency=12
    -DmaxOrder=4
    -DmaxSeasonalOrder=2
    -DmaxDiff=2
    -DmaxSeasonalDiff=1
    -DpredictStep=12
    -DoutputPredictTableName=pai_ft_x13_arima_auto_out_predict
    -DoutputDetailTableName=pai_ft_x13_arima_auto_out_detail
Output description:
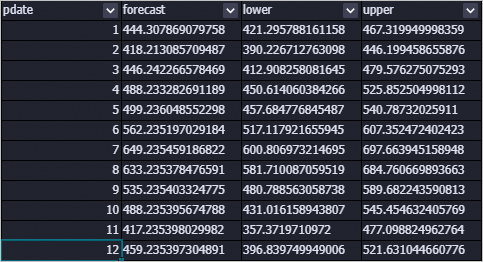
Output table: outputPredictTableName
Field description
column name
comment
pdate
The prediction date.
forecast
The prediction result.
lower
The lower bound of the prediction result at the specified confidence level. The default confidence level is 0.95.
upper
The upper bound of the prediction result at the specified confidence level. The default confidence level is 0.95.
Displaying data
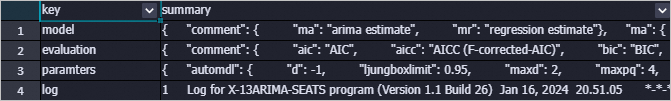
Output table: outputDetailTableName
Description
column name
comment
key
model: The model.
evaluation: The evaluation result.
parameters: The training parameters.
log: The training log.
summary
Stores the specified information.
Data view
FAQ
Why are all prediction results the same?
If an exception occurs during model training, the system defaults to the mean model. In this case, all prediction results are the mean of the training data. Common exceptions include instability after time series differencing, training that does not converge, and a variance of 0. You can view the stderr file of an individual node in Logview to find specific exception information.
How do I configure the component parameters?
You need to set parameters such as p, d, q, sp, sd, and sq for the x13_arima component. If you are unsure how to configure them, we recommend that you use
The x13_auto_arima component automatically searches for the optimal parameters. You only need to set an upper bound.
Error message:
ERROR: Number of observations after differencing and/or conditional AR estimation is 9, which is less than the minimum series length required for the model estimated, 24This error occurs because there is not enough data. You can adjust the frequency or add more data.
Error message:
ERROR: Order of the MA operator is too largeThis error occurs because there is not enough data.
Error message:
ERROR: Series to be modelled and/or seasonally adjusted must have at least 3 complete years of dataIf you specify seasonal parameters, at least three years of data is required.
References
The x13_arima component provides an ARIMA algorithm for seasonal adjustment and is based on the open-source X-13ARIMA-SEATS. You can use this component to process data. For more information, see x13_auto_arima.