View experiment reports
An experiment report compares the metric data of each experiment version to help you evaluate experiment results.
After you create and start an experiment, view the report regularly to track the progress of the experiment.
Prerequisites
You have registered a data table and created metrics. For instructions, see Metric Management.
You have created and started an experiment and attached the experiment metrics. For instructions, see Create an experiment.
Go to the experiment report page
Go to the ABTest page.
Log on to the PAI console.
In the left-side navigation pane, click Workspaces. On the Workspaces page, click the name of the workspace that you want to manage.
In the left-side navigation pane, choose .
On the PAI-ABTest page, in the left-side navigation pane, choose Experiment Management > Experiments.
In the experiment list on the right, click Report in the Actions column of the target experiment. The Experiment Report tab opens on the Experiment Details page.
Read an experiment report
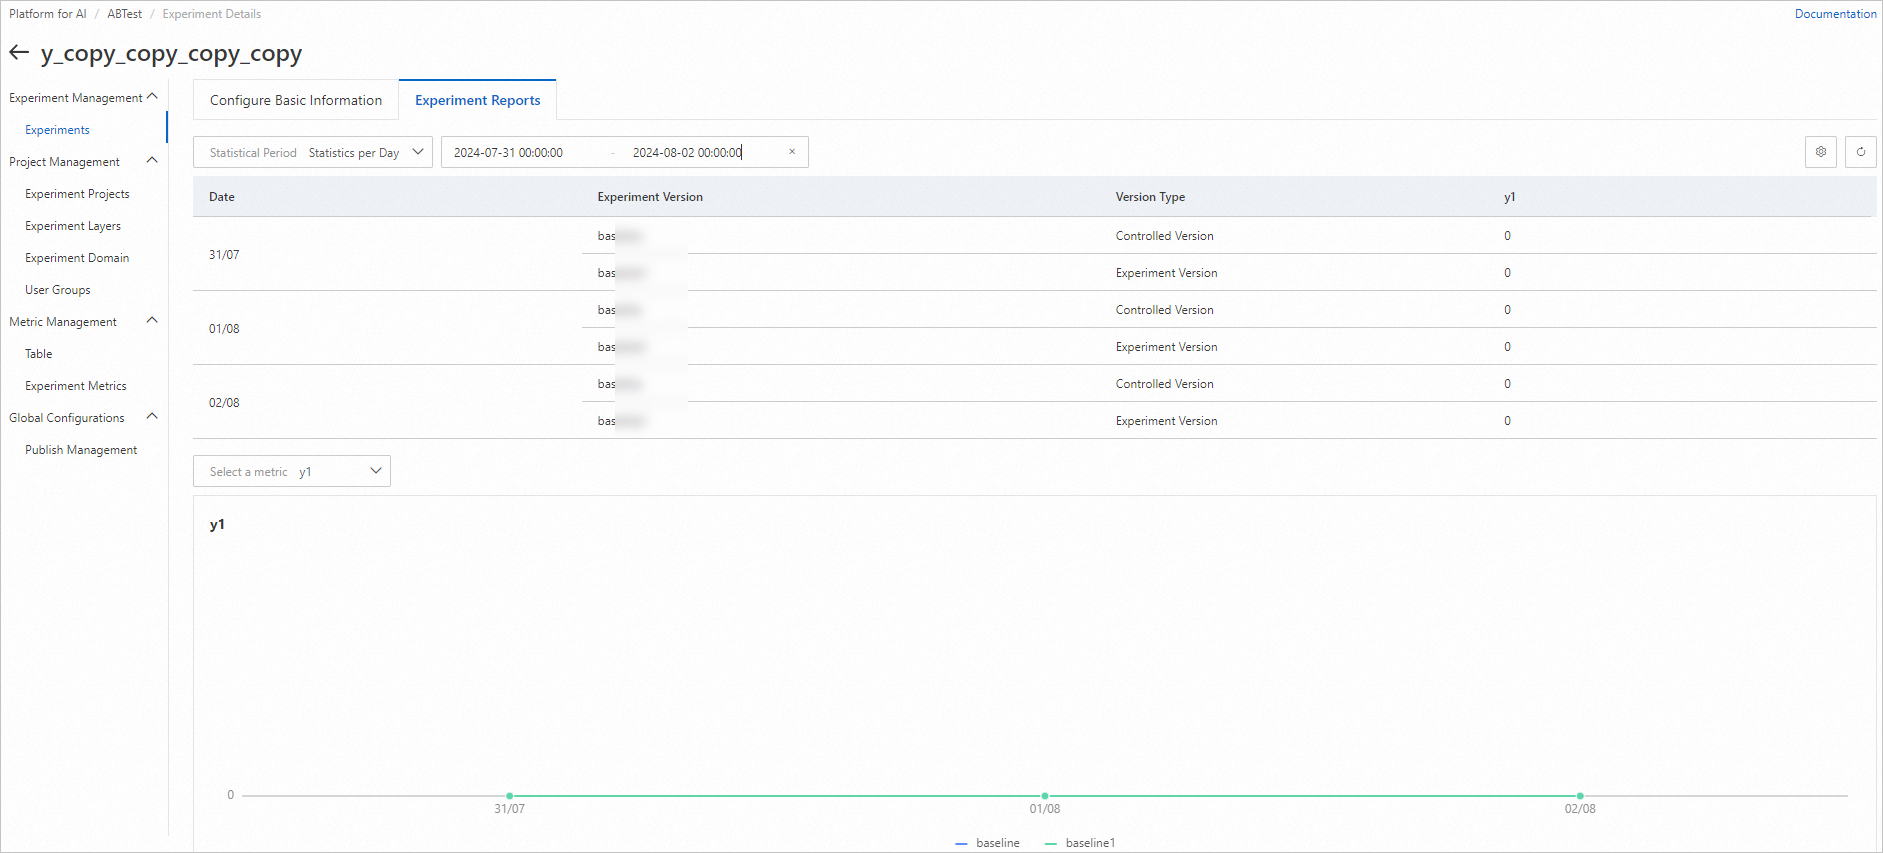
An experiment report displays the core information of the experiment in a visual chart: the experiment date, the experiment versions, the groups (the experiment version and the control version), and the related metric information.
Use the metric data of the control version as the baseline for comparison with each experiment version. The comparison shows the performance differences between the versions.
Filter an experiment report
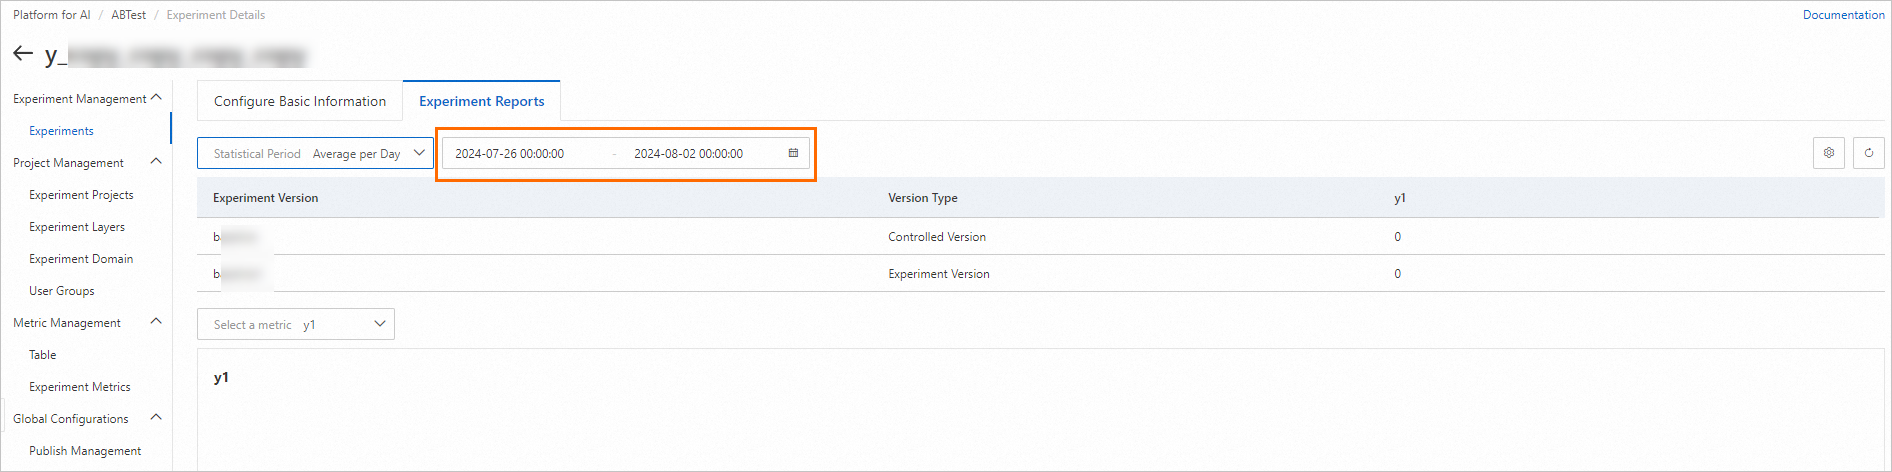
You can filter the content of an experiment report by statistical period and time range.
Statistical period
The following table describes the statistical periods available for an experiment report.
| Statistical period | Description |
| Day: Daily average value | The system extracts daily metric data based on the selected time range and calculates the average value. This lets you view the metric data of different experiment versions over a period of time.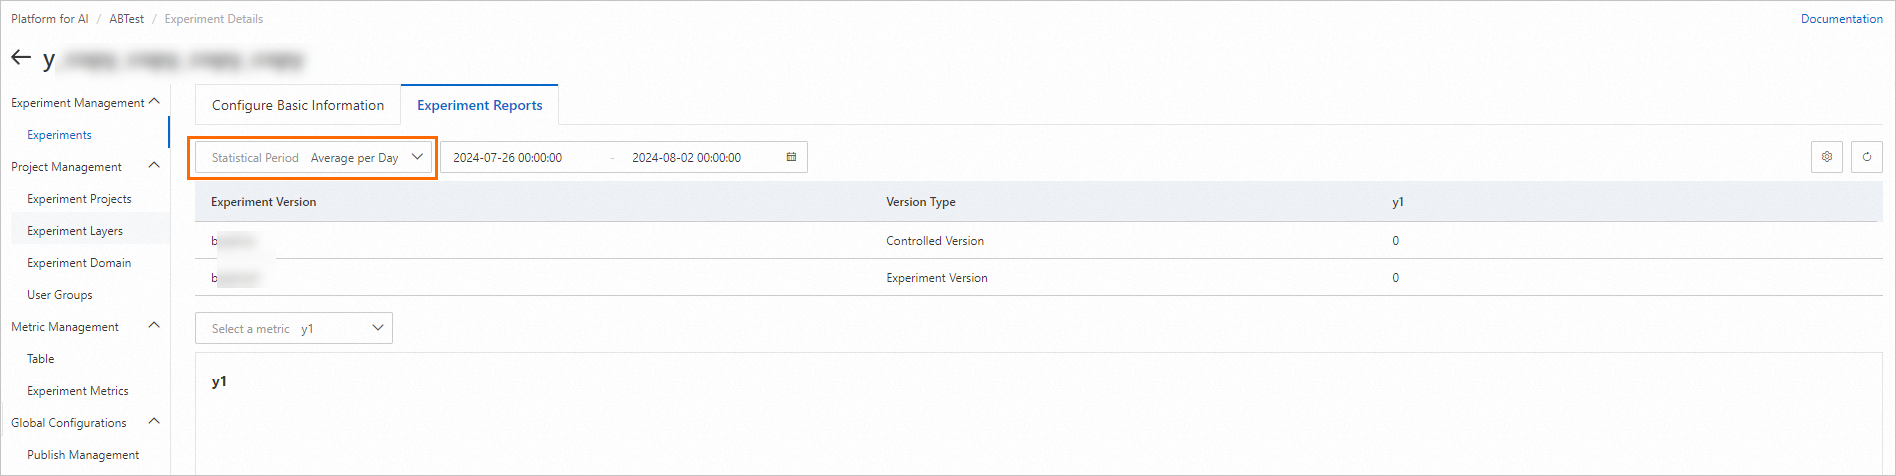 |
| Day: Daily statistics | The system aggregates metric data by day. You can view the daily change trends of the metric data.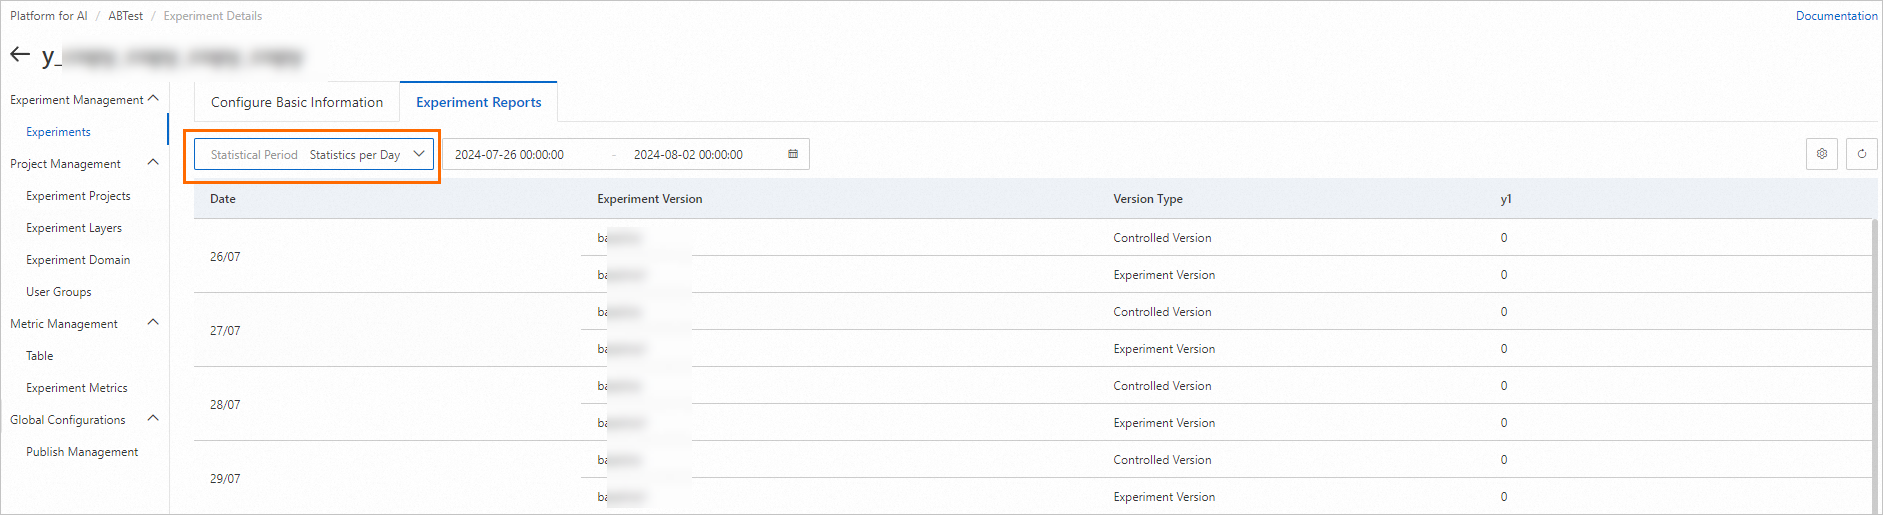 |
| Hour: Hourly average | The system extracts hourly metric data based on the selected time range and calculates the average value.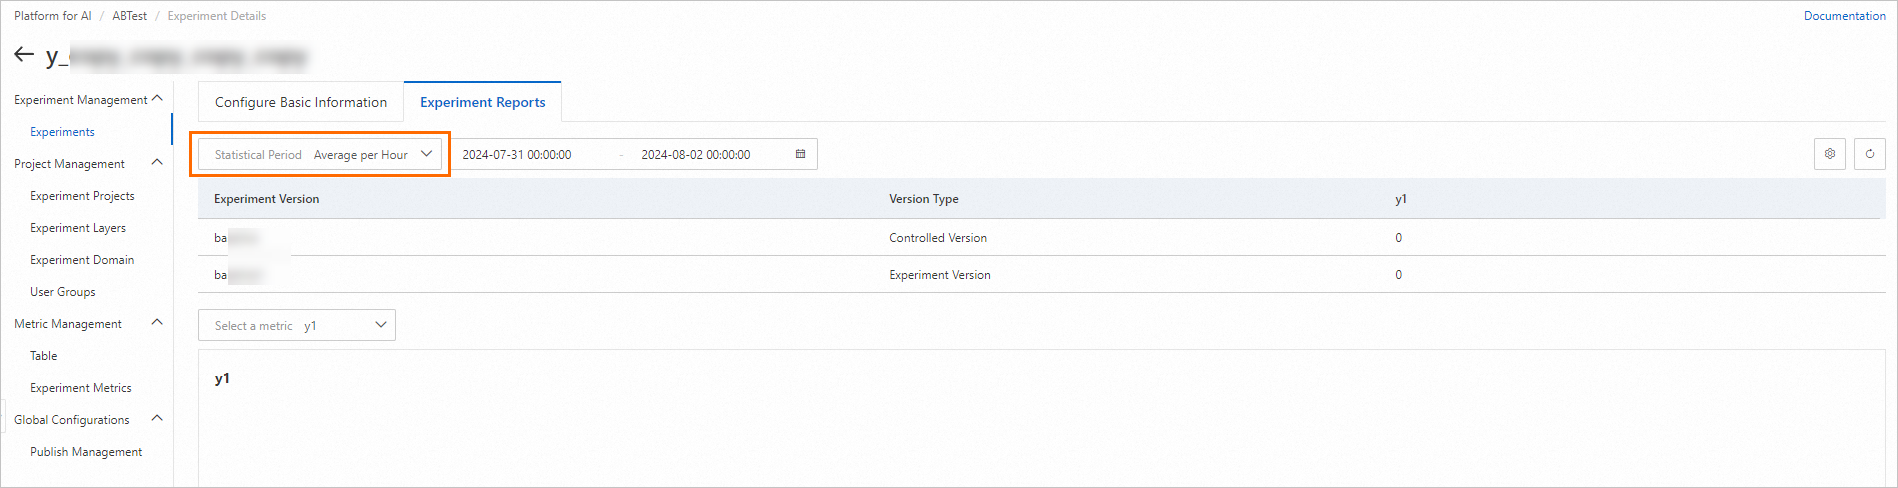 |
| Hour: Hourly statistics | The system aggregates metric data by hour. You can view the hourly change trends of the metric data.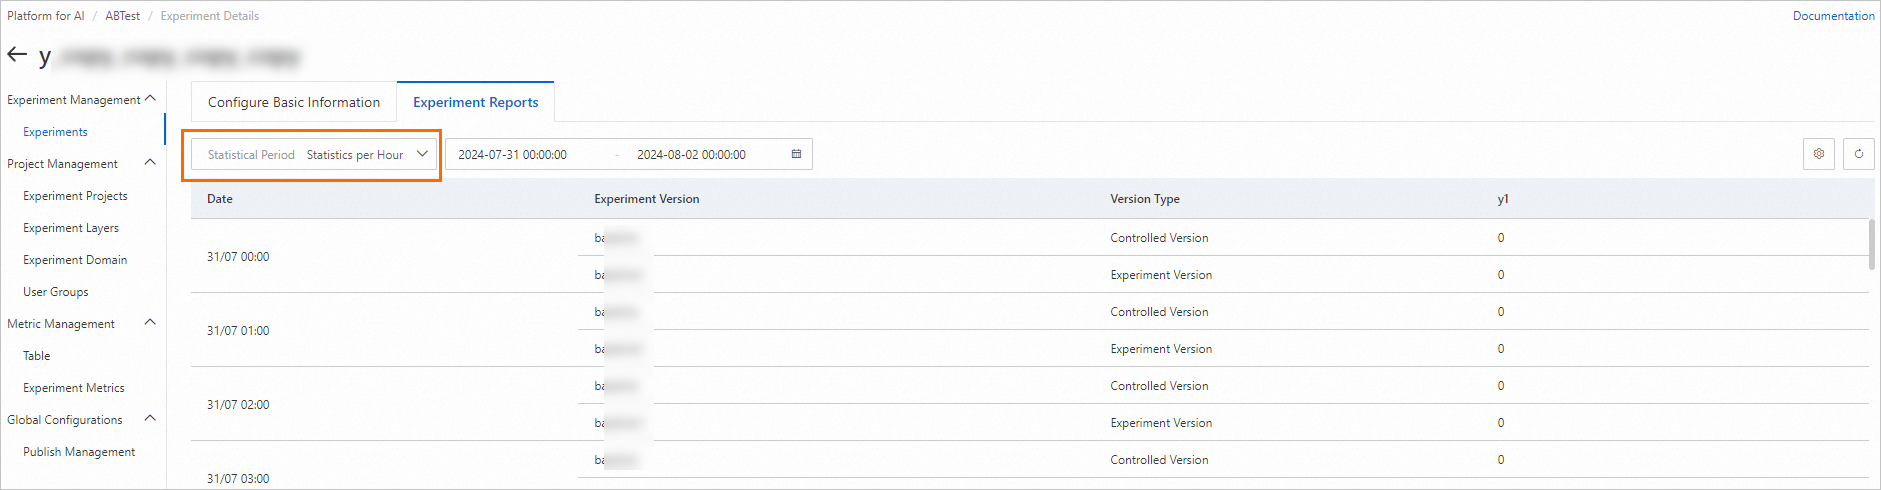 |
Time range
The experiment report is displayed for the selected time range.