Partial Result Cache (PTRC)
You can use the Partial Result Cache (PTRC) feature in PolarDB for MySQL to improve query performance by caching intermediate result sets from operators within a query. This reduces redundant computations for complex operators. This topic describes the concept of PTRC, its working principle, its cost-based selection, and its dynamic feedback mechanism.
Concepts
PTRC is a feature that caches the result set of an operator within a query. For example, it can cache temporary results from operators such as a correlated subquery or a nested loop join. If the same operator is executed again, the system can reuse the cached result instead of re-executing it.
The "Partial" in PTRC has two meanings:
-
PTRC caches the intermediate result set of one or more operators within a query, not the result set of the entire query.
-
It does not necessarily cache the entire intermediate result set of an operator. Due to memory limits, it might cache only a portion of the results.
Compared with a traditional query cache, PTRC operates at a finer granularity by accelerating specific operators within a query. The cache exists only for the duration of the query's execution. This approach provides wider applicability. Because the optimization is internal to a single query, it avoids data consistency issues across nodes. Any operator can use PTRC if it produces a deterministic result for a given set of input parameters. The optimizer decides whether to use PTRC based on cost.
How it works
The core idea of PTRC is to cache the intermediate result sets of operators to avoid redundant executions. PTRC can accelerate an operator if it meets the following conditions:
-
The operator depends on correlated parameters for its execution and is executed multiple times. Examples include nested loop join and correlated subquery operators.
-
For the same correlated parameters, the operator's result is always the same. For example, the operator cannot contain non-deterministic functions such as
RANDOM(),NOW(), or user-defined functions (UDFs). Using them would compromise the final result's correctness.
Correlated parameters are external parameters that an operator depends on during its execution. For example, in a join operation t1 join t2 on t1.a = t2.a, if the t1 table is the driving table, each row from the t1 table is joined with the t2 table. In this case, t1.a is considered a correlated parameter for the nested loop join operator. If the t1.a column in the t1 table contains many duplicate values, PTRC can reduce redundant computation. Another example is a correlated subquery, where each execution of the subquery depends on a value from the outer query.
The TPC-H Q17 query illustrates how PTRC works. The query is as follows:
SELECT
        sum(l_extendedprice) / 7.0 AS avg_yearly
FROM
        lineitem,
        part
WHERE
        p_partkey = l_partkey
        AND p_brand = 'Brand#34'
        AND p_container = 'MED BOX'
        AND l_quantity < (
                SELECT
                        0.2 * avg(l_quantity)
                FROM
                        lineitem
                WHERE
                        l_partkey = p_partkey
        );
PTRC uses the operator's correlated parameters as the key and the execution result as the value. For TPC-H Q17, the PTRC cache format is: key = p_partkey, value = [true/false].
The following figure shows the main execution flow of PTRC for the correlated subquery in TPC-H Q17: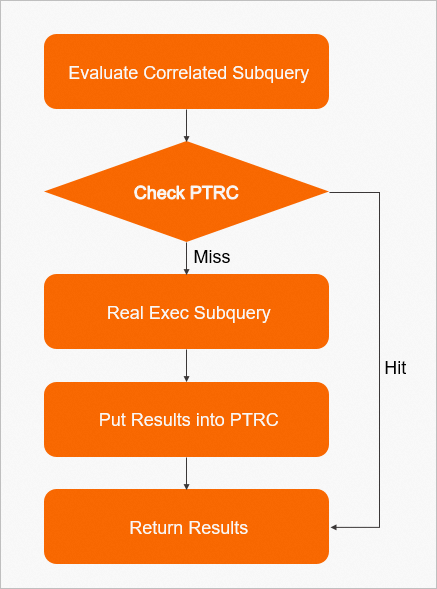
Each time the correlated subquery is evaluated, the system looks up the result in the PTRC cache by using the value of p_partkey:
-
If the result is not found (a cache miss), the system executes the subquery and stores the result in the PTRC cache.
-
If the result is found (a cache hit), the system returns the cached value directly, avoiding a redundant subquery execution.
In TPC-H Q17, the subquery runs after the part table and the lineitem table are joined. The result of the join contains many duplicate values for p_partkey, which is the correlated parameter for the subquery. As a result, PTRC achieves a very high cache hit rate, resulting in significant performance gains.
You can use the EXPLAIN command to view the execution plan. A Partial Result Cache operator in the execution plan before the subquery indicates that PTRC is used. For example, in the EXPLAIN output for TPC-H Q17, Partial result cache: keys(part.P_PARTKEY) is the PTRC cache node.
*************************** 1. row ***************************
EXPLAIN: -> Aggregate: sum(lineitem.L_EXTENDEDPRICE)
    -> Nested loop inner join  (cost=743267.04 rows=509876)
        -> Filter: ((part.P_CONTAINER = 'MED BOX') and (part.P_BRAND = 'Brand#34'))  (cost=204145.06 rows=19096)
            -> Table scan on part  (cost=204145.06 rows=1909557)
        -> Filter: (lineitem.L_QUANTITY < (select #2))  (cost=25.56 rows=27)
            -> Index lookup on lineitem using LINEITEM_FK2 (L_PARTKEY=part.P_PARTKEY)  (cost=25.56 rows=27)
            -> Select #2 (subquery in condition; dependent)
                -> Partial result cache: keys(part.P_PARTKEY)
                    -> Aggregate: avg(lineitem.L_QUANTITY)
                        -> Index lookup on lineitem using LINEITEM_FK2 (L_PARTKEY=part.P_PARTKEY)  (cost=28.23 rows=27)
Prerequisites
Your PolarDB for MySQL cluster must be version 8.0, with a revision of 8.0.2.2.9 or later. You can check your cluster version by following the instructions in Query engine versions.
Parameters
|
Parameter |
Level |
Description |
|
partial_result_cache_enabled |
Global/Session |
Enables or disables the Partial Result Cache (PTRC) feature. Valid values:
|
|
partial_result_cache_cost_threshold |
Global/Session |
The cost threshold for PTRC. The optimizer only considers using PTRC if a query's total cost exceeds this threshold. Value range: 0 to 18446744073709551615. Default value: 10000. |
|
partial_result_cache_check_frequency |
Global/Session |
The frequency at which the dynamic feedback mechanism is triggered. A check occurs when the cumulative number of cache misses reaches this value. Value range: 0 to 18446744073709551615. Default value: 200. |
|
partial_result_cache_low_hit_rate |
Global/Session |
The low watermark threshold for the cache hit rate. The optimizer considers using PTRC only if the estimated hit rate is above this value. If PTRC is already in use, the dynamic feedback mechanism disables it if the actual hit rate falls below this threshold. Value range: 0 to 100. Default value: 20. |
|
partial_result_cache_high_hit_rate |
Global/Session |
The high watermark threshold for the cache hit rate. When memory usage reaches its limit and the hit rate is above this value, the system moves the cache from memory to disk storage. Existing cached data is also moved to disk. Value range: 0 to 100. Default value: 70. |
|
partial_result_cache_max_mem_size |
Global/Session |
The cumulative amount of memory that PTRC can use for a single query. If a query contains multiple operators that use PTRC, their combined memory usage cannot exceed this limit. Value range: 0 to 18446744073709551615. Unit: Bytes. Default value: 67108864. |
Cost-based selection
As the PTRC execution flow shows, enabling PTRC is not always beneficial. Its effectiveness depends on the cache hit rate. If the hit rate is low, PTRC can add performance overhead from operations such as cache checks and increased memory consumption.
To avoid unnecessary overhead, the optimizer uses a cost-based approach to decide whether to use PTRC. It evaluates two main factors:
-
The optimizer considers using PTRC only if the query's total cost exceeds the
partial_result_cache_cost_thresholdvalue. -
The estimated cache hit rate for the operator must be higher than the
partial_result_cache_low_hit_ratevalue.
When making a cost-based decision, the optimizer first checks the partial_result_cache_cost_threshold parameter.
-
If the total cost of a query is below this threshold, the optimizer considers the query low-cost and likely to execute quickly. The performance gain from PTRC would be minimal, and the overhead from cache checks could increase latency for short, high-concurrency queries. Therefore, the optimizer uses this global cost threshold to bypass PTRC entirely for inexpensive queries. This also saves the optimizer from the overhead of evaluating all expressions for PTRC eligibility.
-
If the query's total cost is greater than or equal to
partial_result_cache_cost_threshold, the optimizer evaluates all operators that are eligible for PTRC and estimates their cache hit rate by using the following formula:hit_rate = (fanout - ndv) / fanoutIn this formula,
fanoutis the total number of times an operator is expected to be executed, andndvis the number of distinct values for the PTRC key, which is the combination of all correlated parameters.
If the estimated hit_rate is lower than the partial_result_cache_low_hit_rate value, the optimizer does not use PTRC for that operator. However, in the existing MySQL cost model, statistics depend on table index or histogram data. If the columns of the correlated parameters lack an index or a histogram, the optimizer cannot accurately estimate the ndv. In such cases, the optimizer may proactively enable PTRC and rely on the dynamic feedback mechanism during execution to determine whether to continue using it.
Dynamic feedback mechanism
During the execution phase, every cache hit or miss is recorded in the statistics. The dynamic feedback mechanism uses this information to calculate the actual cache hit rate. If the actual cache hit rate drops below the partial_result_cache_low_hit_rate value, the mechanism immediately disables PTRC for the remainder of the execution. This reverts the query to its original execution plan and reduces the overhead from an inefficient cache.
The partial_result_cache_check_frequency parameter controls how often the dynamic check is performed. It specifies the number of cumulative cache misses that trigger a check. For example, with the default value of 200, the dynamic feedback mechanism is triggered after 200 cache misses.
Because the result set is cached in memory, the dynamic feedback mechanism is also triggered when PTRC memory usage reaches its limit. In this scenario, the mechanism not only checks if the cache hit rate is too low but also decides whether to perform data eviction or spill the result set to disk.
When PTRC memory usage reaches its limit, the following feedback policy applies:
-
If the
hit_rateis below thepartial_result_cache_low_hit_ratevalue, the system considers the hit rate too low and disables PTRC. -
If the
hit_rateis above thepartial_result_cache_high_hit_ratevalue, the system moves the cache data from memory to disk storage. A predictable performance improvement is still expected even with disk-based caching. -
If the
hit_rateis between the low and high watermark thresholds, the system triggers a least recently used (LRU) data eviction policy. The least recently used data is cleared from the cache to make space for new data. If the memory limit is reached again after new data is cached, the process repeats, starting from step 1.
The partial_result_cache_max_mem_size parameter limits the cumulative memory usage for PTRC within a single query. If the total memory used by all PTRC instances in a query exceeds this limit, the system triggers the dynamic feedback mechanism for all of them.
Performance test
As discussed in the cost-based selection section, the main factors that affect the performance benefits of PTRC are:
-
The execution cost of the accelerated operator must be sufficiently high. If the operator itself is inexpensive to run, the potential performance gain from caching is limited.
-
The cache hit rate must be high, as a higher rate yields more significant performance improvements.
Take the TPC-H Q17 test as an example:
SELECT sum(l_extendedprice) / 7.0 AS avg_yearly
FROM lineitem, part
WHERE p_partkey = l_partkey
    AND p_brand = 'Brand#34'
    AND p_container = 'MED BOX'
    AND l_quantity < (
        SELECT 0.2 * avg(l_quantity)
        FROM lineitem
        WHERE l_partkey = p_partkey
    );
The subquery in this query runs many times. The following execution plan shows that PTRC is in use. In the EXPLAIN tree for TPC-H Q17, the Partial result cache: keys(part.P_PARTKEY) node indicates that PTRC is applied to the dependent subquery:
EXPLAIN: -> Aggregate: sum(lineitem.L_EXTENDEDPRICE)
    -> Nested loop inner join  (cost=743267.04 rows=509876)
        -> Filter: ((part.P_CONTAINER = 'MED BOX') and (part.P_BRAND = 'Brand#34'))  (cost=204145.06 rows=19096)
            -> Table scan on part  (cost=204145.06 rows=1909557)
        -> Filter: (lineitem.L_QUANTITY < (select #2))  (cost=25.56 rows=27)
            -> Index lookup on lineitem using LINEITEM_FK2 (L_PARTKEY=part.P_PARTKEY)  (cost=25.56 rows=27)
            -> Select #2 (subquery in condition; dependent)
                -> Partial result cache: keys(part.P_PARTKEY)
                    -> Aggregate: avg(lineitem.L_QUANTITY)
                        -> Index lookup on lineitem using LINEITEM_FK2 (L_PARTKEY=part.P_PARTKEY)  (cost=28.23 rows=27)
Test statistics show that enabling PTRC for the subquery in TPC-H Q17 achieves a cache hit rate of up to 96%, which results in a significant performance improvement. The following figure shows the test data: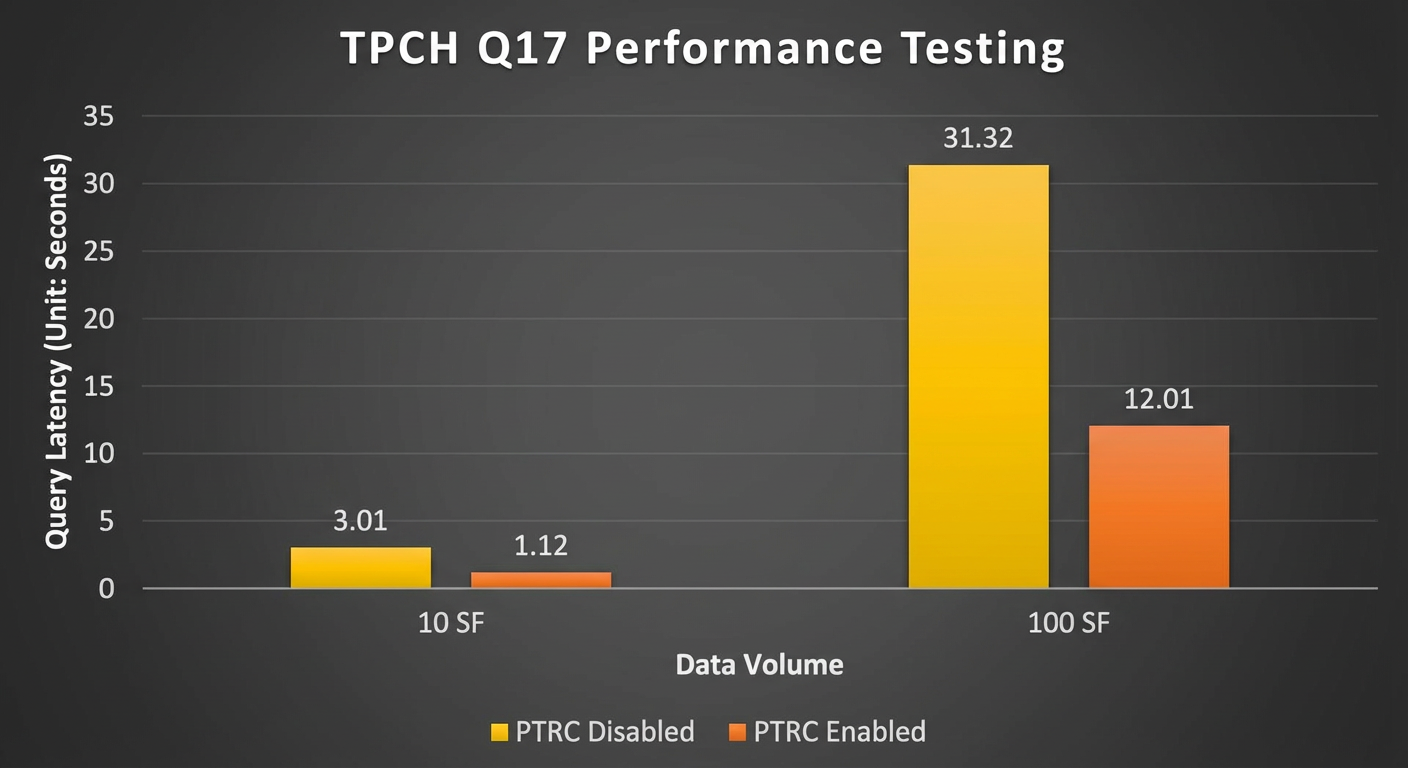
Summary
PTRC targets complex operators within a single query that depend on correlated parameters. By caching the intermediate result sets of these operators, it reduces redundant computations. You can achieve substantial performance gains if the cache hit rate is high enough. Currently, PTRC can accelerate various operators, including correlated subqueries and nested loop joins (which covers inner joins, outer joins, semi-joins, and anti-joins).