Try PolarDB PostgreSQL columnstore index for free
This topic describes how to try the columnstore index feature of PolarDB for PostgreSQL for free.
Background
PolarDB columnstore index is a query acceleration solution developed for hybrid transactional and analytical processing (HTAP) scenarios and slow SQL statement scenarios in online transactional processing (OLTP). Typical scenarios include real-time statistics and analysis, flexible queries where composite indexes are inefficient, spatiotemporal statistics based on geographic grids, and accelerated statistics for cold data combined with OSS. The advantages include the following:
-
High performance: Performance can be 15 to 30 times faster, and up to 100 times faster, than the native PostgreSQL row store execution engine. For example, in TPC-H scenarios, performance is nearly 60 times faster.
-
Low cost: Create columnstore indexes only for the columns used in queries. You do not need to convert the entire table to a column store format. Columnstore indexes require less storage space. In addition, PolarDB for PostgreSQL supports queries and analysis of cold data in OSS, which can effectively reduce data storage costs.
-
Ease of use: The feature is compatible with PostgreSQL syntax and supports the PostgreSQL indexing mechanism. It also supports fine-grained control over OLTP and online analytical processing (OLAP) queries.
-
Real-time consistency: The feature automatically maintains real-time data consistency between the row store and the column store. You do not need to build a separate data transformation pipeline.
-
Comprehensive features:
-
Supports
Prepared Statementsyntax. -
Supports partitioned tables and
pg_pathman. -
Accelerates
SELECTstatements within transaction blocks. -
Supports extract, transform, and load (ETL) features such as
CREATE TABLE AS.
-
Alibaba Cloud provides the Business Foundation System Solutions Experience Center. This center offers a real, free PolarDB cluster environment and out-of-the-box testing methods. You can quickly experience the performance improvements provided by the columnstore index online.
Impact
This free trial does not involve your production environment and will not affect your business.
Costs
The resources used in this trial are not part of your account, and no fees will be incurred. You can proceed with the trial without concern.
Trial content
Trial environment
Alibaba Cloud provides a pre-configured environment for this free trial. The details of the environment are as follows:
-
Cluster: A PolarDB for PostgreSQL cluster is provided. The details are as follows:
-
Kernel version: 14.13.27.0
-
Edition: Enterprise Edition
-
Series: Cluster Edition, Dedicated
-
Cluster specifications: The cluster includes one primary node and one read-only node. Each node has 2 cores and 8 GB of memory.
-
Storage class: PSL5
-
-
Test dataset: The cluster is pre-loaded with the standard TPC-H 10 GB dataset.
Metrics to observe
-
CPU utilization: The average CPU utilization of the primary node, read-only node, and read-only column store node in the cluster.
-
Query duration: The time it takes to execute a specific SQL statement, in seconds.
Procedure
-
Go to the Business Foundation System Solutions Experience Center to try the Columnstore Index/Table - Accelerate Complex TP SQL Queries trial for free.
-
In the product options, select PolarDB PostgreSQL.
-
Click the Create Free Trial Task button at the bottom of the page.
-
In the Confirm Creation of Query Acceleration Trial Task dialog box, click OK.
-
After a moment, your trial task appears.
-
Click View Details to go to the real-time query experience page.
-
Run SQL queries for two scenarios: single-table statistics and multi-table JOINs. Use both the row store engine and the column store engine.
Note-
Follow the on-screen prompts and click the buttons to perform each step. If you do not click a button before the countdown ends, the operation is performed automatically.
-
During the trial, you can observe the CPU utilization in the trend chart at the bottom.
-
Click Start Task.
-
Click Select Database. The system automatically runs the following command to switch to the target database.
\c mydb -
First, run a query for the single-table statistics scenario.
-
First, run a standard query for single-table statistics. Click Disable Vectorized Engine. The system automatically runs the following command.
set polar_csi.enable_query to off; -
Click View SQL Execution Plan. The system automatically runs the following command to view the execution plan for the SQL statement.
explain select
   l_returnflag,
   l_linestatus,
   sum(l_quantity) as sum_qty,
   sum(l_extendedprice) as sum_base_price,
   sum(l_extendedprice * (1 - l_discount)) as sum_disc_price,
   sum(l_extendedprice * (1 - l_discount) * (1 + l_tax)) as sum_charge,
   avg(l_quantity) as avg_qty,
   avg(l_extendedprice) as avg_price,
   avg(l_discount) as avg_disc,
   count(*) as count_order
from
   lineitem
where l_shipdate <= date '1998-12-01' - '60 day'::interval
 group by
   l_returnflag,
   l_linestatus
order by
   l_returnflag,
   l_linestatus;
The query plan does not use the columnstore index. The following result is returned:
QUERY PLAN --------------------------------------------------------------------------------------------------------- Finalize GroupAggregate (cost=2307510.18..2307512.14 rows=6 width=236) Group Key: l_returnflag, l_linestatus -> Gather Merge (cost=2307510.18..2307511.58 rows=12 width=236) Workers Planned: 2 -> Sort (cost=2306510.16..2306510.17 rows=6 width=236) Sort Key: l_returnflag, l_linestatus -> Partial HashAggregate (cost=2306509.95..2306510.08 rows=6 width=236) Group Key: l_returnflag, l_linestatus -> Parallel Seq Scan on lineitem (cost=0.00..1437900.14 rows=24817423 width=25) Filter: (l_shipdate <= '1998-10-02 00:00:00'::timestamp without time zone) (10 rows) -
Click Execute SQL. The system automatically runs the following SQL statement:
select
   l_returnflag,
   l_linestatus,
   sum(l_quantity) as sum_qty,
   sum(l_extendedprice) as sum_base_price,
   sum(l_extendedprice * (1 - l_discount)) as sum_disc_price,
   sum(l_extendedprice * (1 - l_discount) * (1 + l_tax)) as sum_charge,
   avg(l_quantity) as avg_qty,
   avg(l_extendedprice) as avg_price,
   avg(l_discount) as avg_disc,
   count(*) as count_order
from
   lineitem
where l_shipdate <= date '1998-12-01' - '60 day'::interval
 group by
   l_returnflag,
   l_linestatus
order by
   l_returnflag,
   l_linestatus;
The following result is returned. The running time is 21.034 seconds, and the CPU utilization increases significantly.
 l_returnflag | l_linestatus |   sum_qty    |  sum_base_price   |  sum_disc_price   |     sum_charge      |     avg_qty      |    avg_price     |       avg_disc        | count_order
--------------+--------------+--------------+-------------------+-------------------+---------------------+------------------+------------------+-----------------------+------------
 A            | F            | 377518399.00 | 566065727797.25   | 537759104278.0656 | 559276670892.116819 | 25.5009751030070973 | 38237.151008958546 | 0.050006574540242320463 |    14804077
 N            | F            |   9851614.00 | 14767438399.17    | 14028805792.2114  | 14590490998.366737  | 25.5224483028409474 | 38257.810660081140 | 0.049973367736566718 0 |     385998
 N            | O            | 755019122.00 | 1132129731453.74  | 1075518177478.8293 | 1118551353535.822147 | 25.4984266349481027 | 38234.166602626373 | 0.050000183236823388523 |    29610420
 R            | F            | 377732830.00 | 566431054976.00   | 538110922664.7677 | 559634780885.086257 | 25.5083847896801383 | 38251.219273559761 | 0.049996792314087420 45 |    14808183
(4 rows)

Time: 21033.760 ms (00:21.034)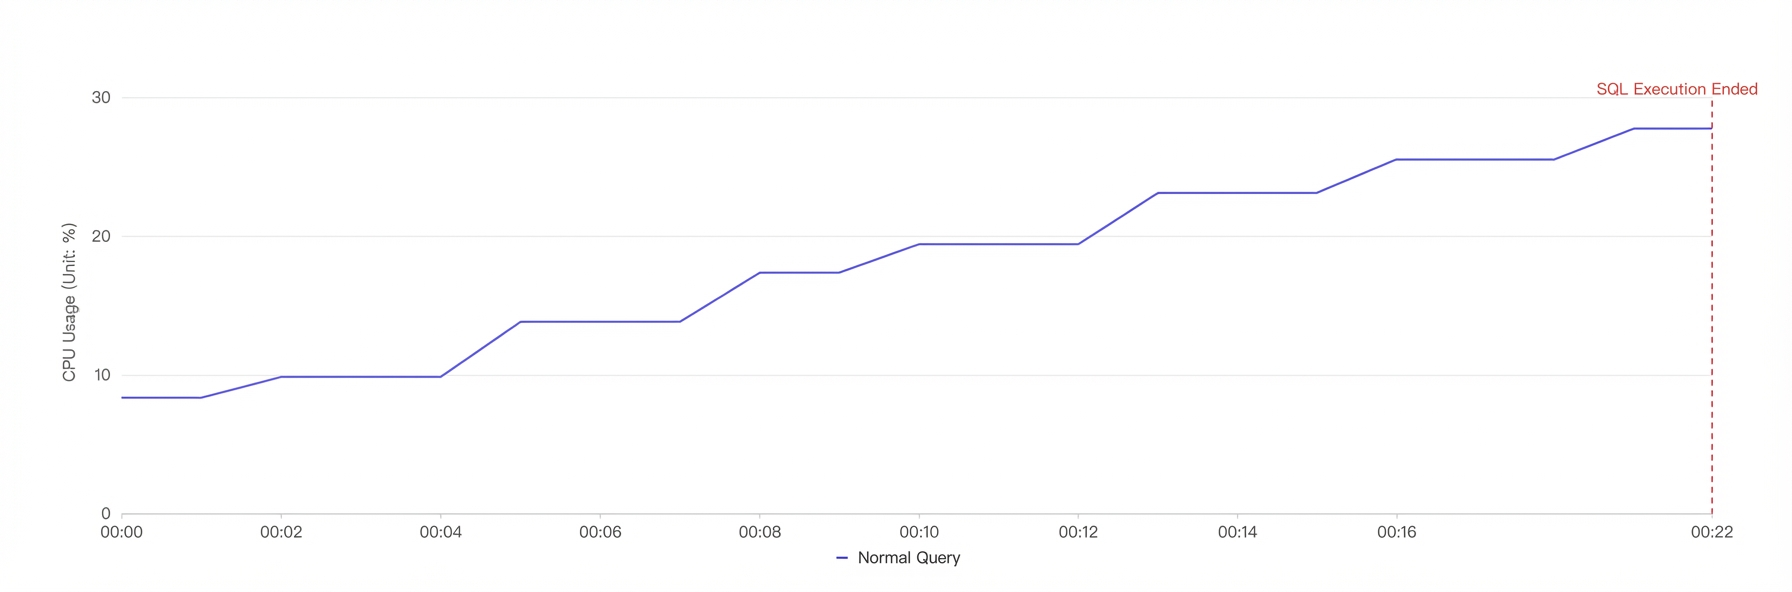
-
Next, run an accelerated query for single-table statistics. Click Enable Vectorized Engine. The system automatically runs the following command.
set polar_csi.enable_query to on; -
Click View SQL Execution Plan. The system automatically runs the following command to view the execution plan for the SQL statement.
explain select
   l_returnflag,
   l_linestatus,
   sum(l_quantity) as sum_qty,
   sum(l_extendedprice) as sum_base_price,
   sum(l_extendedprice * (1 - l_discount)) as sum_disc_price,
   sum(l_extendedprice * (1 - l_discount) * (1 + l_tax)) as sum_charge,
   avg(l_quantity) as avg_qty,
   avg(l_extendedprice) as avg_price,
   avg(l_discount) as avg_disc,
   count(*) as count_order
from
   lineitem
where l_shipdate <= date '1998-12-01' - '60 day'::interval
 group by
   l_returnflag,
   l_linestatus
order by
   l_returnflag,
   l_linestatus;
The query plan now uses the columnstore index. The following result is returned:
QUERY PLAN --------------- CSI Executor (1 row) -
Click Execute SQL. The system automatically runs the following SQL statement:
select
   l_returnflag,
   l_linestatus,
   sum(l_quantity) as sum_qty,
   sum(l_extendedprice) as sum_base_price,
   sum(l_extendedprice * (1 - l_discount)) as sum_disc_price,
   sum(l_extendedprice * (1 - l_discount) * (1 + l_tax)) as sum_charge,
   avg(l_quantity) as avg_qty,
   avg(l_extendedprice) as avg_price,
   avg(l_discount) as avg_disc,
   count(*) as count_order
from
   lineitem
where l_shipdate <= date '1998-12-01' - '60 day'::interval
 group by
   l_returnflag,
   l_linestatus
order by
   l_returnflag,
   l_linestatus;
The following result is returned. The running time is 0.444 seconds, and there is no significant change in CPU utilization.
l_returnflag | l_linestatus |   sum_qty    |  sum_base_price   |  sum_disc_price   |     sum_charge      |   avg_qty   |   avg_price    |   avg_disc   | count_order
--------------+--------------+--------------+-------------------+-------------------+---------------------+-------------+----------------+--------------+-------------
 A            | F            | 377518399.00 | 566065727797.25   | 537759104278.0656 | 559276670892.116819 | 25.5009751030071 | 38237.1510089585 | 0.0500006574540243 | 14804077
 N            | F            |   9851614.00 | 14767438399.17    | 14028805792.2114  | 14590490998.366737  | 25.5224483028409 | 38257.8106600811 | 0.0499733677376567 |   385998
 N            | O            | 755019122.00 | 1132129731453.74  | 1075518177478.8293| 1118551353535.822147| 25.4984266349481 | 38234.1666026264 | 0.0500001823682339 | 29610420
 R            | F            | 377732830.00 | 566431054976.00   | 538110922664.7677 | 559634780885.086257 | 25.5083847896801 | 38251.2192735598 | 0.0499967923140874 | 14808183
(4 rows)

Time: 444.243 ms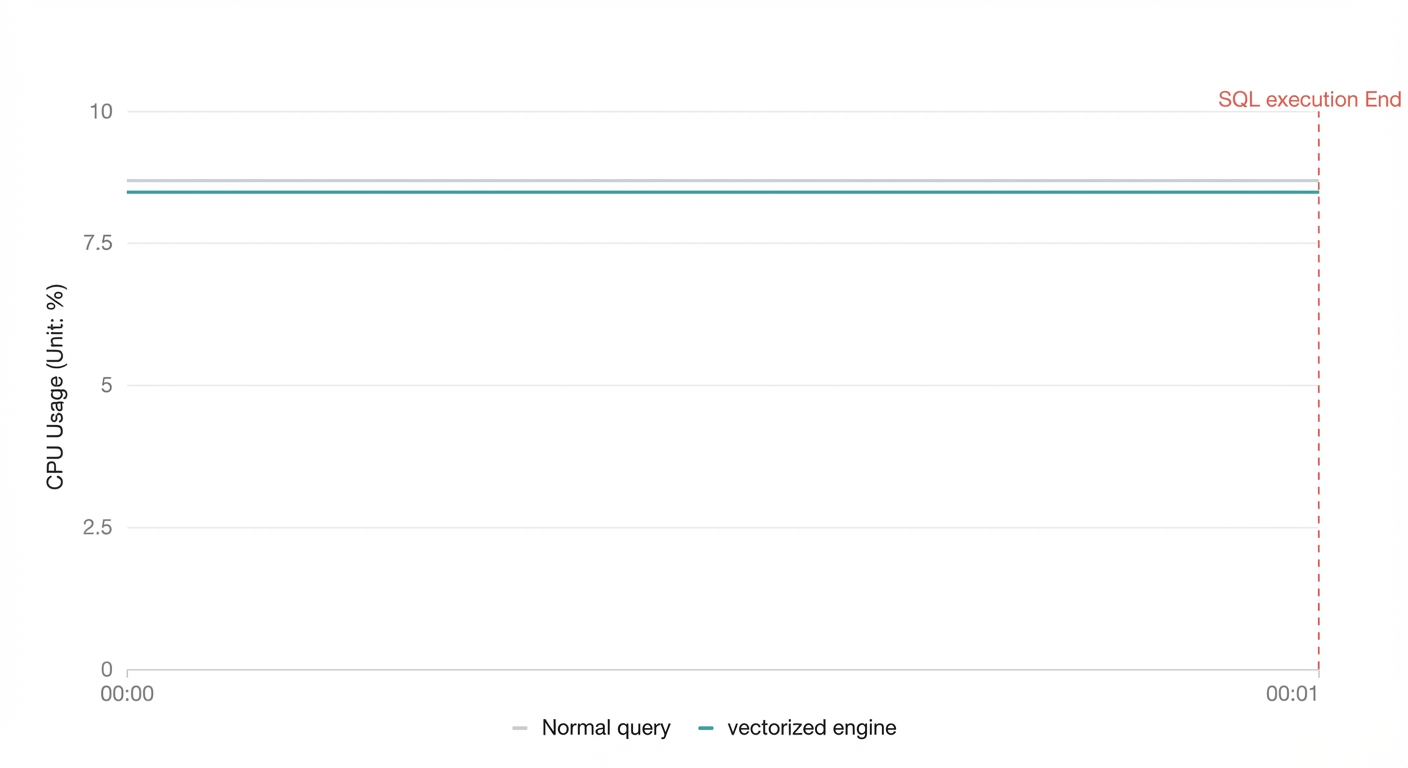
-
-
Start the query for the multi-table JOIN scenario.
-
First, run a standard query for the multi-table JOIN. Click Disable Vectorized Engine. The system automatically runs the following command.
set polar_csi.enable_query to off; -
Click View SQL Execution Plan. The system automatically runs the following command to view the execution plan for the SQL statement.
explain select
   l_orderkey,
   sum(l_extendedprice * (1 - l_discount)) as revenue,
   o_orderdate,
   o_shippriority
from
   customer,orders,
   lineitem
where
   c_mktsegment = 'FURNITURE'
   and c_custkey = o_custkey
   and l_orderkey = o_orderkey
   and o_orderdate < date '1995-03-05'
   and l_shipdate > date '1995-03-05'
group by
   l_orderkey,
   o_orderdate,
   o_shippriority
order by revenue desc, o_orderdate limit 10;
The query plan does not use the columnstore index. The following result is returned:
QUERY PLAN --------------------------------------------------------------------------------------------------------------------------------- Limit (cost=2714604.62..2714604.64 rows=10 width=44) -> Sort (cost=2714604.62..2722505.04 rows=3160168 width=44) Sort Key: (sum((lineitem.l_extendedprice * ('1'::numeric - lineitem.l_discount)))) DESC, orders.o_orderdate -> Finalize GroupAggregate (cost=2230423.64..2646314.52 rows=3160168 width=44) Group Key: lineitem.l_orderkey, orders.o_orderdate, orders.o_shippriority -> Gather Merge (cost=2230423.64..2573894.00 rows=2633474 width=44) Workers Planned: 2 -> Partial GroupAggregate (cost=2229423.62..2268925.73 rows=1316737 width=44) Group Key: lineitem.l_orderkey, orders.o_orderdate, orders.o_shippriority -> Sort (cost=2229423.62..2232715.46 rows=1316737 width=24) Sort Key: lineitem.l_orderkey, orders.o_orderdate, orders.o_shippriority -> Parallel Hash Join (cost=434379.92..2063951.34 rows=1316737 width=24) Hash Cond: (lineitem.l_orderkey = orders.o_orderkey) -> Parallel Seq Scan on lineitem (cost=0.00..1437900.14 rows=13555969 width=16) Filter: (l_shipdate > '1995-03-05'::date) -> Parallel Hash (cost=423823.16..423823.16 rows=607261 width=12) -> Parallel Hash Join (cost=46232.51..423823.16 rows=607261 width=12) Hash Cond: (orders.o_custkey = customer.c_custkey) -> Parallel Seq Scan on orders (cost=0.00..339779.89 rows=3011708 width=16) Filter: (o_orderdate < '1995-03-05'::date) -> Parallel Hash (cost=44164.29..44164.29 rows=126018 width=4) -> Parallel Seq Scan on customer (cost=0.00..44164.29 rows=126018 width=4) Filter: (c_mktsegment = 'FURNITURE'::bpchar) (23 rows) Time: 1.702 ms -
Click Execute SQL. The system automatically runs the following SQL statement:
select
   l_orderkey,
   sum(l_extendedprice * (1 - l_discount)) as revenue,
   o_orderdate,
   o_shippriority
from
   customer,orders,
   lineitem
where
   c_mktsegment = 'FURNITURE'
   and c_custkey = o_custkey
   and l_orderkey = o_orderkey
   and o_orderdate < date '1995-03-05'
   and l_shipdate > date '1995-03-05'
group by
   l_orderkey,
   o_orderdate,
   o_shippriority
order by revenue desc, o_orderdate limit 10;
The following result is returned. The running time is 6.789 seconds, and the CPU utilization increases significantly.
NoteTo observe CPU utilization, you can click Standard Query or Vectorized Engine below the chart to compare the CPU utilization between the two.
 l_orderkey |   revenue    | o_orderdate | o_shippriority
--------------+--------------+-------------+----------------
    16716836 | 457530.6898 | 1995-01-28  |              0
    49108805 | 437309.8833 | 1995-02-24  |              0
    59180740 | 424083.7684 | 1995-02-04  |              0
     3459808 | 423001.2631 | 1995-03-04  |              0
    26812736 | 422055.4106 | 1995-02-27  |              0
    19938211 | 421534.7725 | 1995-02-16  |              0
    44247173 | 421467.1845 | 1995-02-14  |              0
    10666915 | 415306.2064 | 1995-02-14  |              0
    23005989 | 413233.6425 | 1995-01-22  |              0
    35934054 | 412331.2913 | 1995-02-17  |              0
(10 rows)

Time: 6788.799 ms (00:06.789)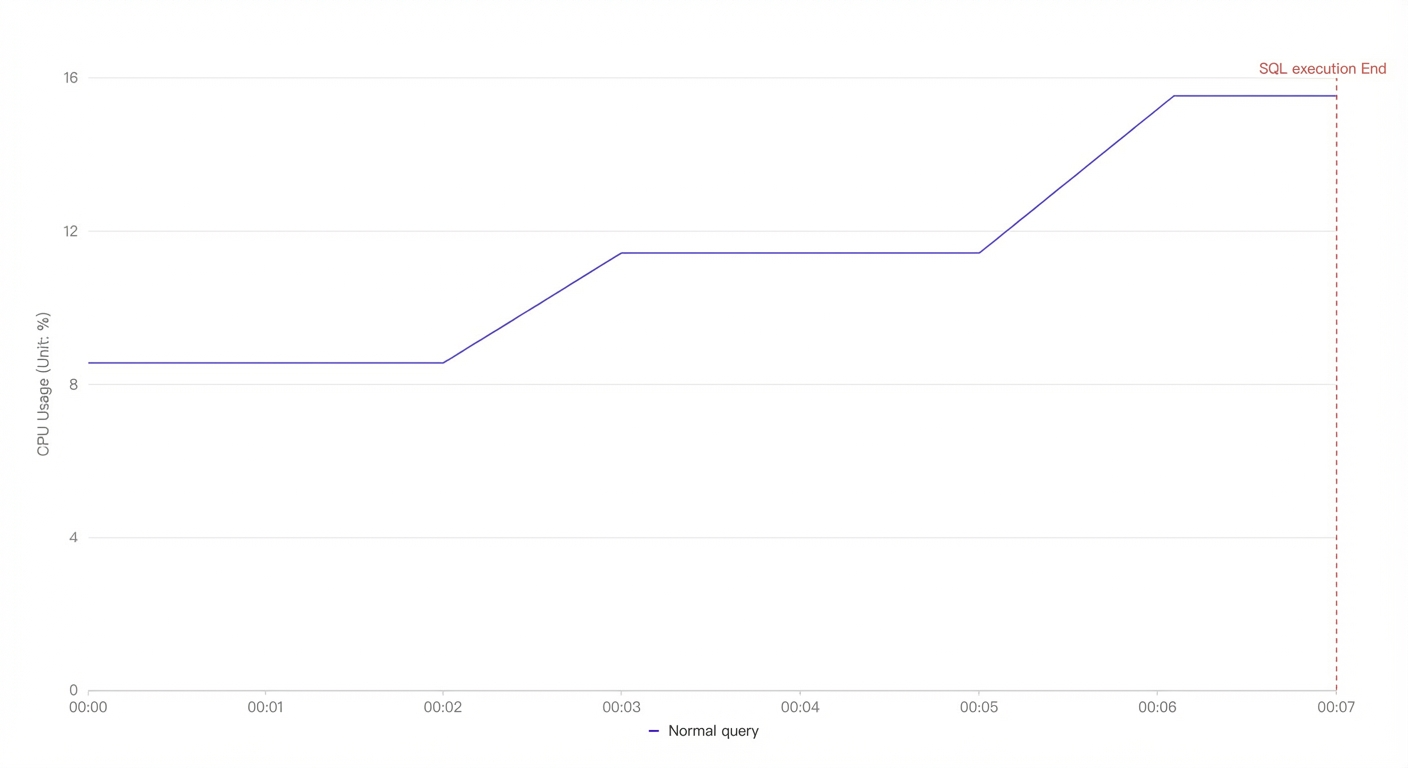
-
Then, click Enable Vectorized Engine to run an accelerated query on a single table for statistics. The system automatically executes the following command.
set polar_csi.enable_query to on; -
Click View SQL Execution Plan. The system automatically runs the following command to view the execution plan for the SQL statement.
explain select
   l_orderkey,
   sum(l_extendedprice * (1 - l_discount)) as revenue,
   o_orderdate,
   o_shippriority
from
   customer,orders,
   lineitem
where
   c_mktsegment = 'FURNITURE'
   and c_custkey = o_custkey
   and l_orderkey = o_orderkey
   and o_orderdate < date '1995-03-05'
   and l_shipdate > date '1995-03-05'
group by
   l_orderkey,
   o_orderdate,
   o_shippriority
order by revenue desc, o_orderdate limit 10;
The query plan now uses the columnstore index. The following result is returned:
QUERY PLAN --------------- CSI Executor (1 row) -
Click Execute SQL. The system automatically runs the following SQL statement:
select
   l_orderkey,
   sum(l_extendedprice * (1 - l_discount)) as revenue,
   o_orderdate,
   o_shippriority
from
   customer,orders,
   lineitem
where
   c_mktsegment = 'FURNITURE'
   and c_custkey = o_custkey
   and l_orderkey = o_orderkey
   and o_orderdate < date '1995-03-05'
   and l_shipdate > date '1995-03-05'
group by
   l_orderkey,
   o_orderdate,
   o_shippriority
order by revenue desc, o_orderdate limit 10;
The following result is returned. The running time is 0.325 seconds, and there is no significant change in CPU utilization.
NoteTo observe CPU utilization, you can click Standard Query or Vectorized Engine below the chart to compare the CPU utilization between the two.
 l_orderkey |   revenue   | o_orderdate | o_shippriority
-----------+-------------+-------------+----------------
  16716836 | 457530.6898 | 1995-01-28  |              0
  49108805 | 437309.8833 | 1995-02-24  |              0
  59180740 | 424083.7684 | 1995-02-04  |              0
   3459808 | 423001.2631 | 1995-03-04  |              0
  26812736 | 422055.4106 | 1995-02-27  |              0
  19938211 | 421534.7725 | 1995-02-16  |              0
  44247173 | 421467.1845 | 1995-02-14  |              0
  10666915 | 415306.2064 | 1995-02-14  |              0
  23005989 | 413233.6425 | 1995-01-22  |              0
  35934054 | 412331.2913 | 1995-02-17  |              0
(10 rows)

Time: 325.718 ms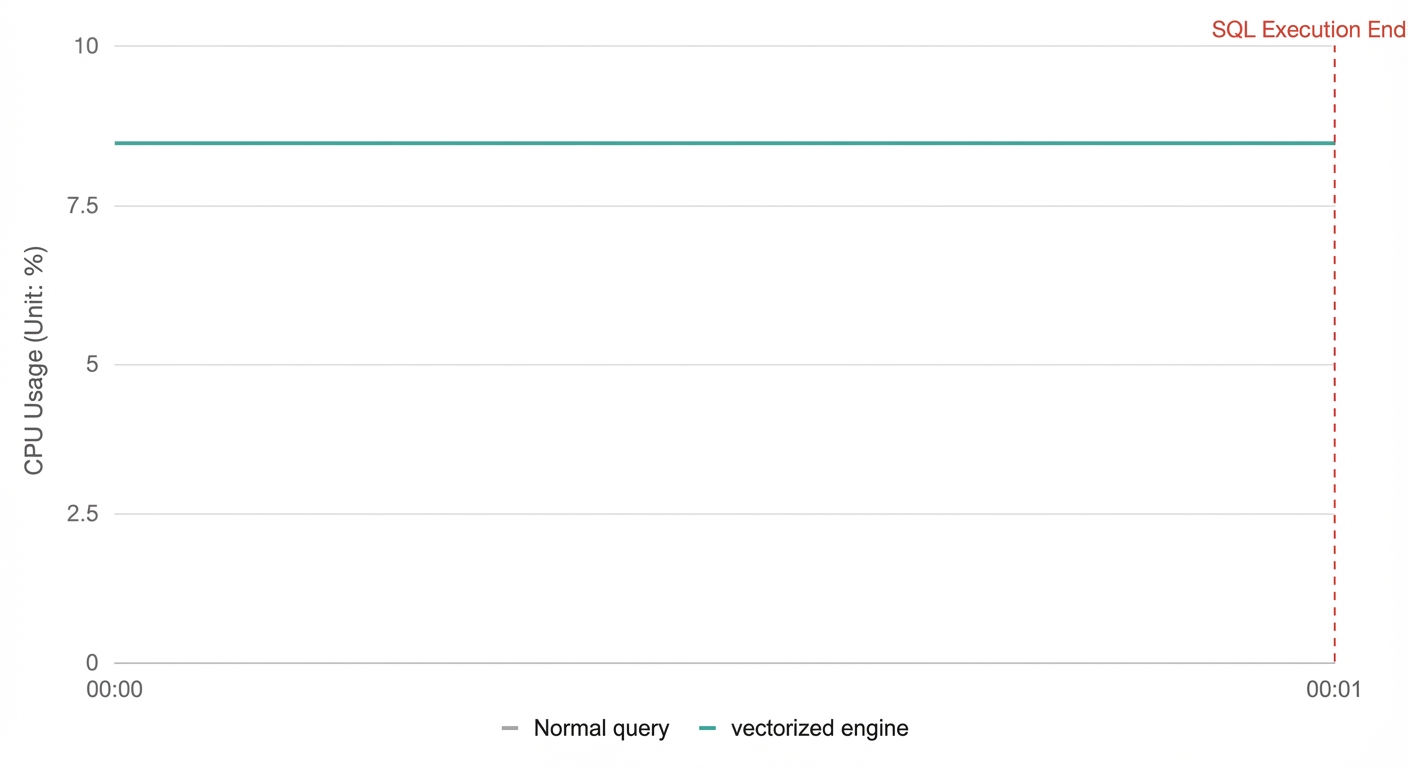
-
-
-
While the SQL statements are running, you can observe the changes in the average CPU utilization of the cluster in the trend chart on the left.
NoteReal-time monitoring data may have a delay. To ensure that the complete CPU change is displayed, the trend chart automatically extends the monitoring time by 2 to 3 seconds after the SQL statement finishes.
-
(Optional) To view the results of created tasks, go to the Columnstore Index - Accelerate Complex TP SQL Queries page and click Trial Records. In the task list, click All Tasks or My Tasks to view the trial results and their details.
Result analysis
This trial demonstrates the following advantages of the PolarDB for PostgreSQL columnstore index:
1. Simple to use. You can achieve acceleration without changing your SQL queries.
2. For single-table statistics and multi-table JOIN scenarios, the columnstore index improves performance by 30 times or more.
Columnstore index significantly accelerates queries
-
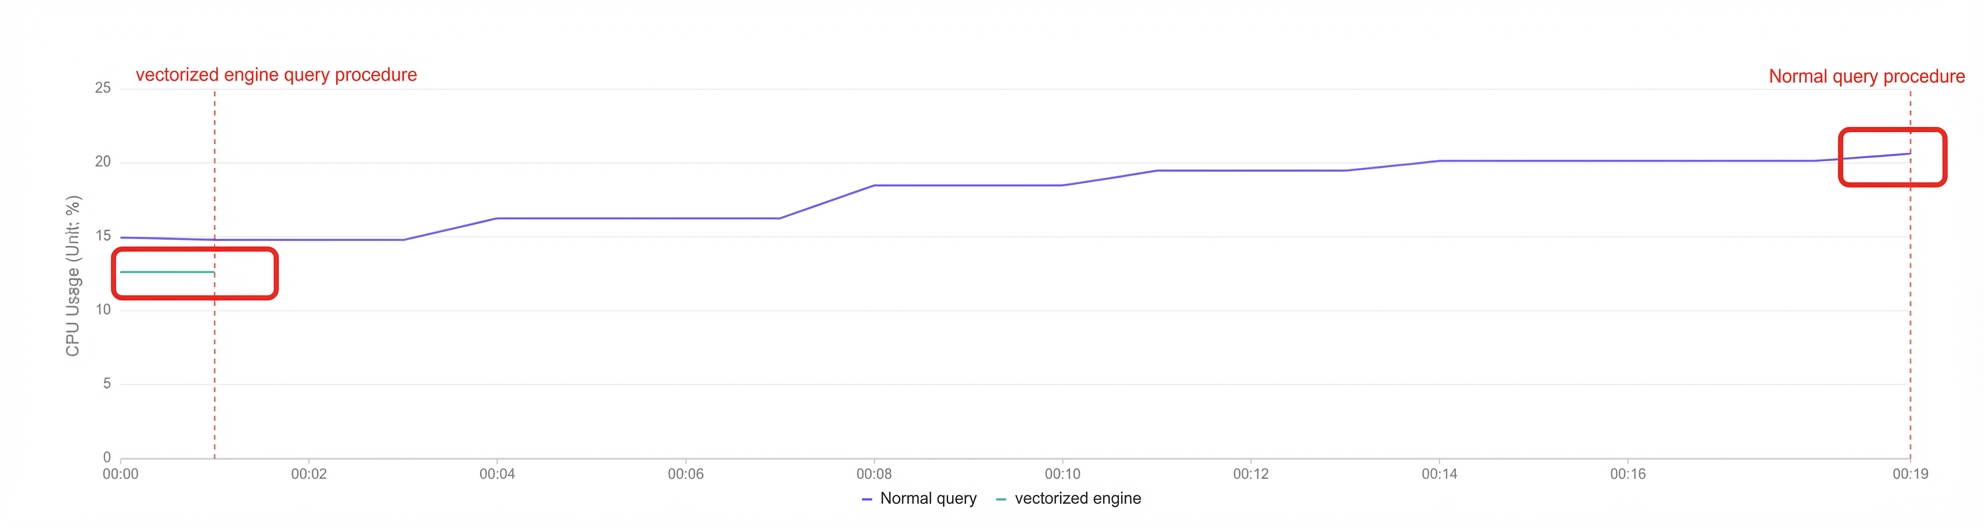
Running time: After the columnstore index is enabled, the running time for complex queries is greatly reduced. The single-table statistics query time drops from 29.998 seconds to 0.496 seconds. The multi-table JOIN query time drops from 15.105 seconds to 0.354 seconds.
-
Execution plan: After the columnstore index is enabled, the execution plan includes the CSI Executor. This indicates that the columnstore index feature is used.
Columnstore index processes queries more efficiently
Real-time monitoring data may have a delay. To ensure that the complete CPU change is displayed, the trend chart automatically extends the monitoring time by 2 to 3 seconds after the SQL statement finishes.
The running time and corresponding CPU utilization show that the columnstore index achieves faster queries with lower CPU utilization.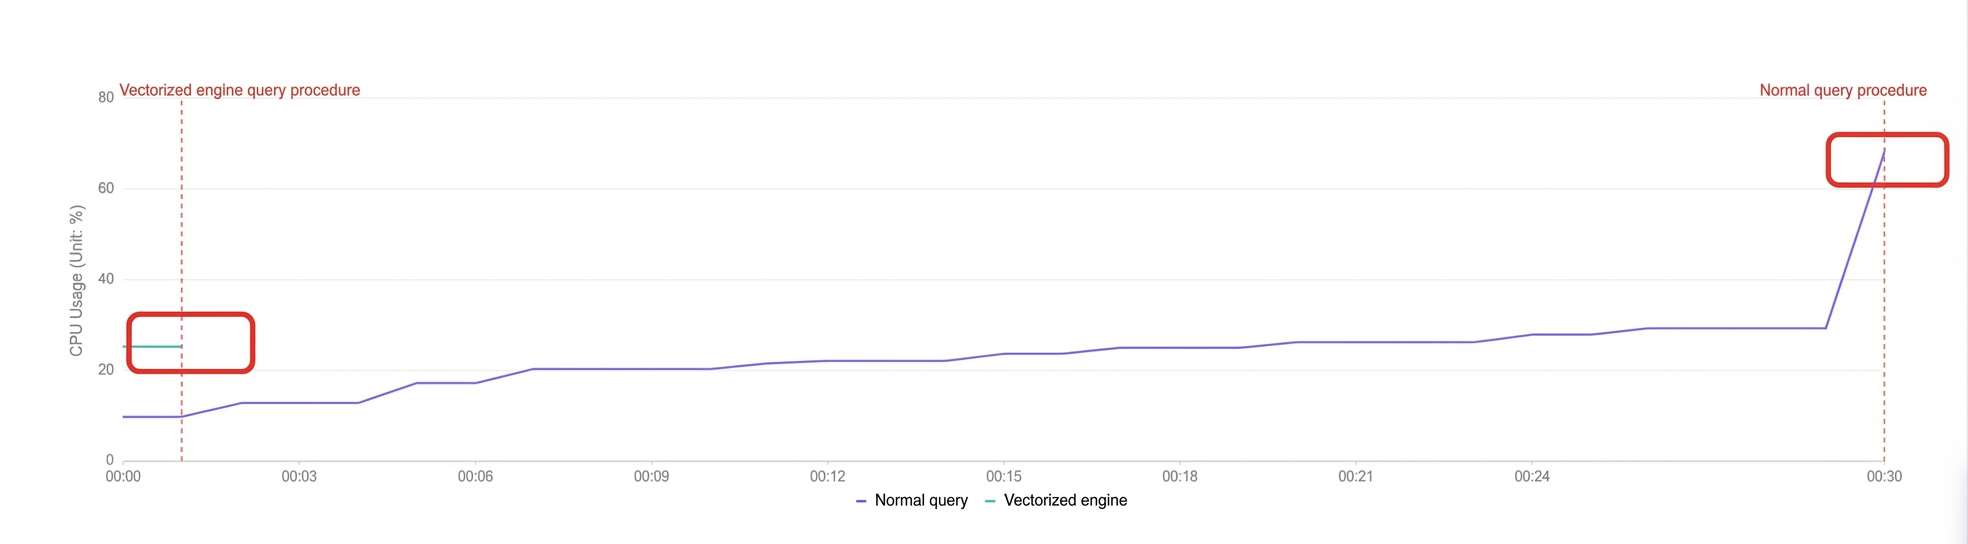
Single-table statistics query
Multi-table JOIN query
Related topics
Contact experts
You can join the official DingTalk group for technical support and consultations. The DingTalk group number is 75850003226.