Global AWR
The Automatic Workload Repository (AWR) collects, processes, and maintains performance statistics for a database. It generates performance reports for a specific period based on statistics from sources such as the database's dynamic views.
Overview
In addition to providing analysis of database resources, top SQL statements, and top tables and indexes, the Global AWR performance reporting feature for extends standard AWR reports. It offers a global perspective by covering all primary and read-only nodes within a database cluster. It also incorporates performance data and event information to help diagnose database instance exceptions. Furthermore, it collects key metrics with second-level granularity and displays trends in Grafana to pinpoint the root cause of performance jitter.
Architecture and data flow
AWR architecture
Collection layer: UE is deployed as an agent process on a physical machine to collect performance data and event information from the database cluster.
Storage layer: After data collection, UE writes the data back to the corresponding database cluster.
Presentation layer: Grafana provides the visualization. You can configure the database cluster as a data source and import the dashboard configuration file to view the data.
Dashboards
You can use Grafana to view performance trends and event information for PolarDB for PostgreSQL. The following examples show some of the available dashboards.
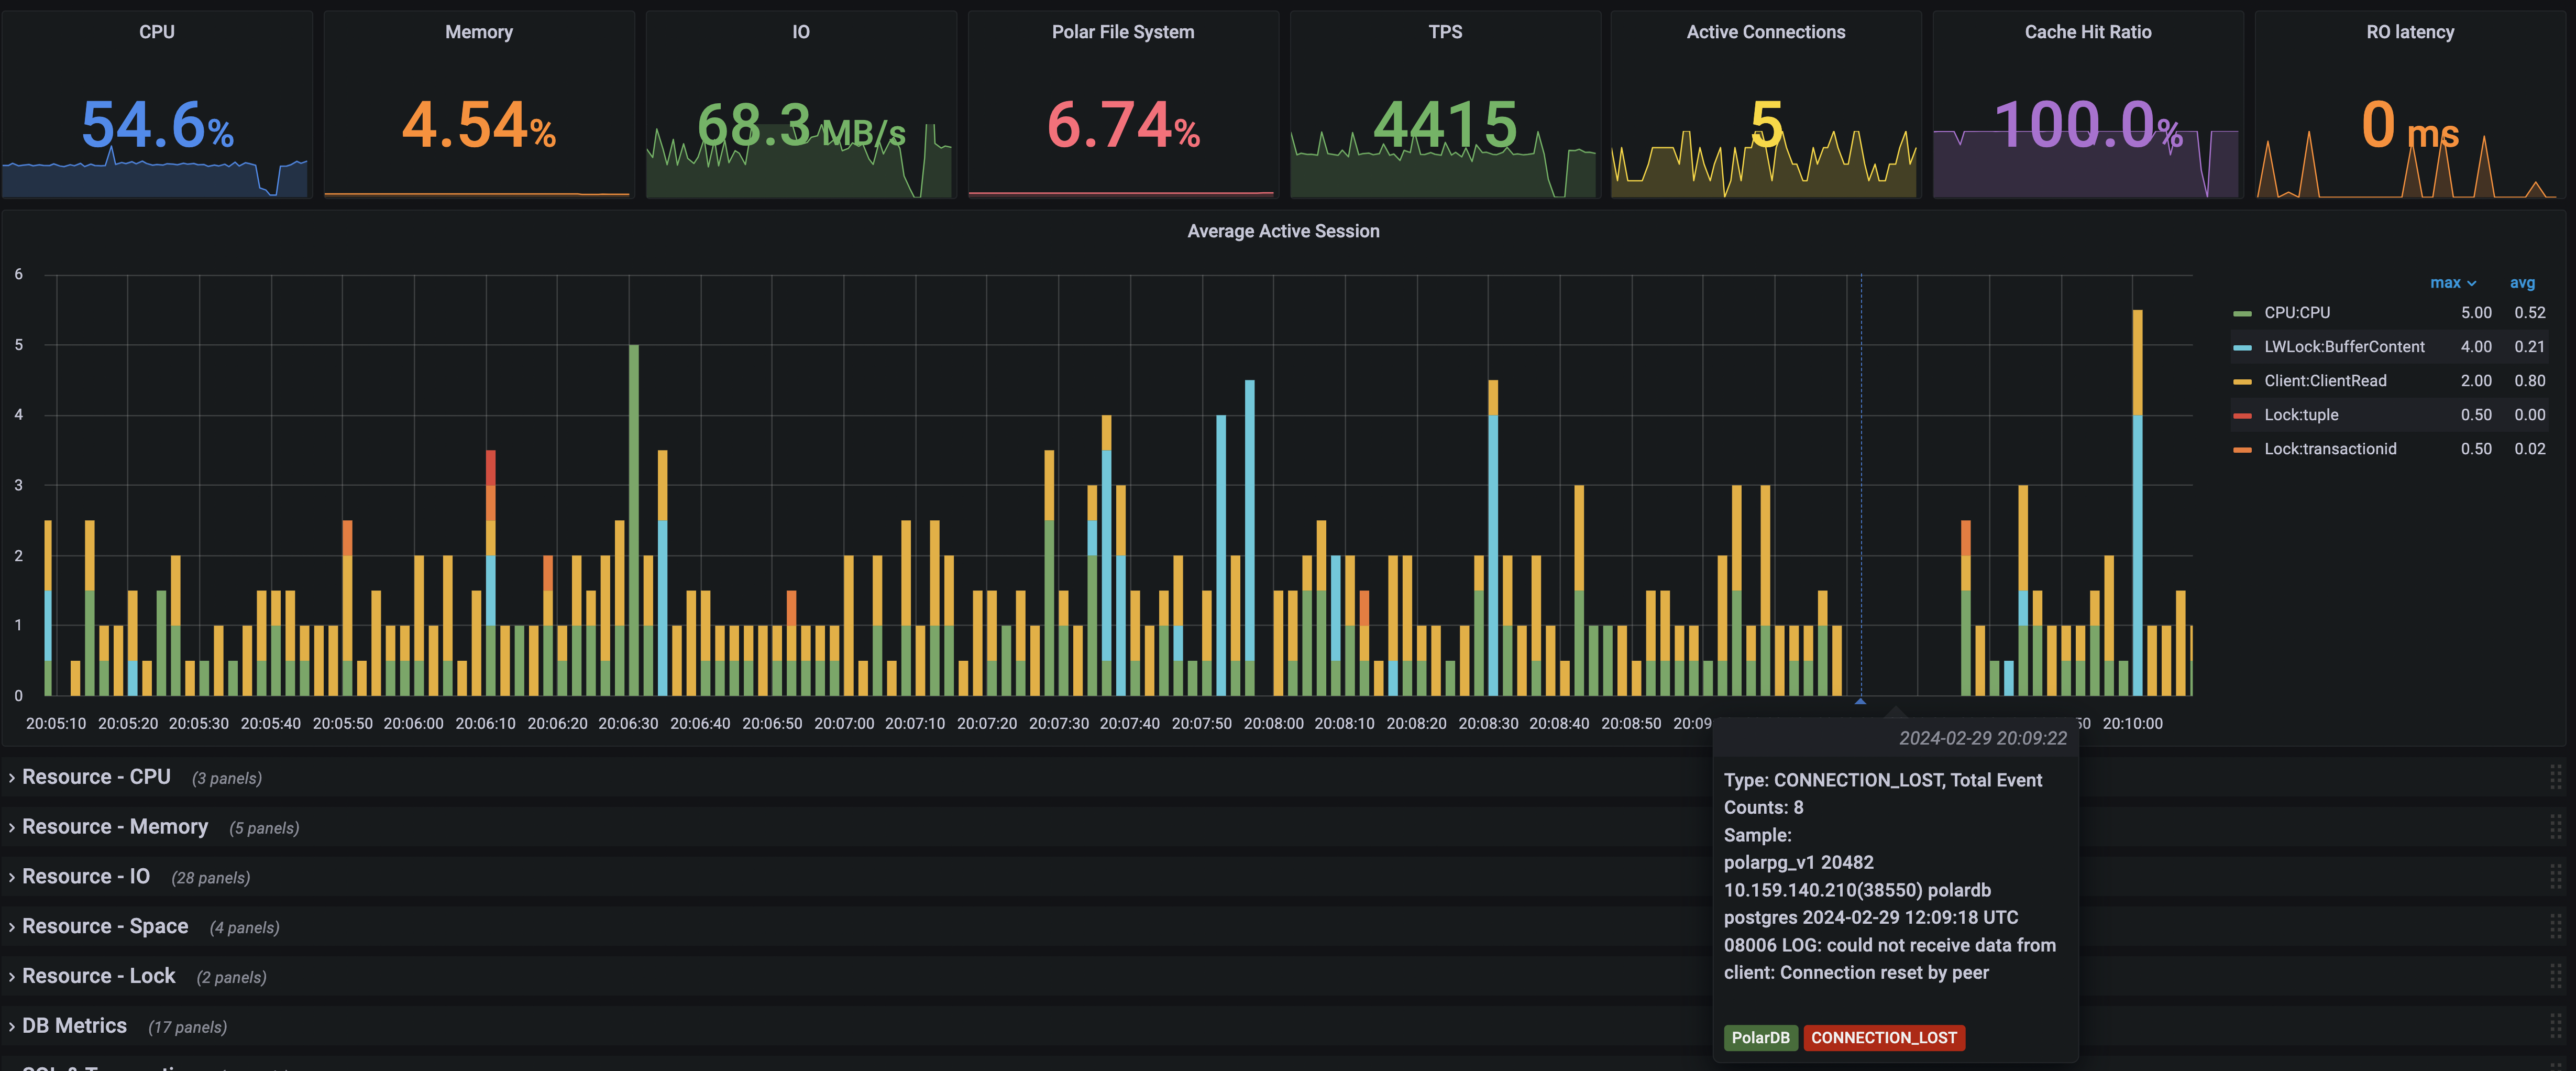
To diagnose performance issues, view the Average Active Sessions trend chart. Correlate this data with resource consumption to analyze database bottlenecks. This information, combined with event details, helps pinpoint the cause of performance jitter. For example, the following figure shows that a connection was unexpectedly disconnected at 20:09:22.
For memory usage issues, drill down to the SQL and memory context level.
In the memory usage monitoring dashboard, the Top session by memory usage(over 200MB) panel displays the process ID, RSS (MB), and corresponding SQL for each session. In this example, the SQL statements with the highest memory consumption are all
VACUUM FULL VERBOSEoperations, with RSS values ranging from approximately 16,581 MB to 18,414 MB. The Top Memory Context panel shows that the memory context for these sessions is Table rewrite, consuming about 13,752 MB to 15,904 MB.You can also analyze top SQL statements and top tables.
For example, the Top Table Bloat Ratio page displays table bloat in a tabular format. The columns include live_tuples, dead_tuples, dead_tuple_ratio(%), last_vacuum(min), and last_autovacuum(min). This helps you quickly identify tables with a high ratio of dead tuples that have not been vacuumed recently.
For instructions on how to enable and configure this feature, see Procedure.
Procedure
Prerequisites
Kernel version
Upgrade the PolarDB for PostgreSQL kernel version to 20211231 or later.
Run the following command to check the current kernel version:
show polar_release_date;The following result indicates that the current kernel version is 20211231.
polar_release_date
--------------------
20211231
(1 row)
Permissions
All Global AWR permissions are granted to the PUBLIC role.
Time zone
The default time zone for a PolarDB for PostgreSQL database cluster is Coordinated Universal Time (UTC). Account for this time difference when analyzing performance data.
Manage local storage
Enable local storage for Global AWR data before using the feature. After this feature is enabled, Global AWR can generate fine-grained performance reports without requiring you to trigger a periodic snapshot. You can view the data in the polar_gawr_collection schema of the postgres database.
For key metrics, PolarDB for PostgreSQL performs fine-grained data collection and writing. Enabling the Global AWR feature introduces additional overhead. Evaluate the following overhead before enabling this feature:
Performance overhead: The overall performance impact is under 10%.
Storage overhead: The most fine-grained data consumes less than 10 GB of storage over a three-day retention period.
Instructions
The following operations must be performed in the postgres database.
Enable local storage for Global AWR data.
SELECT polar_gawr_collection.enable_store_in_localdb();Expected output:
 enable_store_in_localdb
-------------------------
(1 row)
Disable local storage for Global AWR data.
SELECT polar_gawr_collection.disable_store_in_localdb();Expected output:
 disable_store_in_localdb
--------------------------
(1 row)
Check the status of local storage for Global AWR data.
SELECT polar_gawr_collection.show_store_in_localdb();Expected output:
 show_store_in_localdb
-----------------------
 t
(1 row)
Configure Grafana
Install Grafana
See Download Grafana. Grafana 8.1.2 or later is recommended.
Add data source
Add your database cluster as a PostgreSQL data source.
Open Grafana. In the left-side navigation pane, click Configuration > Data sources.
On the Data sources page, click Add data source in the upper-right corner.
Enter the connection information for your database cluster.
NoteFor the
Databaseparameter, you must enterpostgres.
Import dashboard
In the left-side navigation pane, click + > Import.
On the Import page, click Upload JSON file to import the configuration file.
NoteThe dashboard configuration file is a JSON file: PolarDB-Global-AWR-20260623.json. Download the file before use.