Performance test report: 100M-scale vectors (1024-D / 1-bit quantization)
PolarDB-X's intelligent search (Search engine) provides vector search capabilities based on the OpenSearch protocol. When data volumes grow too large for full-precision vectors to fit entirely in memory, 1-bit quantization (32× compression) reduces hot data that must remain memory-resident by an order of magnitude. This document tests HNSW index query throughput, latency, and recall under 1-bit quantization across Lucene and Faiss vector engines using a 100M-scale high-dimensional vector dataset, and provides comparisons with FP32 full precision along with selection guidance, offering measured data reference for technology selection, capacity planning, and parameter tuning. Tests use 128 GiB memory nodes: at this specification, full-precision vectors cannot be fully cached, allowing the compression benefits of quantization on hot data to be accurately demonstrated.
Key findings
-
1-bit quantization compresses hot data that must remain memory-resident (HNSW graph + quantized vectors) from over 100 GiB down to 13.5 GiB (Lucene) or 21.6 GiB (Faiss)—an order-of-magnitude reduction. SeeStorage and memory.
-
Faiss significantly outperforms Lucene in throughput at equal recall, with the advantage growing as recall requirements increase (38%–144%). SeeThroughput at equal recall.
-
Faiss requires tuning both
ef_searchandoversample_factorparameters to reach its ceiling; Lucene has only one effective knob (ef_search), making tuning simpler but with a lower ceiling. SeeParameter trade-offs. -
Compared with FP32 full precision, Faiss-side 1-bit outperforms in most scenarios (reaching 145% in the high-recall top-10 range), while Lucene-side generally trails by 7–25%. SeeQPS at the same recall.
-
Test matrix navigation:
Engine
Quantization
Build parameters
top-k
Search breadth control
Concurrency levels
Section
Lucene HNSW
SQ 1-bit
M=32 / ef_construction=200
10 and 100
5 tiers + 5 tiers
11 tiers
Faiss HNSW
BQ 1-bit
M=32 / ef_construction=200
10 and 100
25 tiers + 25 tiers
11 tiers
Scope of application
Cluster specifications and versions
|
Component |
Configuration |
|
Search node |
32 cores, 128 GiB × 2 |
|
JVM heap memory |
31 GiB/search node |
|
Index shards |
2 primary shards + 0 replicas |
|
Engine version |
3.6 |
|
Vector engine |
Lucene HNSW, Faiss HNSW |
|
Client |
96 cores, 371 GiB, directly connected over the internal network to search nodes |
Dataset
|
Category |
Item |
Details |
|
Dataset |
MSMARCO V2.1 ( |
1,024-D |
|
Total vectors |
113,520,750 |
100M-scale |
|
Data precision |
1-bit quantization (storage includes full-precision copy for reranking) |
32× compression |
|
Distance metric |
cosine |
— |
|
Query vectors |
1,677 |
Independent test set |
|
Ground truth set |
Included with the dataset, providing the top 10 and top 100 exact nearest neighbors for each query |
Precomputed by brute-force search |
|
top-k |
10 and 100 |
Two independent test sets |
The recall baseline comes from the ground truth set included with the dataset. The top-10 and top-100 test sets each use an independent answer set, providing the top 10 and top 100 exact nearest neighbors sorted by similarity in descending order for each query.
Index parameters
|
Parameter |
Lucene SQ 1-bit |
Faiss BQ 1-bit |
|
|
lucene |
faiss |
|
|
on_disk |
on_disk |
|
Quantization |
1-bit |
1-bit (encoder: binary, bits=1) |
|
|
32 |
32 |
|
|
200 |
200 |
|
Distance metric |
cosine |
cosine |
|
Shards / Segments |
2 primary, 0 replicas / 1 segment per shard |
2 primary, 0 replicas / 1 segment per shard |
Test methodology
Query benchmarks use community edition VectorDBBench 1.0.22. Recall is measured against the ground truth set included with the dataset; throughput and latency are from actual readings during the concurrent phase. All data in this report was collected under VectorDBBench default settings. For the impact of HTTP request body compression and other settings on data comparability, seeScope of application.
Query parameters:ef_search and oversample_factor
Queries under 1-bit quantization proceed in two stages: first, 1-bit vectors quickly screen a batch of candidates (coarse ranking); then full-precision vectors are read to precisely rerank these candidates (reranking). Two query parameters control these stages respectively:
|
Parameter |
Function |
Description |
|
|
Controls coarse-ranking search breadth |
Higher values yield candidates ofhigher qualityhigher quality |
|
|
Controls reranking candidate count (approximately |
Higher values provide more candidates for reranking in terms ofquantitymore |
The two engines respond differently to these parameters, which directly affects tuning approach and explains why the two chapters use different parameter matrices:
-
Lucene: The larger of the two parameters takes effect, simultaneously affecting both coarse ranking and reranking—effectively a single knob. Therefore, the Lucene chapter fixes
oversample_factor=1.0and relies onef_searchto step through tiers. -
Faiss: The two parameters take effect at different stages and must be tuned together for optimal results. Therefore, the Faiss chapter performs a cross-scan of both parameters (5
ef_search× 5oversample_factor).
Data preparation
This test shares the same dataset as thePerformance test report: 100M-scale vectors (1024-D / FP32). For dataset acquisition and format conversion steps, refer to that report'sData preparationsection: After obtaining the raw dataset from HuggingFace, convert it to the three Parquet files required by VectorDBBench (train.parquet / test.parquet / neighbors.parquet) and place them in the same data directory, linked at benchmark time via --custom-dataset-dir .
Execution flow
Each benchmark command corresponds to a fixed engine × top-k × query parameter configuration, running through 11 concurrency levels sequentially. After command submission, the tool automatically completes all of the following steps without manual intervention:
|
Stage |
Tool behavior |
|
Build index |
Based on |
|
Import |
Write all vectors |
|
Segment merging |
Trigger force merge to merge each shard into a single segment ( |
|
Recall measurement |
Issue queries serially and compare top-k results against the ground truth set |
|
Throughput and latency measurement |
Runs benchmarks across 11 concurrency levels sequentially, 60 seconds per level |
Once built, the same index can be reused for measurements with different query parameters. Each engine's index is built independently on the same cluster; during testing, only the index under test is opened while others are closed to prevent mutual page cache eviction.
Benchmark command
Both engines and all parameter combinations share the following command skeleton (parameters held constant).
-
In the command,
awsopensearchis the VectorDBBench subcommand for OpenSearch-compatible endpoints (PolarSearch is compatible with the OpenSearch protocol). -
In the command,
<endpoint>,<username>,<password>are placeholders that must be replaced with the cluster access endpoint and account credentials.
vectordbbench awsopensearch \
  --case-type PerformanceCustomDataset \
  --custom-dataset-name msmarco100m --custom-dataset-dir /data/msmarco_100m \
  --custom-dataset-size 113520750 --custom-dataset-dim 1024 --custom-dataset-file-count 1 \
  --custom-dataset-metric-type cosine --custom-dataset-with-gt \
  --host <endpoint> --port 9200 \
  --user <username> --password <password> \
  --metric-type cosine \
  --m 32 --ef-construction 200 \
  --number-of-shards 2 --number-of-replicas 0 \
  --num-concurrency 16,32,48,64,96,144,192,256,320,384,450 \
  --concurrency-duration 60 \
  --search-serial --search-concurrent
The following parameters are appended to enumerate all 660 data points (Lucene 10 configurations × 11 concurrency levels + Faiss 50 configurations × 11 concurrency levels):
|
Parameter |
Lucene section |
Faiss section |
|
|
|
|
|
|
Required; enables two-stage retrieval and 1-bit quantization |
Same as above |
|
|
Not applicable (1-bit is implicitly determined by |
|
|
|
10 or 100 |
10 or 100 |
|
|
100/200/300/400/500 |
100/200/300/400/500 |
|
|
Not set (default 1.0) |
|
|
|
Omit on first index build; add on subsequent runs reusing the same index to skip index build and import |
Same as above |
Faiss BQ uses 1-bit quantized vectors for coarse ranking, then reads full-precision vectors to correct the order during reranking.
Impact of HTTP compression on the measured data
When connecting to a standard OpenSearch endpoint, VectorDBBench enables request body gzip compression by default (client configuration option http_compress), All data in this report was measured under this default configuration. Disabling compression yields higher throughput, with diminishing gains as concurrency increases. Therefore, data obtained with different benchmark tools or compression settings cannot be directly compared. Before comparison, ensure both sides are aligned on compression configuration, concurrency model, top-k, and timing methodology.
Lucene SQ 1-bit test data
Storage and memory
Primary shards measured at 460.3 GiB (shard0 230.1 GiB + shard1 230.2 GiB, each merged to a single segment). Memory breakdown:
|
Data type |
Size per node |
Hot path |
Description |
|
HNSW graph + 1-bit quantized vectors |
13.5 GiB |
Yes |
|
|
Full-precision vectors (for reranking) |
216.3 GiB |
On demand |
Read during reranking, not permanently resident |
Query performance summary table
Notes on table data:
-
QPS stands for queries per second.
-
AVG, P95, and P99 represent the average, 95th percentile, and 99th percentile of query latency, respectively, all in milliseconds.
-
Column header cN indicates a concurrency level of N. For example, c16 means concurrency level 16, and c32 means concurrency level 32.
top-k = 10
Highest measured throughput 13,150 QPS(recall 0.9283), highest recall 0.9729(throughput 3,974 QPS).
|
ef_search |
Recall |
Metric |
c16 |
c32 |
c48 |
c64 |
c96 |
c144 |
c192 |
c256 |
c320 |
c384 |
c450 |
|
100 |
0.9283 |
QPS |
4,551 |
8,221 |
10,444 |
11,443 |
12,608 |
13,023 |
13,091 |
13,150 |
13,038 |
12,936 |
12,925 |
|
AVG |
3.5 |
3.9 |
4.6 |
5.6 |
7.6 |
11.0 |
14.6 |
19.3 |
24.2 |
29.1 |
34.0 |
||
|
P95 |
4.0 |
4.6 |
5.8 |
7.4 |
10.7 |
17.5 |
25.9 |
36.9 |
42.4 |
48.0 |
53.8 |
||
|
P99 |
4.4 |
5.3 |
6.9 |
9.2 |
13.7 |
27.2 |
47.9 |
66.7 |
76.3 |
81.8 |
86.3 |
||
|
200 |
0.9530 |
QPS |
3,968 |
6,737 |
7,670 |
8,058 |
8,154 |
8,141 |
8,140 |
8,139 |
8,132 |
8,135 |
8,055 |
|
AVG |
4.0 |
4.7 |
6.2 |
7.9 |
11.7 |
17.6 |
23.4 |
31.2 |
38.9 |
46.6 |
54.9 |
||
|
P95 |
4.7 |
5.8 |
8.5 |
11.7 |
22.2 |
34.1 |
41.4 |
50.5 |
59.7 |
67.8 |
77.0 |
||
|
P99 |
5.3 |
6.9 |
10.6 |
14.6 |
34.8 |
56.0 |
66.5 |
74.8 |
84.6 |
90.5 |
99.9 |
||
|
300 |
0.9637 |
QPS |
3,465 |
5,705 |
5,897 |
6,003 |
5,961 |
5,952 |
5,915 |
5,912 |
5,922 |
5,886 |
5,870 |
|
AVG |
4.6 |
5.6 |
8.1 |
10.6 |
16.1 |
24.1 |
32.3 |
42.9 |
53.6 |
64.8 |
75.9 |
||
|
P95 |
5.5 |
7.3 |
12.0 |
17.8 |
32.2 |
43.6 |
52.6 |
65.7 |
81.5 |
92.9 |
107.7 |
||
|
P99 |
6.3 |
8.6 |
14.9 |
24.0 |
49.0 |
64.5 |
73.0 |
82.3 |
97.7 |
111.7 |
129.9 |
||
|
400 |
0.9695 |
QPS |
3,052 |
4,697 |
4,705 |
4,675 |
4,696 |
4,684 |
4,688 |
4,682 |
4,717 |
4,696 |
4,560 |
|
AVG |
5.2 |
6.8 |
10.2 |
13.7 |
20.4 |
30.7 |
40.8 |
54.3 |
67.5 |
81.2 |
97.9 |
||
|
P95 |
6.4 |
9.0 |
16.2 |
25.9 |
39.3 |
51.5 |
63.6 |
84.1 |
103.2 |
123.9 |
144.8 |
||
|
P99 |
7.2 |
10.7 |
20.6 |
36.0 |
55.9 |
69.0 |
79.3 |
96.9 |
118.1 |
144.0 |
174.3 |
||
|
500 |
0.9729 |
QPS |
2,746 |
3,972 |
3,974 |
3,942 |
3,937 |
3,942 |
3,931 |
3,873 |
3,867 |
3,874 |
3,871 |
|
AVG |
5.8 |
8.0 |
12.1 |
16.2 |
24.3 |
36.5 |
48.7 |
65.8 |
82.3 |
98.5 |
115.2 |
||
|
P95 |
7.2 |
11.0 |
19.2 |
31.2 |
46.1 |
58.9 |
76.0 |
105.2 |
133.4 |
157.6 |
170.7 |
||
|
P99 |
8.2 |
13.3 |
24.1 |
43.5 |
63.6 |
77.2 |
89.3 |
113.9 |
145.7 |
176.7 |
206.0 |
top-k = 100
The only variable compared to the top-k=10 group is k changed from 10 to 100; all other parameters, index, dataset, tool, concurrency levels, and timing methodology remain identical. Recall is measured as Rec
Highest measured throughput for top-100 12,233 QPS(recall 0.8246), highest recall 0.9598(throughput 4,101 QPS).
|
ef_search |
Recall |
Metric |
c16 |
c32 |
c48 |
c64 |
c96 |
c144 |
c192 |
c256 |
c320 |
c384 |
c450 |
|
100 |
0.8246 |
QPS |
4,270 |
7,715 |
10,198 |
11,363 |
12,233 |
9,846 |
9,173 |
8,670 |
8,546 |
9,028 |
10,011 |
|
AVG |
3.7 |
4.1 |
4.7 |
5.6 |
7.8 |
14.6 |
20.8 |
29.2 |
36.9 |
41.9 |
44.3 |
||
|
P95 |
4.2 |
4.8 |
5.7 |
7.1 |
11.7 |
42.2 |
51.2 |
61.0 |
66.9 |
68.9 |
65.2 |
||
|
P99 |
4.6 |
5.5 |
6.8 |
8.7 |
17.1 |
49.8 |
58.1 |
67.1 |
73.6 |
77.6 |
79.4 |
||
|
200 |
0.9109 |
QPS |
3,703 |
6,621 |
8,069 |
7,522 |
6,106 |
6,733 |
6,683 |
6,845 |
5,867 |
5,960 |
7,767 |
|
AVG |
4.3 |
4.8 |
5.9 |
8.5 |
15.7 |
21.3 |
28.6 |
37.1 |
54.1 |
63.9 |
57.2 |
||
|
P95 |
5.0 |
5.8 |
7.5 |
17.0 |
41.2 |
40.2 |
47.2 |
55.0 |
76.3 |
84.4 |
75.2 |
||
|
P99 |
5.6 |
6.8 |
8.9 |
27.6 |
46.9 |
48.8 |
59.4 |
70.1 |
86.1 |
97.4 |
99.0 |
||
|
300 |
0.9389 |
QPS |
3,294 |
5,638 |
6,089 |
5,558 |
5,758 |
5,764 |
5,183 |
5,151 |
5,602 |
5,618 |
4,693 |
|
AVG |
4.9 |
5.7 |
7.9 |
11.5 |
16.6 |
24.9 |
36.8 |
49.5 |
56.5 |
67.6 |
95.1 |
||
|
P95 |
5.7 |
7.0 |
11.2 |
16.7 |
22.3 |
32.1 |
55.1 |
72.1 |
84.4 |
99.1 |
127.8 |
||
|
P99 |
6.4 |
8.1 |
15.0 |
28.8 |
24.9 |
39.5 |
67.8 |
86.8 |
96.4 |
114.6 |
158.8 |
||
|
400 |
0.9517 |
QPS |
2,925 |
4,831 |
4,474 |
4,594 |
4,590 |
4,590 |
4,609 |
4,506 |
4,581 |
4,578 |
4,428 |
|
AVG |
5.5 |
6.6 |
10.7 |
13.9 |
20.9 |
31.3 |
41.4 |
56.6 |
69.4 |
83.3 |
100.8 |
||
|
P95 |
6.6 |
8.5 |
20.5 |
18.3 |
27.3 |
47.2 |
64.9 |
92.2 |
112.7 |
136.3 |
154.8 |
||
|
P99 |
7.4 |
9.8 |
26.8 |
21.7 |
31.3 |
51.8 |
70.4 |
98.2 |
121.8 |
148.0 |
178.4 |
||
|
500 |
0.9598 |
QPS |
2,647 |
4,101 |
3,855 |
3,780 |
3,790 |
3,782 |
3,700 |
3,708 |
3,709 |
3,643 |
3,644 |
|
AVG |
6.0 |
7.8 |
12.4 |
16.9 |
25.3 |
38.0 |
51.6 |
68.8 |
85.9 |
104.7 |
122.5 |
||
|
P95 |
7.5 |
10.3 |
17.7 |
22.1 |
33.0 |
58.0 |
83.2 |
114.2 |
144.5 |
177.3 |
208.5 |
||
|
P99 |
8.4 |
12.1 |
23.3 |
26.1 |
37.7 |
60.5 |
86.0 |
118.3 |
150.8 |
186.2 |
219.7 |
Data analysis
-
Recall increases monotonically with
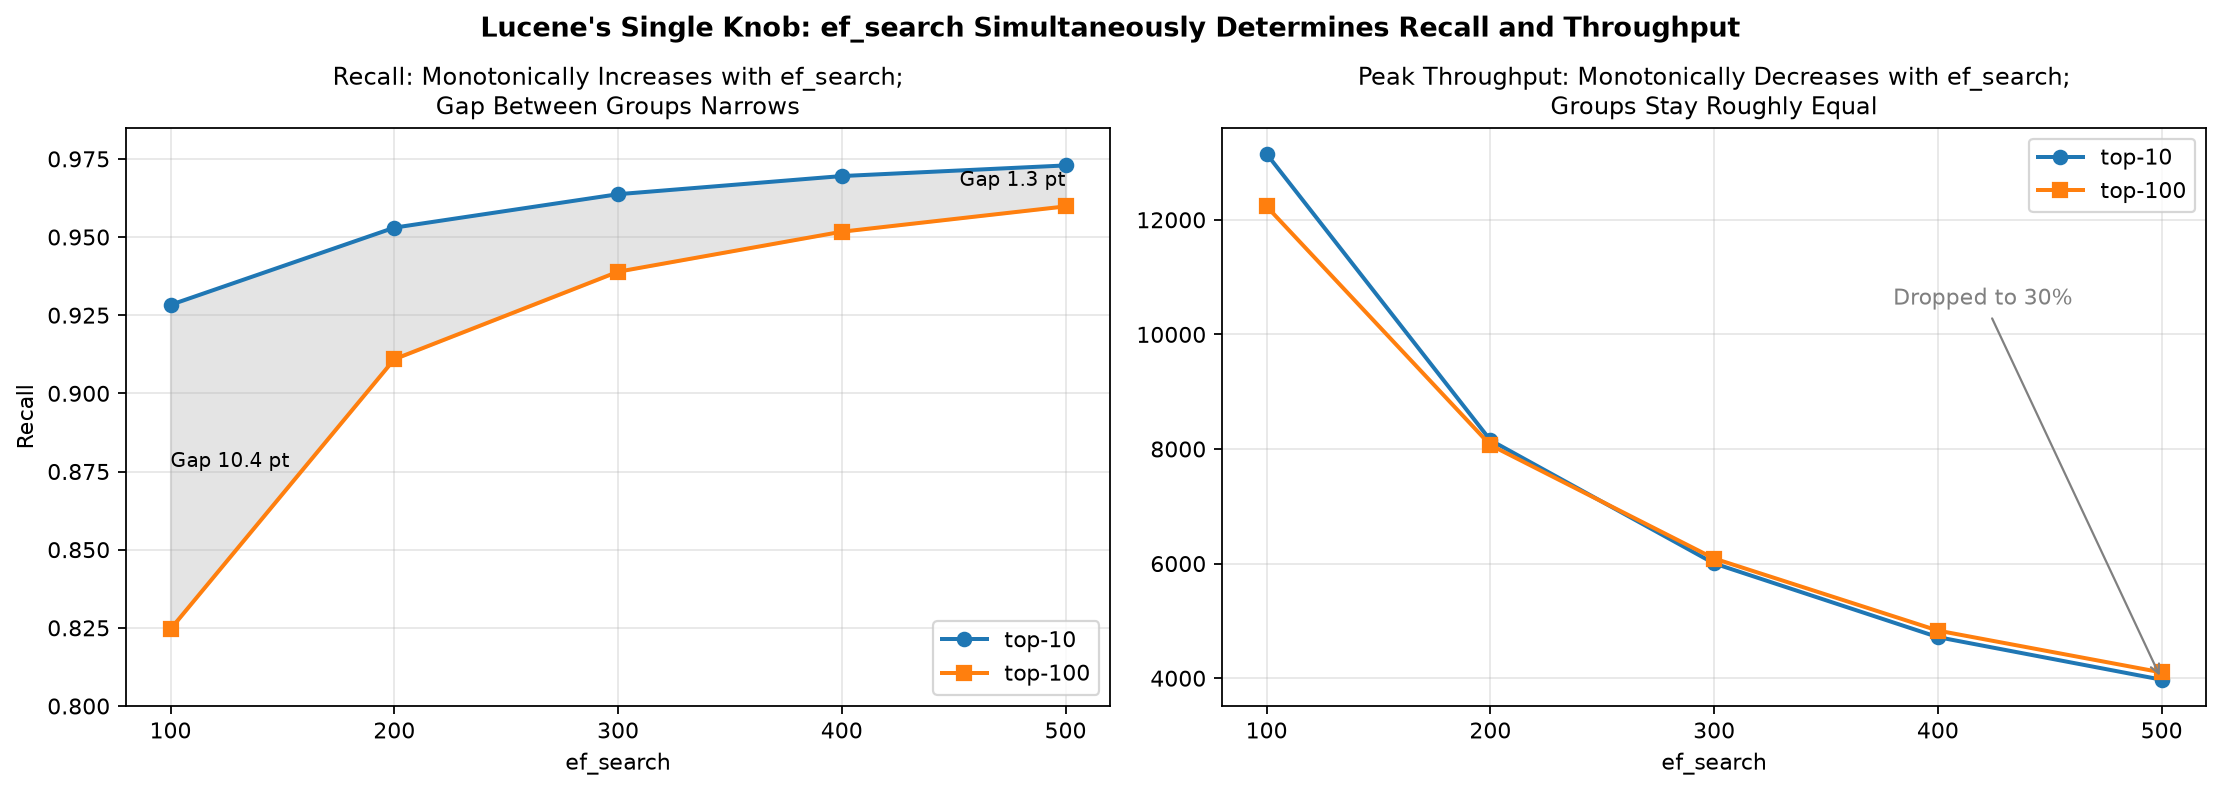
ef_searchmonotonically, and the improvement grows larger as top-k increases. As ef increases from 100 to 500, top-10 recall rises from 0.9283 to 0.9729 (+4.5 percentage points), and top-100 rises from 0.8246 to 0.9598 (+13.5 percentage points). Full-precision reranking effectively compensates for ordering errors introduced by quantization, and both groups reach usable recall levels at the 100M scale. -
top-100 recall is lower than top-10, and the gap narrows rapidly as
ef_searchincreases. The gap between the two groups drops from 10.4 percentage points at ef=100 to 1.3 percentage points at ef=500. The root cause is that both groups share the same reranking candidate count of 100 (the floor value): top-10 can select the best 10 from 100 candidates, while top-100 must return all 100, leaving no filtering margin during reranking. At ef=100, the search breadth exactly equals the candidate count, maximizing the gap; at ef=500, the breadth reaches 5x the candidate count, and the candidates themselves already approximate the true nearest neighbors. -
Throughput decreases monotonically as
ef_searchmonotonically decreases and is largely unaffected by top-k.ef_searchAs ef_search increases from 100 to 500, peak throughput drops to roughly one-third (top-10: 13,150 → 3,974; top-100: 12,233 → 4,101). The difference in peak throughput between the two groups at the same tier is only −7.0% to +3.2%, because server-side search and reranking overhead is determined by search breadth and candidate count,kaffecting only the response body size. -
top-100 reaches peak throughput at significantly lower concurrency than top-10. top-10 peaks are spread across c48–c320 (ef=100 peaks at c256, ef=400 at c320, others fall in c48–c96), while top-100 all peak between c32 and c96.
ef_searchThe higher the value, the heavier each individual query; top-100 returns 100 results per query (10x that of top-10), resulting in greater serialization and network transfer overhead, both of which saturate the link at lower concurrency levels. The peak throughput tier for top-10 does not strictly shift forward with increasingef_search—for example, in the ef=400 group, throughput differences across tiers from c48 onward are under 1%, indicating a saturation plateau where the peak tier position is mainly determined by measurement noise. -
P99 rises in a step-like manner after c96–c144. P99 shows significant jumps in the medium-to-high concurrency range across all tiers: for top-10 with ef=100, P99 jumps from 13.7 ms at c96 to 47.9 ms at c192; for top-100 with ef=100, it jumps from 17.1 ms at c96 to 49.8 ms at c144. If the workload has P99 constraints, keep concurrency at or below c96.
Recall is measured during the serial phase and depends only on index parameters and ef_search , independent of concurrency, so each group reports a single value. For top-100, the low-ef tiers (ef=100–300) after peak throughput show 20%–30% throughput fluctuations, caused by the increased proportion of client-side parsing and network transfer overhead when the response body is large; analysis should focus on peak values per tier and overall trends.
Resource saturation
Measured readings during the formal test phase are as follows. "Single node" takes the maximum value across the two search nodes.
|
Metric |
Measured value |
|
Single-node CPU |
Peak 91% |
|
Search thread pool rejections |
0 throughout |
|
Search thread pool queue |
No overflow |
|
k-NN circuit breaker |
Not triggered throughout (Lucene does not use off-heap memory) |
|
Graph memory (off-heap) |
0 (Lucene uses memory mapping and does not load into off-heap memory) |
|
Client CPU |
Not a constraint |
Faiss BQ 1-bit test data
Storage and memory
Primary shards measured at 478.7 GiB (shard0 239.3 GiB + shard1 239.4 GiB, each merged into a single segment). Memory breakdown:
|
Data type |
Size per node |
Hot path |
Description |
|
HNSW graph + 1-bit quantized vectors |
21.6 GiB |
Yes |
Required for coarse ranking, resident in off-heap memory, accounting for 29.7% of the k-NN circuit breaker limit (stored as a single file, not breakable by component) |
|
Full-precision vectors (for reranking) |
216.3 GiB |
On demand |
Read during reranking, not permanently resident |
Query performance summary table
Notes on table data:
-
QPS stands for queries per second.
-
AVG, P95, and P99 represent the average, 95th percentile, and 99th percentile of query latency, respectively, all in milliseconds.
-
Column header cN indicates a concurrency level of N. For example, c16 means concurrency level 16, and c32 means concurrency level 32.
top-k = 10
Highest measured throughput 18,251 QPS(recall 0.9258), highest recall 0.9786 (ef_search=500 / oversample_factor=70, throughput 7,520 QPS).
|
ef_search |
oversample_factor |
Recall |
Metric |
c16 |
c32 |
c48 |
c64 |
c96 |
c144 |
c192 |
c256 |
c320 |
c384 |
c450 |
|
100 |
10 |
0.9258 |
QPS |
4,998 |
8,805 |
11,874 |
13,841 |
15,989 |
17,228 |
17,885 |
17,827 |
18,170 |
18,251 |
18,153 |
|
AVG |
3.2 |
3.6 |
4.0 |
4.6 |
6.0 |
8.3 |
10.6 |
14.2 |
17.4 |
20.7 |
24.3 |
|||
|
P95 |
3.6 |
4.3 |
4.9 |
6.0 |
8.4 |
12.3 |
17.2 |
32.5 |
38.1 |
49.1 |
62.7 |
|||
|
P99 |
6.9 |
7.3 |
7.9 |
8.6 |
11.0 |
15.8 |
23.7 |
53.4 |
70.8 |
96.3 |
117.0 |
|||
|
30 |
0.9364 |
QPS |
2,901 |
8,034 |
10,754 |
12,085 |
13,831 |
14,732 |
14,999 |
15,257 |
15,156 |
15,099 |
14,353 |
|
|
AVG |
5.5 |
4.0 |
4.4 |
5.3 |
6.9 |
9.7 |
12.7 |
16.6 |
20.8 |
25.0 |
30.8 |
|||
|
P95 |
4.5 |
4.7 |
5.6 |
7.3 |
9.8 |
14.4 |
19.3 |
26.5 |
34.1 |
42.2 |
53.4 |
|||
|
P99 |
79.6 |
7.7 |
8.3 |
9.7 |
12.5 |
18.3 |
25.5 |
37.2 |
53.4 |
89.2 |
118.3 |
|||
|
50 |
0.9367 |
QPS |
2,681 |
7,369 |
9,895 |
11,078 |
12,096 |
12,704 |
13,029 |
12,976 |
12,940 |
12,816 |
12,735 |
|
|
AVG |
6.0 |
4.3 |
4.8 |
5.8 |
7.9 |
11.3 |
14.6 |
19.5 |
24.4 |
29.5 |
34.5 |
|||
|
P95 |
6.9 |
5.2 |
6.4 |
8.1 |
11.5 |
17.2 |
23.2 |
32.7 |
41.5 |
50.9 |
59.5 |
|||
|
P99 |
80.7 |
8.2 |
8.9 |
10.5 |
14.7 |
22.6 |
31.2 |
49.0 |
72.5 |
89.1 |
96.9 |
|||
|
70 |
0.9357 |
QPS |
2,251 |
7,080 |
8,946 |
10,050 |
10,715 |
11,381 |
11,536 |
11,606 |
11,418 |
11,318 |
11,215 |
|
|
AVG |
7.1 |
4.5 |
5.4 |
6.3 |
8.9 |
12.6 |
16.5 |
21.9 |
27.8 |
33.4 |
39.4 |
|||
|
P95 |
7.7 |
5.4 |
7.4 |
9.1 |
13.3 |
19.8 |
27.9 |
37.6 |
48.1 |
57.9 |
67.0 |
|||
|
P99 |
85.1 |
8.5 |
9.8 |
11.7 |
16.8 |
26.2 |
40.3 |
57.0 |
80.1 |
90.9 |
98.7 |
|||
|
100 |
0.9361 |
QPS |
1,886 |
6,370 |
8,100 |
8,757 |
9,422 |
9,780 |
9,856 |
9,684 |
9,619 |
9,471 |
9,369 |
|
|
AVG |
8.5 |
5.0 |
5.9 |
7.3 |
10.1 |
14.7 |
19.4 |
26.2 |
32.9 |
40.0 |
47.3 |
|||
|
P95 |
7.9 |
6.0 |
8.3 |
10.8 |
15.7 |
25.3 |
34.2 |
46.4 |
55.2 |
65.9 |
76.7 |
|||
|
P99 |
123.3 |
9.0 |
10.6 |
13.4 |
20.3 |
35.2 |
51.1 |
70.7 |
81.1 |
93.3 |
100.5 |
|||
|
200 |
10 |
0.9457 |
QPS |
4,476 |
8,180 |
10,801 |
12,389 |
13,852 |
14,635 |
15,176 |
15,319 |
15,363 |
15,242 |
15,026 |
|
AVG |
3.6 |
3.9 |
4.4 |
5.1 |
6.9 |
9.8 |
12.6 |
16.5 |
20.6 |
24.8 |
29.2 |
|||
|
P95 |
4.2 |
4.7 |
5.6 |
7.0 |
9.8 |
14.4 |
19.1 |
26.2 |
33.6 |
41.4 |
49.7 |
|||
|
P99 |
7.4 |
7.8 |
8.3 |
9.6 |
12.6 |
18.4 |
25.1 |
37.1 |
48.3 |
70.2 |
103.8 |
|||
|
30 |
0.9575 |
QPS |
3,936 |
7,519 |
9,787 |
10,833 |
11,891 |
12,786 |
12,932 |
12,960 |
12,847 |
12,762 |
12,686 |
|
|
AVG |
4.1 |
4.2 |
4.9 |
5.9 |
8.0 |
11.2 |
14.7 |
19.6 |
24.6 |
29.7 |
34.8 |
|||
|
P95 |
4.7 |
5.1 |
6.3 |
8.4 |
11.8 |
17.1 |
23.4 |
32.4 |
41.5 |
50.7 |
59.6 |
|||
|
P99 |
12.8 |
8.1 |
8.8 |
11.0 |
15.1 |
22.0 |
31.6 |
45.4 |
61.8 |
98.1 |
103.4 |
|||
|
50 |
0.9588 |
QPS |
3,606 |
6,827 |
8,966 |
9,586 |
10,654 |
11,208 |
11,332 |
11,222 |
11,182 |
11,096 |
11,027 |
|
|
AVG |
4.4 |
4.7 |
5.3 |
6.7 |
9.0 |
12.8 |
16.8 |
22.6 |
28.3 |
34.1 |
40.0 |
|||
|
P95 |
5.1 |
5.7 |
7.3 |
9.8 |
13.4 |
20.2 |
27.9 |
38.9 |
48.7 |
58.1 |
67.3 |
|||
|
P99 |
24.1 |
8.6 |
9.5 |
12.3 |
17.0 |
26.4 |
38.2 |
57.3 |
81.7 |
94.3 |
102.2 |
|||
|
70 |
0.9584 |
QPS |
3,228 |
6,583 |
8,223 |
8,813 |
9,701 |
10,048 |
10,107 |
9,998 |
9,902 |
9,826 |
9,731 |
|
|
AVG |
5.0 |
4.9 |
5.8 |
7.2 |
9.9 |
14.3 |
18.9 |
25.4 |
32.0 |
38.6 |
45.6 |
|||
|
P95 |
5.8 |
5.9 |
8.1 |
10.8 |
15.7 |
24.2 |
33.1 |
44.6 |
53.8 |
63.4 |
74.0 |
|||
|
P99 |
30.8 |
8.9 |
10.4 |
13.4 |
20.5 |
33.3 |
47.2 |
69.4 |
80.9 |
94.3 |
101.4 |
|||
|
100 |
0.9593 |
QPS |
2,790 |
5,873 |
7,399 |
7,826 |
8,394 |
8,714 |
8,612 |
8,429 |
8,334 |
8,274 |
8,151 |
|
|
AVG |
5.7 |
5.4 |
6.5 |
8.2 |
11.4 |
16.5 |
22.2 |
30.0 |
37.9 |
45.9 |
54.5 |
|||
|
P95 |
6.0 |
6.7 |
9.3 |
12.4 |
18.4 |
30.3 |
39.2 |
49.9 |
60.6 |
71.3 |
85.2 |
|||
|
P99 |
47.8 |
9.5 |
11.7 |
15.4 |
23.8 |
42.8 |
59.1 |
72.7 |
84.9 |
95.1 |
102.9 |
|||
|
300 |
10 |
0.9542 |
QPS |
4,117 |
7,614 |
9,708 |
10,990 |
12,126 |
12,604 |
12,992 |
13,001 |
12,886 |
12,791 |
12,741 |
|
AVG |
3.9 |
4.2 |
4.9 |
5.8 |
7.9 |
11.4 |
14.7 |
19.5 |
24.5 |
29.4 |
34.6 |
|||
|
P95 |
4.6 |
5.1 |
6.6 |
8.1 |
11.5 |
17.2 |
23.3 |
32.3 |
41.4 |
50.3 |
58.9 |
|||
|
P99 |
7.6 |
7.9 |
9.0 |
10.5 |
14.4 |
21.8 |
30.8 |
44.5 |
61.6 |
77.4 |
103.6 |
|||
|
30 |
0.9660 |
QPS |
3,912 |
7,191 |
9,107 |
9,867 |
10,831 |
11,301 |
11,534 |
11,512 |
11,348 |
11,365 |
11,228 |
|
|
AVG |
4.1 |
4.4 |
5.3 |
6.5 |
8.8 |
12.7 |
16.5 |
22.1 |
27.9 |
33.3 |
39.4 |
|||
|
P95 |
5.0 |
5.5 |
7.1 |
9.5 |
13.1 |
20.0 |
27.2 |
37.5 |
48.0 |
57.0 |
66.3 |
|||
|
P99 |
8.3 |
8.3 |
9.3 |
11.9 |
16.4 |
26.4 |
36.8 |
52.2 |
74.3 |
94.9 |
109.5 |
|||
|
50 |
0.9684 |
QPS |
3,622 |
6,624 |
8,201 |
8,898 |
9,577 |
9,938 |
10,134 |
9,910 |
9,882 |
9,743 |
9,637 |
|
|
AVG |
4.4 |
4.8 |
5.8 |
7.2 |
10.0 |
14.4 |
18.8 |
25.6 |
32.0 |
38.8 |
45.8 |
|||
|
P95 |
5.3 |
6.0 |
8.3 |
10.7 |
15.7 |
23.9 |
32.9 |
44.7 |
53.5 |
63.0 |
73.2 |
|||
|
P99 |
11.3 |
8.7 |
10.6 |
13.4 |
20.0 |
31.9 |
45.1 |
67.0 |
85.1 |
97.2 |
107.1 |
|||
|
70 |
0.9682 |
QPS |
3,333 |
6,075 |
7,521 |
8,042 |
8,730 |
9,068 |
8,984 |
8,892 |
8,746 |
8,688 |
8,550 |
|
|
AVG |
4.8 |
5.3 |
6.4 |
7.9 |
11.0 |
15.8 |
21.3 |
28.5 |
36.2 |
43.7 |
51.8 |
|||
|
P95 |
5.7 |
6.4 |
9.1 |
12.0 |
18.1 |
28.5 |
38.0 |
47.7 |
58.1 |
68.0 |
79.5 |
|||
|
P99 |
14.0 |
9.1 |
11.4 |
15.0 |
23.8 |
39.3 |
54.3 |
71.1 |
87.0 |
102.5 |
104.9 |
|||
|
100 |
0.9683 |
QPS |
2,939 |
5,490 |
6,809 |
7,189 |
7,752 |
7,712 |
7,666 |
7,600 |
7,464 |
7,383 |
7,310 |
|
|
AVG |
5.4 |
5.8 |
7.0 |
8.9 |
12.3 |
18.6 |
24.9 |
33.4 |
42.4 |
51.4 |
60.6 |
|||
|
P95 |
6.2 |
7.3 |
10.3 |
13.7 |
21.9 |
34.0 |
42.4 |
53.0 |
66.1 |
75.3 |
91.3 |
|||
|
P99 |
26.7 |
9.9 |
12.8 |
17.2 |
30.2 |
48.7 |
61.0 |
76.1 |
87.2 |
99.1 |
107.9 |
|||
|
400 |
10 |
0.9583 |
QPS |
3,747 |
7,079 |
9,137 |
9,743 |
10,734 |
11,236 |
11,391 |
11,359 |
11,246 |
11,237 |
11,112 |
|
AVG |
4.3 |
4.5 |
5.2 |
6.5 |
8.9 |
12.8 |
16.7 |
22.3 |
28.1 |
33.7 |
39.6 |
|||
|
P95 |
5.1 |
5.6 |
7.2 |
9.6 |
13.4 |
20.3 |
27.7 |
38.2 |
48.2 |
57.1 |
66.2 |
|||
|
P99 |
8.0 |
8.4 |
9.4 |
12.0 |
16.8 |
26.7 |
37.0 |
52.8 |
69.6 |
84.8 |
114.4 |
|||
|
30 |
0.9704 |
QPS |
3,700 |
6,933 |
8,182 |
8,997 |
9,682 |
10,126 |
10,280 |
10,142 |
10,051 |
9,909 |
9,839 |
|
|
AVG |
4.3 |
4.6 |
5.9 |
7.1 |
9.9 |
14.2 |
18.6 |
25.0 |
31.4 |
38.0 |
44.9 |
|||
|
P95 |
5.3 |
5.8 |
8.4 |
10.6 |
15.0 |
23.7 |
32.3 |
43.4 |
52.9 |
62.7 |
72.1 |
|||
|
P99 |
8.3 |
8.5 |
10.5 |
13.2 |
18.9 |
31.5 |
44.4 |
62.2 |
74.6 |
101.1 |
112.4 |
|||
|
50 |
0.9733 |
QPS |
3,411 |
6,244 |
7,646 |
8,067 |
8,650 |
9,053 |
9,047 |
8,867 |
8,788 |
8,691 |
8,549 |
|
|
AVG |
4.7 |
5.1 |
6.3 |
7.9 |
11.1 |
15.8 |
21.1 |
28.5 |
35.9 |
43.6 |
51.7 |
|||
|
P95 |
5.7 |
6.5 |
9.0 |
12.1 |
17.7 |
27.7 |
37.3 |
47.4 |
57.2 |
67.2 |
78.9 |
|||
|
P99 |
9.1 |
9.0 |
11.2 |
15.1 |
22.8 |
37.6 |
52.9 |
68.8 |
89.1 |
103.7 |
105.6 |
|||
|
70 |
0.9736 |
QPS |
3,184 |
5,757 |
6,914 |
7,589 |
8,039 |
8,237 |
8,014 |
8,021 |
7,877 |
7,815 |
7,717 |
|
|
AVG |
5.0 |
5.6 |
6.9 |
8.4 |
11.9 |
17.4 |
23.8 |
31.7 |
40.3 |
48.5 |
57.5 |
|||
|
P95 |
6.1 |
7.0 |
10.2 |
13.0 |
20.3 |
32.5 |
41.0 |
50.6 |
63.2 |
72.3 |
88.7 |
|||
|
P99 |
10.5 |
9.5 |
12.6 |
16.2 |
27.1 |
45.2 |
58.3 |
72.9 |
90.2 |
98.5 |
115.6 |
|||
|
100 |
0.9735 |
QPS |
2,843 |
5,214 |
6,245 |
6,784 |
7,185 |
7,109 |
7,044 |
6,888 |
6,825 |
6,730 |
6,667 |
|
|
AVG |
5.6 |
6.1 |
7.7 |
9.4 |
13.3 |
20.2 |
27.1 |
36.8 |
46.4 |
56.5 |
66.7 |
|||
|
P95 |
6.8 |
7.7 |
11.6 |
15.0 |
24.6 |
35.9 |
44.3 |
56.4 |
69.9 |
85.5 |
95.5 |
|||
|
P99 |
20.3 |
10.2 |
14.2 |
19.1 |
34.0 |
50.0 |
63.4 |
77.7 |
87.9 |
100.5 |
111.3 |
|||
|
500 |
10 |
0.9630 |
QPS |
3,681 |
6,970 |
8,166 |
8,843 |
9,607 |
9,962 |
10,135 |
10,076 |
9,890 |
9,837 |
9,785 |
|
AVG |
4.3 |
4.6 |
5.9 |
7.2 |
10.0 |
14.4 |
18.8 |
25.2 |
31.9 |
38.4 |
45.4 |
|||
|
P95 |
5.4 |
5.9 |
8.4 |
10.9 |
15.7 |
23.7 |
33.3 |
43.7 |
53.1 |
61.5 |
71.7 |
|||
|
P99 |
8.1 |
8.6 |
10.7 |
13.5 |
20.2 |
31.1 |
45.4 |
61.8 |
76.4 |
94.1 |
112.6 |
|||
|
30 |
0.9754 |
QPS |
3,381 |
6,362 |
7,722 |
8,343 |
8,836 |
9,093 |
9,081 |
9,019 |
8,893 |
8,774 |
8,700 |
|
|
AVG |
4.7 |
5.0 |
6.2 |
7.7 |
10.8 |
15.8 |
21.0 |
28.2 |
35.6 |
43.2 |
50.9 |
|||
|
P95 |
5.8 |
6.5 |
8.9 |
11.7 |
17.4 |
28.1 |
37.5 |
46.8 |
56.8 |
67.1 |
77.5 |
|||
|
P99 |
8.5 |
9.0 |
11.1 |
14.6 |
22.4 |
38.5 |
51.4 |
66.0 |
82.3 |
100.7 |
113.8 |
|||
|
50 |
0.9776 |
QPS |
3,190 |
6,022 |
7,010 |
7,615 |
8,188 |
8,422 |
8,267 |
8,135 |
7,992 |
7,959 |
7,861 |
|
|
AVG |
5.0 |
5.3 |
6.8 |
8.4 |
11.7 |
17.0 |
23.1 |
31.2 |
39.7 |
47.7 |
56.5 |
|||
|
P95 |
6.2 |
6.8 |
10.1 |
12.9 |
20.6 |
31.0 |
39.9 |
50.0 |
62.0 |
71.4 |
87.8 |
|||
|
P99 |
8.9 |
9.2 |
12.5 |
16.0 |
27.3 |
42.6 |
55.1 |
70.5 |
96.4 |
107.1 |
114.8 |
|||
|
70 |
0.9786 |
QPS |
2,903 |
5,781 |
6,506 |
6,985 |
7,502 |
7,520 |
7,355 |
7,263 |
7,181 |
7,094 |
7,027 |
|
|
AVG |
5.5 |
5.5 |
7.4 |
9.1 |
12.8 |
19.1 |
26.0 |
34.9 |
44.1 |
53.4 |
63.3 |
|||
|
P95 |
6.8 |
7.1 |
11.0 |
14.2 |
23.9 |
34.6 |
43.6 |
53.2 |
66.9 |
78.4 |
93.2 |
|||
|
P99 |
10.1 |
9.6 |
13.5 |
17.9 |
33.0 |
47.8 |
61.1 |
73.9 |
93.8 |
104.2 |
112.3 |
|||
|
100 |
0.9785 |
QPS |
2,761 |
5,163 |
5,931 |
6,381 |
6,709 |
6,613 |
6,418 |
6,374 |
6,264 |
6,215 |
6,194 |
|
|
AVG |
5.8 |
6.2 |
8.1 |
10.0 |
14.3 |
21.7 |
29.7 |
39.9 |
50.6 |
61.2 |
71.9 |
|||
|
P95 |
7.2 |
8.0 |
12.3 |
16.2 |
27.0 |
37.3 |
47.8 |
61.7 |
72.7 |
90.3 |
99.3 |
|||
|
P99 |
12.6 |
10.5 |
15.3 |
20.8 |
37.5 |
51.5 |
66.1 |
80.5 |
97.7 |
105.5 |
120.3 |
top-k = 100
The only difference from the top-k=10 group is that k changed from 10 to 100, and oversample_factor scaled down proportionally to 1/10, keeping the reranking candidate countsidentical across tiers; all other parameters, index, dataset, tool, concurrency levels, and timing methodology remain identical. Recall is measured as Recall@100, using the top-100 ground truth set as baseline.
Highest measured throughput for top-100 15,588 QPS(recall 0.7814), highest recall 0.9650 (ef_search=500 / oversample_factor=10, throughput 6,440 QPS).
|
ef_search |
oversample_factor |
Recall |
Metric |
c16 |
c32 |
c48 |
c64 |
c96 |
c144 |
c192 |
c256 |
c320 |
c384 |
c450 |
|
100 |
1 |
0.7814 |
QPS |
4,418 |
7,958 |
10,847 |
12,770 |
14,334 |
15,177 |
15,403 |
15,515 |
15,408 |
15,588 |
15,321 |
|
AVG |
3.6 |
4.0 |
4.4 |
5.0 |
6.7 |
9.4 |
12.4 |
16.3 |
20.4 |
24.2 |
28.9 |
|||
|
P95 |
4.1 |
4.7 |
5.3 |
6.4 |
9.4 |
16.5 |
25.4 |
37.0 |
51.3 |
61.4 |
82.2 |
|||
|
P99 |
7.3 |
7.9 |
8.3 |
9.1 |
12.2 |
24.2 |
40.1 |
63.5 |
90.7 |
102.1 |
127.7 |
|||
|
3 |
0.8919 |
QPS |
4,107 |
7,479 |
9,934 |
11,272 |
12,646 |
13,390 |
13,944 |
14,019 |
14,094 |
14,088 |
14,087 |
|
|
AVG |
3.9 |
4.3 |
4.8 |
5.7 |
7.6 |
10.7 |
13.7 |
18.1 |
22.4 |
26.9 |
31.4 |
|||
|
P95 |
4.4 |
5.0 |
5.9 |
7.6 |
10.6 |
15.8 |
20.6 |
28.9 |
37.5 |
48.3 |
59.5 |
|||
|
P99 |
7.7 |
8.1 |
8.7 |
10.1 |
13.6 |
20.4 |
27.2 |
46.0 |
72.5 |
89.0 |
96.2 |
|||
|
5 |
0.9042 |
QPS |
3,807 |
7,019 |
9,215 |
10,172 |
11,311 |
11,894 |
12,095 |
12,163 |
11,930 |
12,000 |
11,845 |
|
|
AVG |
4.2 |
4.6 |
5.2 |
6.3 |
8.5 |
12.0 |
15.8 |
20.9 |
26.5 |
31.5 |
37.2 |
|||
|
P95 |
4.7 |
5.4 |
6.6 |
8.7 |
12.0 |
17.9 |
24.5 |
34.0 |
44.0 |
53.4 |
63.5 |
|||
|
P99 |
7.9 |
8.4 |
9.3 |
11.4 |
15.3 |
23.2 |
34.3 |
55.1 |
79.5 |
84.7 |
92.5 |
|||
|
7 |
0.9068 |
QPS |
3,571 |
6,486 |
8,432 |
9,371 |
10,127 |
10,663 |
10,845 |
10,803 |
10,702 |
10,531 |
10,494 |
|
|
AVG |
4.5 |
4.9 |
5.7 |
6.8 |
9.4 |
13.4 |
17.6 |
23.5 |
29.5 |
36.0 |
42.1 |
|||
|
P95 |
5.0 |
5.8 |
7.6 |
9.6 |
13.8 |
20.4 |
28.1 |
39.4 |
50.5 |
61.5 |
72.0 |
|||
|
P99 |
8.2 |
8.9 |
10.0 |
12.3 |
17.4 |
26.9 |
39.3 |
63.8 |
78.6 |
87.6 |
95.7 |
|||
|
10 |
0.9085 |
QPS |
3,279 |
6,011 |
7,591 |
8,213 |
8,911 |
9,235 |
9,276 |
9,156 |
9,081 |
8,992 |
8,933 |
|
|
AVG |
4.9 |
5.3 |
6.3 |
7.8 |
10.7 |
15.5 |
20.6 |
27.8 |
35.0 |
42.1 |
49.7 |
|||
|
P95 |
5.5 |
6.4 |
8.7 |
11.4 |
16.0 |
24.9 |
34.8 |
48.1 |
59.8 |
70.1 |
80.2 |
|||
|
P99 |
8.6 |
9.4 |
11.1 |
14.2 |
20.2 |
33.3 |
53.0 |
70.6 |
79.7 |
90.5 |
97.7 |
|||
|
200 |
1 |
0.7925 |
QPS |
4,116 |
7,579 |
9,868 |
11,254 |
12,704 |
13,620 |
13,964 |
14,245 |
14,262 |
14,260 |
14,184 |
|
AVG |
3.9 |
4.2 |
4.9 |
5.7 |
7.5 |
10.5 |
13.7 |
17.8 |
22.2 |
26.5 |
31.0 |
|||
|
P95 |
4.5 |
4.9 |
6.1 |
7.7 |
10.7 |
15.5 |
20.5 |
28.0 |
37.4 |
47.0 |
60.3 |
|||
|
P99 |
7.6 |
8.0 |
8.8 |
10.1 |
13.4 |
19.9 |
27.2 |
40.2 |
73.6 |
91.0 |
101.8 |
|||
|
3 |
0.9145 |
QPS |
3,792 |
6,865 |
9,138 |
10,068 |
11,296 |
11,869 |
12,056 |
12,170 |
11,987 |
11,807 |
11,879 |
|
|
AVG |
4.2 |
4.7 |
5.2 |
6.3 |
8.5 |
12.1 |
15.8 |
20.9 |
26.4 |
32.0 |
37.2 |
|||
|
P95 |
4.9 |
5.5 |
6.9 |
8.9 |
12.1 |
17.8 |
24.4 |
34.2 |
44.0 |
54.2 |
62.6 |
|||
|
P99 |
7.9 |
8.5 |
9.3 |
11.3 |
15.2 |
22.6 |
33.0 |
50.9 |
75.0 |
92.1 |
95.4 |
|||
|
5 |
0.9334 |
QPS |
3,564 |
6,493 |
8,352 |
9,146 |
10,008 |
10,459 |
10,646 |
10,511 |
10,433 |
10,365 |
10,280 |
|
|
AVG |
4.5 |
4.9 |
5.7 |
7.0 |
9.6 |
13.7 |
17.9 |
24.2 |
30.3 |
36.6 |
43.0 |
|||
|
P95 |
5.1 |
5.9 |
7.7 |
9.9 |
14.0 |
20.8 |
28.8 |
40.3 |
51.7 |
62.5 |
72.9 |
|||
|
P99 |
8.2 |
9.0 |
9.9 |
12.6 |
17.5 |
27.0 |
39.4 |
60.8 |
83.0 |
89.9 |
98.7 |
|||
|
7 |
0.9387 |
QPS |
3,317 |
6,074 |
7,667 |
8,419 |
9,110 |
9,460 |
9,577 |
9,450 |
9,361 |
9,239 |
9,187 |
|
|
AVG |
4.8 |
5.3 |
6.2 |
7.6 |
10.5 |
15.2 |
19.9 |
26.9 |
33.8 |
41.0 |
48.2 |
|||
|
P95 |
5.5 |
6.3 |
8.7 |
11.0 |
15.6 |
24.1 |
33.3 |
46.0 |
58.0 |
68.5 |
79.6 |
|||
|
P99 |
8.6 |
9.3 |
11.0 |
13.7 |
19.5 |
31.9 |
48.0 |
70.2 |
81.7 |
91.6 |
101.0 |
|||
|
10 |
0.9432 |
QPS |
3,013 |
5,546 |
6,912 |
7,391 |
8,011 |
8,271 |
8,206 |
8,092 |
8,020 |
7,922 |
7,812 |
|
|
AVG |
5.3 |
5.8 |
6.9 |
8.6 |
12.0 |
17.3 |
23.3 |
31.4 |
39.5 |
47.9 |
56.7 |
|||
|
P95 |
6.1 |
7.0 |
9.9 |
12.9 |
18.7 |
29.9 |
40.9 |
53.0 |
63.7 |
74.9 |
87.5 |
|||
|
P99 |
9.0 |
9.7 |
12.3 |
15.8 |
24.0 |
41.8 |
59.4 |
72.3 |
85.7 |
93.5 |
103.4 |
|||
|
300 |
1 |
0.7965 |
QPS |
3,833 |
6,903 |
9,132 |
10,359 |
11,226 |
11,895 |
12,199 |
12,292 |
12,122 |
12,088 |
11,960 |
|
AVG |
4.2 |
4.6 |
5.2 |
6.2 |
8.5 |
12.0 |
15.6 |
20.7 |
26.1 |
31.3 |
36.9 |
|||
|
P95 |
4.9 |
5.6 |
6.7 |
8.5 |
12.3 |
17.8 |
24.1 |
33.6 |
43.0 |
52.9 |
62.1 |
|||
|
P99 |
7.8 |
8.4 |
9.2 |
10.9 |
15.5 |
22.4 |
32.4 |
47.7 |
67.1 |
92.5 |
102.0 |
|||
|
3 |
0.9211 |
QPS |
3,545 |
6,486 |
8,520 |
9,388 |
10,232 |
10,629 |
10,844 |
10,736 |
10,634 |
10,604 |
10,428 |
|
|
AVG |
4.5 |
4.9 |
5.6 |
6.8 |
9.3 |
13.5 |
17.6 |
23.7 |
29.7 |
35.5 |
42.1 |
|||
|
P95 |
5.3 |
5.9 |
7.5 |
9.6 |
13.6 |
20.5 |
28.0 |
39.3 |
50.1 |
60.5 |
71.1 |
|||
|
P99 |
8.2 |
8.8 |
9.9 |
12.0 |
16.8 |
26.3 |
37.6 |
58.3 |
80.8 |
92.2 |
101.4 |
|||
|
5 |
0.9437 |
QPS |
3,326 |
5,980 |
7,690 |
8,430 |
9,012 |
9,403 |
9,459 |
9,390 |
9,230 |
9,245 |
9,149 |
|
|
AVG |
4.8 |
5.3 |
6.2 |
7.6 |
10.6 |
15.3 |
20.2 |
27.0 |
34.1 |
40.9 |
48.5 |
|||
|
P95 |
5.7 |
6.5 |
8.7 |
11.0 |
15.8 |
24.1 |
33.5 |
46.4 |
58.4 |
68.3 |
78.8 |
|||
|
P99 |
8.6 |
9.3 |
11.1 |
13.7 |
19.8 |
32.0 |
45.8 |
70.2 |
85.7 |
93.0 |
101.7 |
|||
|
7 |
0.9503 |
QPS |
3,118 |
5,716 |
7,114 |
7,710 |
8,271 |
8,587 |
8,596 |
8,438 |
8,326 |
8,281 |
8,174 |
|
|
AVG |
5.1 |
5.6 |
6.7 |
8.3 |
11.6 |
16.7 |
22.2 |
30.0 |
37.9 |
45.8 |
54.2 |
|||
|
P95 |
6.0 |
6.8 |
9.5 |
12.3 |
17.7 |
27.9 |
38.5 |
51.1 |
62.4 |
72.9 |
84.7 |
|||
|
P99 |
8.8 |
9.6 |
11.9 |
15.0 |
22.5 |
37.3 |
55.6 |
74.0 |
89.3 |
94.2 |
105.4 |
|||
|
10 |
0.9552 |
QPS |
2,872 |
5,201 |
6,395 |
6,865 |
7,374 |
7,526 |
7,377 |
7,259 |
7,194 |
7,109 |
7,029 |
|
|
AVG |
5.6 |
6.1 |
7.5 |
9.3 |
13.0 |
19.1 |
25.9 |
34.9 |
44.1 |
53.5 |
63.3 |
|||
|
P95 |
6.5 |
7.5 |
10.9 |
14.1 |
21.7 |
34.2 |
44.3 |
55.7 |
67.9 |
80.9 |
93.8 |
|||
|
P99 |
9.4 |
10.2 |
13.4 |
17.3 |
28.6 |
47.9 |
64.4 |
74.0 |
86.7 |
99.4 |
109.8 |
|||
|
400 |
1 |
0.7974 |
QPS |
3,585 |
6,575 |
8,476 |
9,387 |
10,073 |
10,607 |
10,801 |
10,726 |
10,647 |
10,529 |
10,450 |
|
AVG |
4.5 |
4.9 |
5.7 |
6.8 |
9.5 |
13.5 |
17.7 |
23.7 |
29.8 |
36.0 |
42.3 |
|||
|
P95 |
5.3 |
5.9 |
7.5 |
9.7 |
14.1 |
20.4 |
28.2 |
39.2 |
50.5 |
60.8 |
71.0 |
|||
|
P99 |
8.1 |
8.7 |
9.7 |
12.2 |
17.6 |
26.1 |
37.9 |
54.0 |
79.7 |
96.3 |
104.4 |
|||
|
3 |
0.9235 |
QPS |
3,306 |
5,976 |
7,810 |
8,524 |
9,148 |
9,591 |
9,668 |
9,574 |
9,490 |
9,397 |
9,305 |
|
|
AVG |
4.8 |
5.3 |
6.1 |
7.5 |
10.5 |
15.0 |
19.8 |
26.5 |
33.3 |
40.2 |
47.5 |
|||
|
P95 |
5.7 |
6.6 |
8.5 |
10.8 |
15.6 |
23.4 |
32.5 |
45.0 |
56.8 |
67.1 |
77.7 |
|||
|
P99 |
8.5 |
9.2 |
10.8 |
13.4 |
19.5 |
30.1 |
43.9 |
66.8 |
87.5 |
97.1 |
108.3 |
|||
|
5 |
0.9478 |
QPS |
3,225 |
5,846 |
7,119 |
7,646 |
8,307 |
8,583 |
8,602 |
8,421 |
8,424 |
8,257 |
8,173 |
|
|
AVG |
5.0 |
5.5 |
6.7 |
8.4 |
11.5 |
16.7 |
22.2 |
30.1 |
37.5 |
45.8 |
54.1 |
|||
|
P95 |
6.0 |
6.8 |
9.6 |
12.5 |
17.6 |
27.9 |
38.4 |
50.9 |
60.9 |
72.9 |
85.2 |
|||
|
P99 |
8.6 |
9.4 |
11.9 |
15.4 |
22.1 |
37.2 |
53.5 |
75.4 |
86.0 |
96.1 |
108.8 |
|||
|
7 |
0.9552 |
QPS |
2,979 |
5,398 |
6,592 |
7,128 |
7,629 |
7,799 |
7,771 |
7,682 |
7,522 |
7,456 |
7,365 |
|
|
AVG |
5.4 |
5.9 |
7.3 |
9.0 |
12.6 |
18.4 |
24.6 |
33.1 |
42.1 |
50.8 |
60.1 |
|||
|
P95 |
6.4 |
7.3 |
10.5 |
13.6 |
20.1 |
32.6 |
42.6 |
54.0 |
66.6 |
77.1 |
91.8 |
|||
|
P99 |
9.0 |
9.9 |
13.1 |
16.7 |
26.0 |
44.9 |
62.2 |
76.9 |
87.5 |
100.2 |
109.0 |
|||
|
10 |
0.9603 |
QPS |
2,730 |
4,954 |
5,927 |
6,358 |
6,871 |
6,818 |
6,700 |
6,657 |
6,563 |
6,471 |
6,423 |
|
|
AVG |
5.9 |
6.5 |
8.1 |
10.0 |
13.9 |
21.1 |
28.5 |
38.2 |
48.3 |
58.6 |
69.3 |
|||
|
P95 |
7.0 |
8.0 |
12.0 |
15.4 |
24.8 |
37.5 |
46.6 |
59.3 |
71.8 |
87.5 |
98.7 |
|||
|
P99 |
9.5 |
10.6 |
14.7 |
19.2 |
33.8 |
52.6 |
65.0 |
77.1 |
92.0 |
106.1 |
118.0 |
|||
|
500 |
1 |
0.7995 |
QPS |
3,409 |
6,060 |
7,806 |
8,457 |
9,108 |
9,506 |
9,645 |
9,513 |
9,407 |
9,324 |
9,306 |
|
AVG |
4.7 |
5.3 |
6.1 |
7.6 |
10.5 |
15.1 |
19.8 |
26.7 |
33.6 |
40.6 |
47.5 |
|||
|
P95 |
5.8 |
6.6 |
8.5 |
11.1 |
15.8 |
24.0 |
33.2 |
45.6 |
56.9 |
67.3 |
77.2 |
|||
|
P99 |
8.4 |
9.3 |
10.7 |
13.8 |
19.7 |
31.3 |
44.9 |
63.0 |
83.2 |
102.0 |
107.6 |
|||
|
3 |
0.9269 |
QPS |
3,086 |
6,057 |
7,167 |
7,897 |
8,333 |
8,694 |
8,679 |
8,622 |
8,461 |
8,401 |
8,326 |
|
|
AVG |
5.2 |
5.3 |
6.7 |
8.1 |
11.5 |
16.5 |
22.0 |
29.4 |
37.4 |
45.1 |
53.2 |
|||
|
P95 |
6.3 |
6.7 |
9.5 |
12.0 |
17.7 |
27.3 |
37.8 |
50.3 |
61.1 |
72.1 |
83.5 |
|||
|
P99 |
8.8 |
9.3 |
11.7 |
14.7 |
22.2 |
36.0 |
51.9 |
73.1 |
91.7 |
101.8 |
109.2 |
|||
|
5 |
0.9505 |
QPS |
2,967 |
5,611 |
6,758 |
7,225 |
7,786 |
8,019 |
7,908 |
7,813 |
7,715 |
7,635 |
7,531 |
|
|
AVG |
5.4 |
5.7 |
7.1 |
8.8 |
12.3 |
17.9 |
24.2 |
32.5 |
41.1 |
49.7 |
58.9 |
|||
|
P95 |
6.5 |
7.2 |
10.2 |
13.3 |
19.3 |
31.4 |
42.1 |
53.3 |
64.7 |
76.1 |
89.7 |
|||
|
P99 |
9.0 |
9.7 |
12.6 |
16.3 |
24.6 |
42.5 |
59.7 |
76.6 |
89.0 |
97.7 |
111.4 |
|||
|
7 |
0.9592 |
QPS |
2,878 |
5,277 |
6,262 |
6,641 |
7,136 |
7,134 |
7,069 |
6,999 |
6,888 |
6,784 |
6,730 |
|
|
AVG |
5.6 |
6.1 |
7.7 |
9.6 |
13.4 |
20.1 |
27.0 |
36.3 |
46.1 |
55.9 |
66.1 |
|||
|
P95 |
6.8 |
7.6 |
11.0 |
14.8 |
23.2 |
36.0 |
44.9 |
56.8 |
69.8 |
84.2 |
96.3 |
|||
|
P99 |
9.2 |
10.1 |
13.6 |
18.3 |
30.9 |
50.3 |
63.6 |
77.9 |
95.3 |
102.0 |
113.0 |
|||
|
10 |
0.9650 |
QPS |
2,590 |
4,836 |
5,671 |
6,089 |
6,440 |
6,290 |
6,220 |
6,109 |
6,044 |
5,969 |
5,954 |
|
|
AVG |
6.2 |
6.6 |
8.4 |
10.5 |
14.9 |
22.8 |
30.6 |
41.6 |
52.5 |
63.8 |
74.8 |
|||
|
P95 |
7.5 |
8.4 |
12.4 |
16.5 |
27.2 |
39.3 |
48.9 |
64.2 |
76.1 |
92.4 |
101.9 |
|||
|
P99 |
9.8 |
10.8 |
15.2 |
20.8 |
37.3 |
54.1 |
67.7 |
81.1 |
94.1 |
108.1 |
121.5 |
Data analysis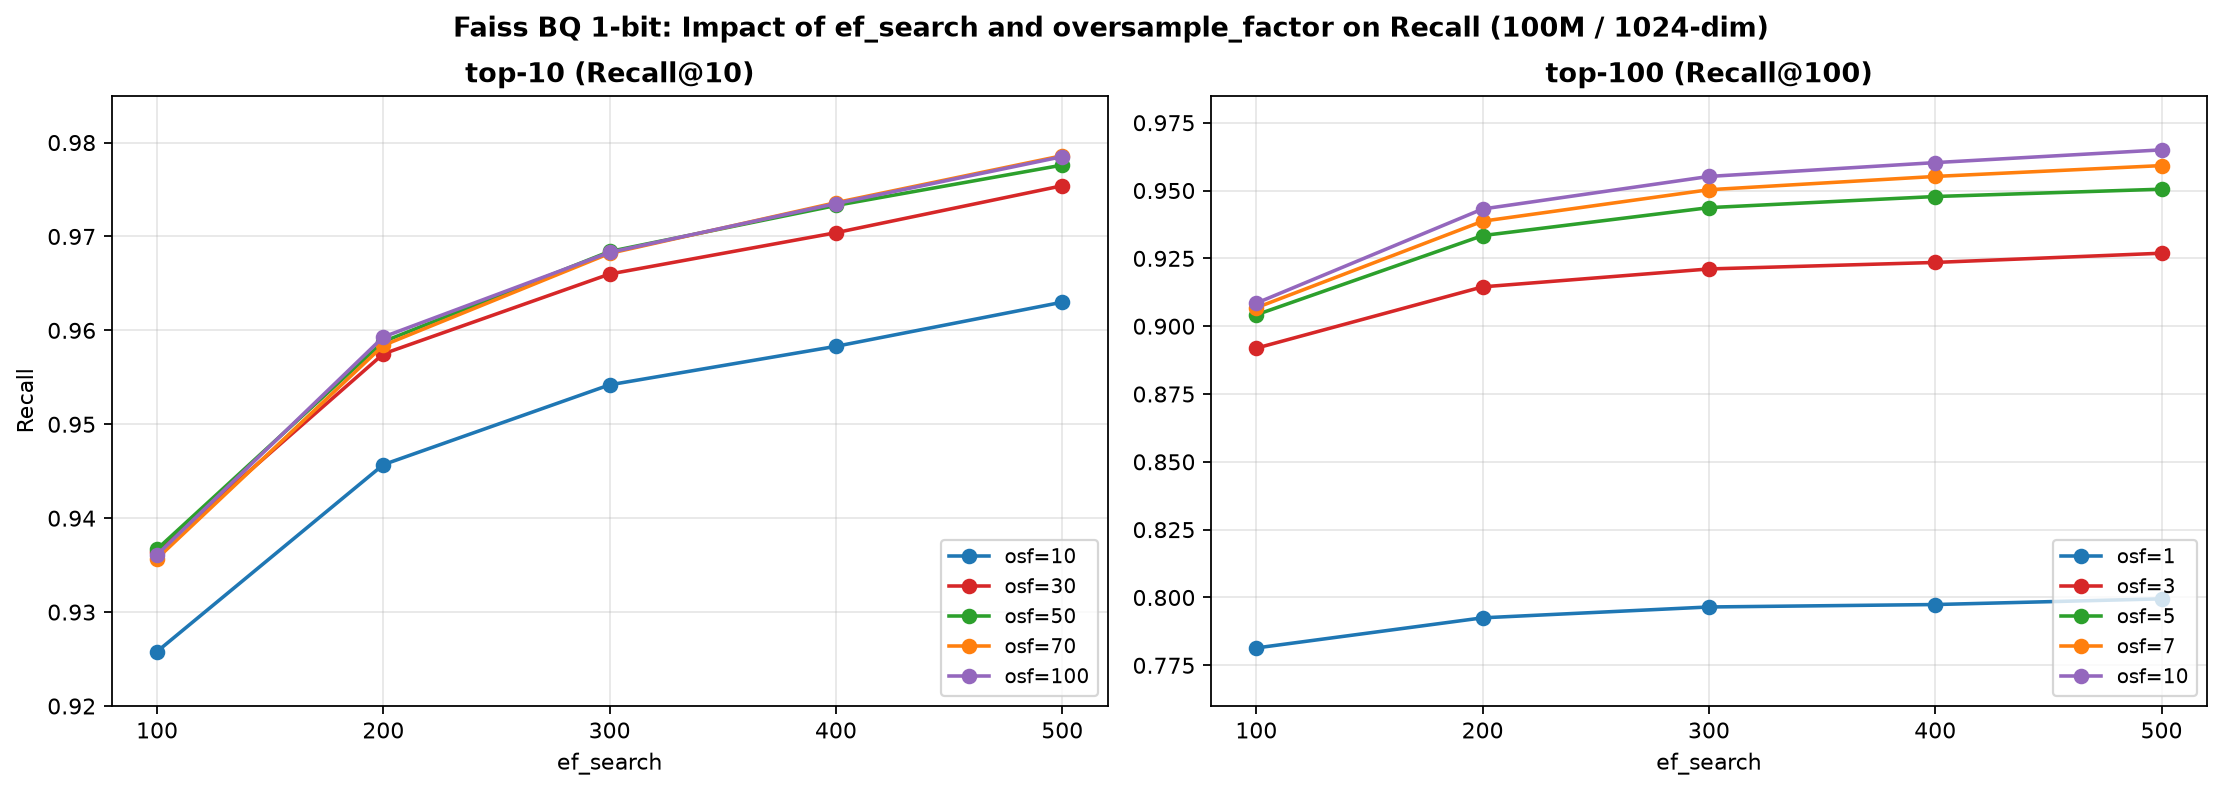
-
Both parameters must be tuned; adjusting only one will cap recall at a lower level. Taking top-100 as an example: with
ef_search=100only increasingoversample_factor, recall caps at 0.9085; with fixedoversample_factor=1only increasingef_search, capped at 0.7995; while setting both to their maximum values reaches 0.9650. The same pattern holds for top-10: individually tuning each parameter caps recall at 0.9367 and 0.9630 respectively, while joint tuning reaches 0.9786. -
In the low-recall region, increasing
oversample_factoroffers better cost-effectiveness, while in the high-recall region, relying onef_search. is essential. Taking top-100 as an example, atef_search=100, increasingoversample_factorfrom 1 to 5 raises recall from 0.7814 to 0.9042 (+12.3 percentage points) with only a 22.0% drop in peak throughput, offering excellent cost-effectiveness; but further increasing to 10 adds only 0.4 more percentage points. At this point, switching to increaseef_searchfrom 100 to 500 gains another 5.65 percentage points (0.9085 → 0.9650). -
The two parameters reinforce each other: as candidates increase, the effect of raising
ef_searchbecomes more pronounced. Increasingef_searchfrom 100 to 500, top-100 withoversample_factor=1gains only 1.8 percentage points, whereas withoversample_factor=10it gains 5.65 percentage points (approximately 3.1x). This is because once the candidate pool is sufficient, improving candidate quality can fully translate into better final results. -
For top-10,
oversample_factorhas a clear saturation point, while top-100 does not. Atef_search=100, top-10 recall essentially stops improving starting fromoversample_factor=30onward (0.9364 → 0.9361, only −0.03 percentage points from 30 to 100), while peak throughput drops from 15,257 to 9,856 (−35.4%), representing pure negative return; top-100 continues to improve up tooversample_factor=10(+0.43 percentage points). The reason is that top-10 already has a 10:1 filtering margin at the minimum candidate count (100), while top-100 operates at 1:1 with no margin at all.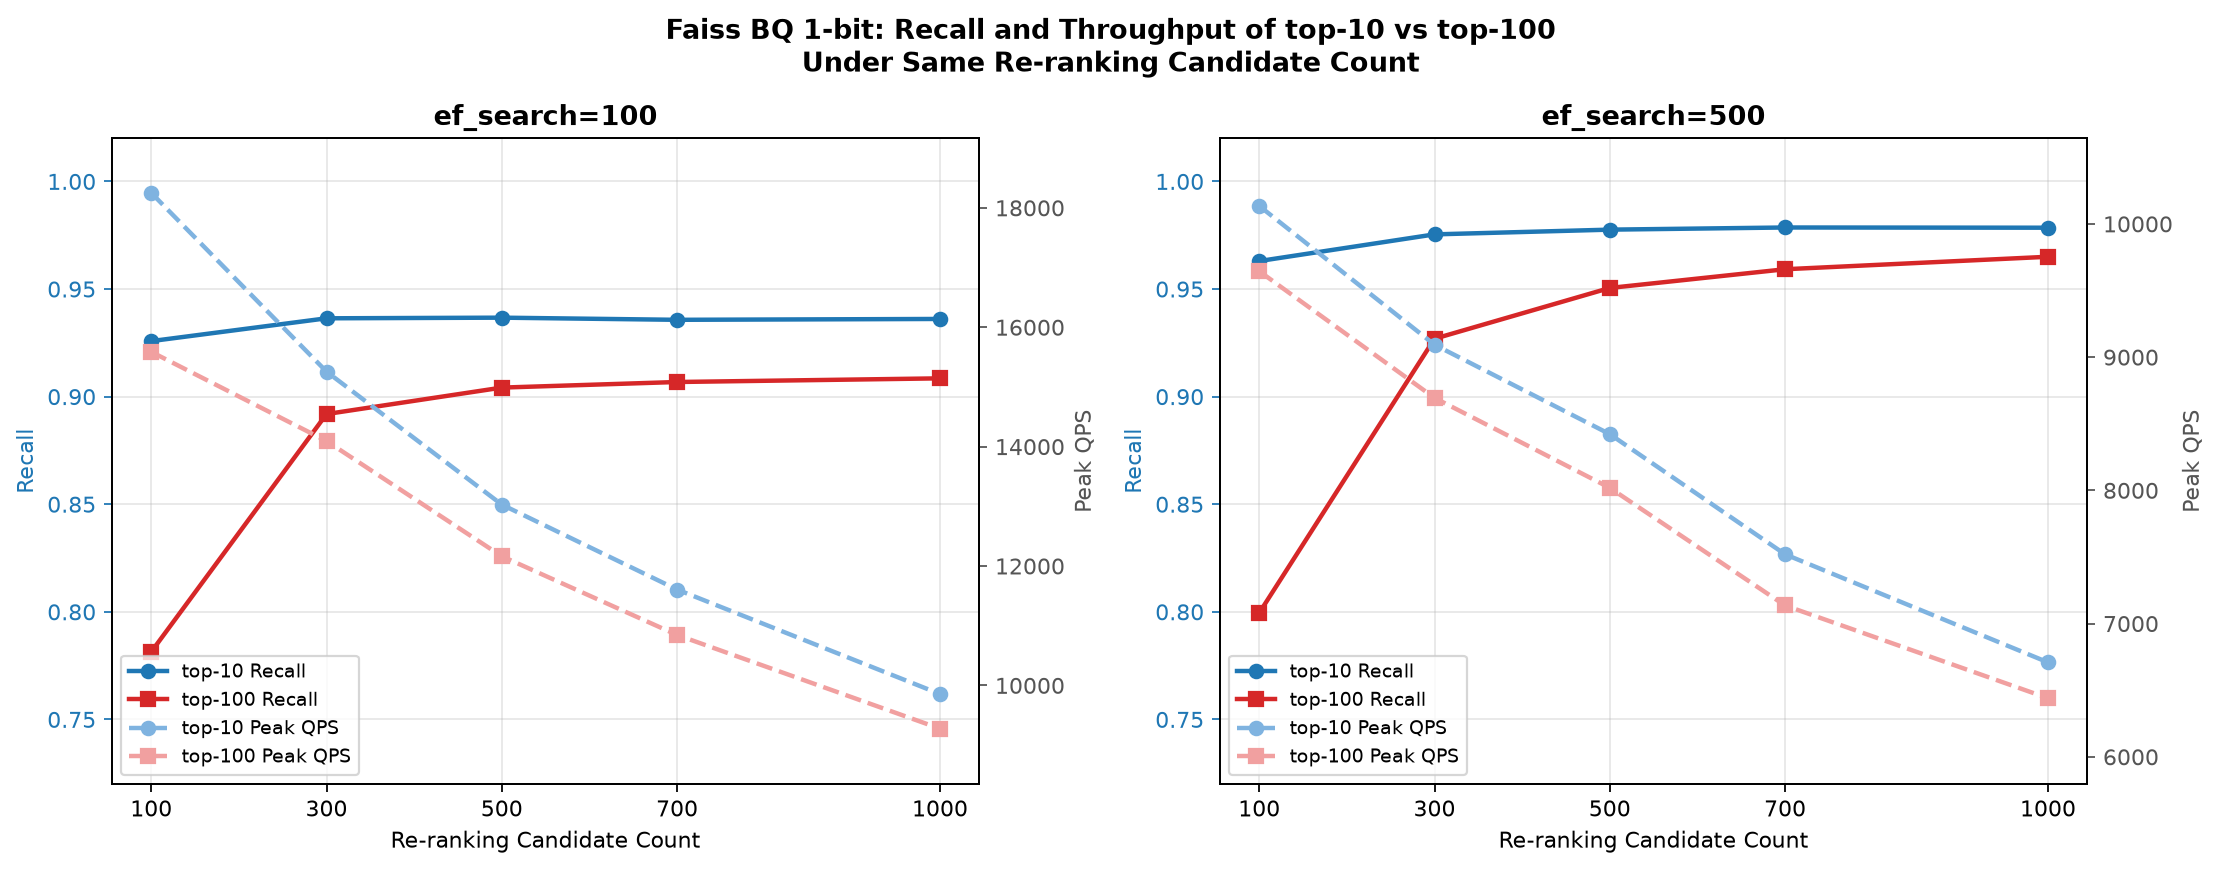
-
With the same candidate count, top-100 recall is lower than top-10, but throughput remains comparable. With reranking candidate counts aligned tier by tier, the recall gap narrows from 14.4–16.4 percentage points (candidate count 100) to 1.3–2.8 percentage points (candidate count 1000), while the peak throughput difference at the same tier mostly stays within 10%. This indicates that server-side overhead is primarily determined by the two query parameters,
kaffecting only the response body size. -
The larger the parameters, the earlier peak concurrency occurs. Lightweight configurations (
ef_search=100) mostly peak at c192–c384, while the heaviest configuration (ef_search=500with largeoversample_factor) peaks as early as c96–c144. The heavier each individual query, the less concurrency is needed to saturate the CPU. Therefore, under high-precision configurations, excessively high client-side concurrency is neither necessary nor advisable.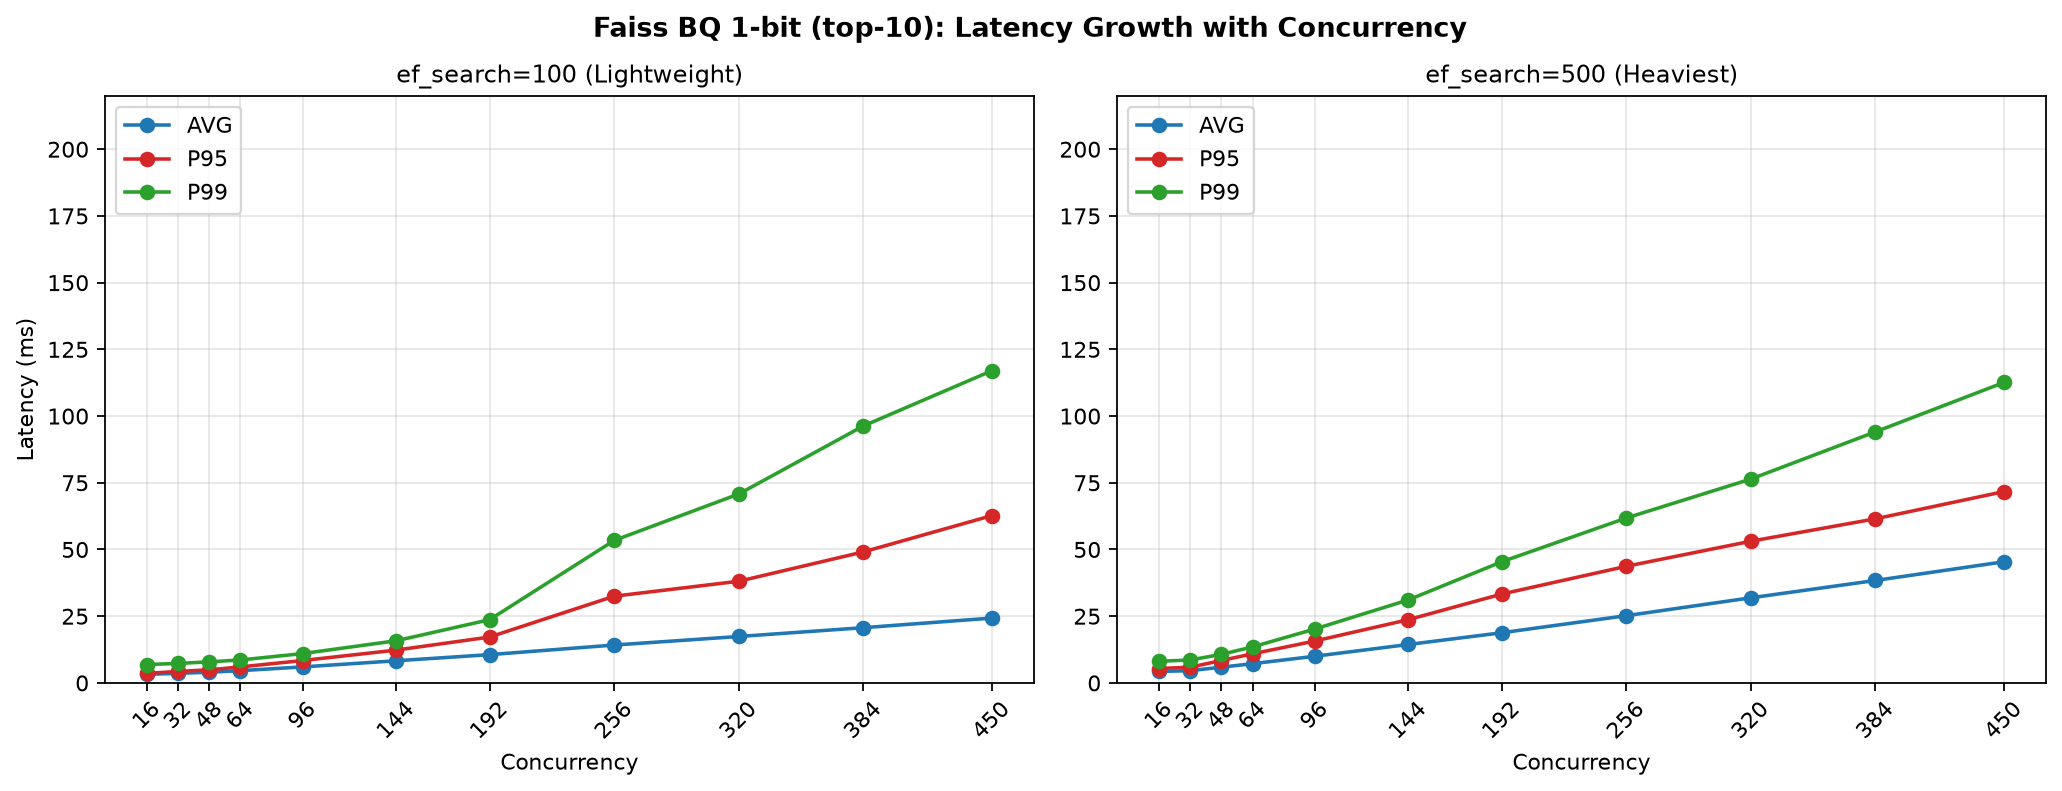
-
Latency grows approximately linearly with concurrency, and P99 rises in a step-like manner after peak throughput. For example, with
ef_search=100 / oversample_factor=10 / k=10For example, with ef_search=100 / oversample_factor=10 / k=10, average latency increases from 3.2 ms at c16 to 24.3 ms at c450 (approximately 7.6x) while concurrency grows 28x, indicating stable queuing behavior; P99 at the same tier jumps from 23.7 ms at c192 to 53.4 ms at c256. If the workload has P99 constraints, keep concurrency at or below the peak throughput point.
Recall is measured during the serial phase and depends only on index parameters and the two query parameters, independent of concurrency, so each group reports a single value. Throughput decline from peak to c450 is within 8% for all combinations (most within 5%), representing normal drag within the saturation plateau; analysis should use peak values per tier. A few combinations show notably elevated c16 readings (e.g., ef_search=100 / oversample_factor=100 P99), attributable to page cache and JIT instability during warm-up—a cold-start characteristic that does not represent steady-state performance.
Resource saturation
Measured readings during the formal test phase are as follows. "Single node" takes the maximum value across the two search nodes.
|
Metric |
Measured value |
|
Single-node CPU |
Peak 97% |
|
Dual-node CPU balance difference |
Within 3% at peak tier |
|
Search thread pool rejections |
0 throughout |
|
Search thread pool queue |
No overflow |
|
k-NN circuit breaker |
Not triggered throughout (graph memory accounts for 29.7% of the circuit breaker limit) |
|
Graph memory (off-heap) |
21.6 GiB/node, resident throughout |
|
Disk read rate |
< 1 MB/s in steady state (page cache nearly fully hit) |
|
Client CPU |
Not a constraint |
Neither thread pools nor circuit breakers were triggered, dual-node CPU was balanced (within 3% difference), disk reads were near zero—the current throughput bottleneck is CPU compute capacity, not memory, queue capacity, or IO.
Faiss vs. Lucene comparison
The parameter matrices in the two chapters differ (Lucene has only one effective knob), so direct tier-by-tier alignment is not possible. The comparison below uses the common comparable range across both chapters: same dataset, same cluster specifications, same M=32 / ef_construction=200, same single segment per shard.
Reachable recall ceiling
|
Engine |
Highest Recall@10 |
Corresponding throughput |
Highest Recall@100 |
Corresponding throughput |
|
Lucene |
0.9729 |
3,974 QPS |
0.9598 |
4,101 QPS |
|
Faiss |
0.9786 |
7,520 QPS |
0.9650 |
6,440 QPS |
At the shared ceiling ef_search=500, Faiss achieves higher measured recall than Lucene and also delivers higher throughput at that recall (89.2% and 57.0% higher respectively). The difference stems from the tunable dimensions: at the same ef_search, Faiss can additionally leverage oversample_factor to append reranking candidates, while Lucene takes the larger of its two parameters—effectively a single knob. Note that recall for both engines has not saturated as ef_search increases—the last tier (400 → 500) yields Lucene +0.34/+0.81 percentage points and Faiss +0.50/+0.47 percentage points. Continuing to raise ef_search leaves headroom for both. Values in the tables are the highest measured within this test's parameter matrix and do not represent the engines' recall ceilings.
Throughput at equal recall
A more meaningful comparison for practical engine selection is "how much throughput each engine can achieve at comparable recall levels":
|
top-k |
Recall range |
Faiss config / recall / peak QPS |
Lucene config / recall / peak QPS |
Faiss advantage |
|
10 |
≈ 0.93 |
ef=100, osf=10 → 0.9258 → 18,251 |
ef=100 → 0.9283 → 13,150 |
+38.8% |
|
10 |
≈ 0.954 |
ef=300, osf=10 → 0.9542 → 13,001 |
ef=200 → 0.9530 → 8,154 |
+59.4% |
|
10 |
0.96 |
6,747 |
12,541 |
+86% |
|
10 |
≈ 0.970 |
ef=400, osf=30 → 0.9704 → 10,280 |
ef=400 → 0.9695 → 4,717 |
+117.9% |
|
100 |
≈ 0.91 |
ef=100, osf=10 → 0.9085 → 9,276 |
ef=200 → 0.9109 → 8,069 |
+15.0% |
|
100 |
≈ 0.94 |
ef=200, osf=7 → 0.9387 → 9,577 |
ef=300 → 0.9389 → 6,089 |
+57.3% |
|
100 |
≈ 0.96 |
ef=400, osf=10 → 0.9603 → 6,871 |
ef=500 → 0.9598 → 4,101 |
+67.5% |
|
100 |
0.9598 |
4,101 |
6,991 |
+70% |
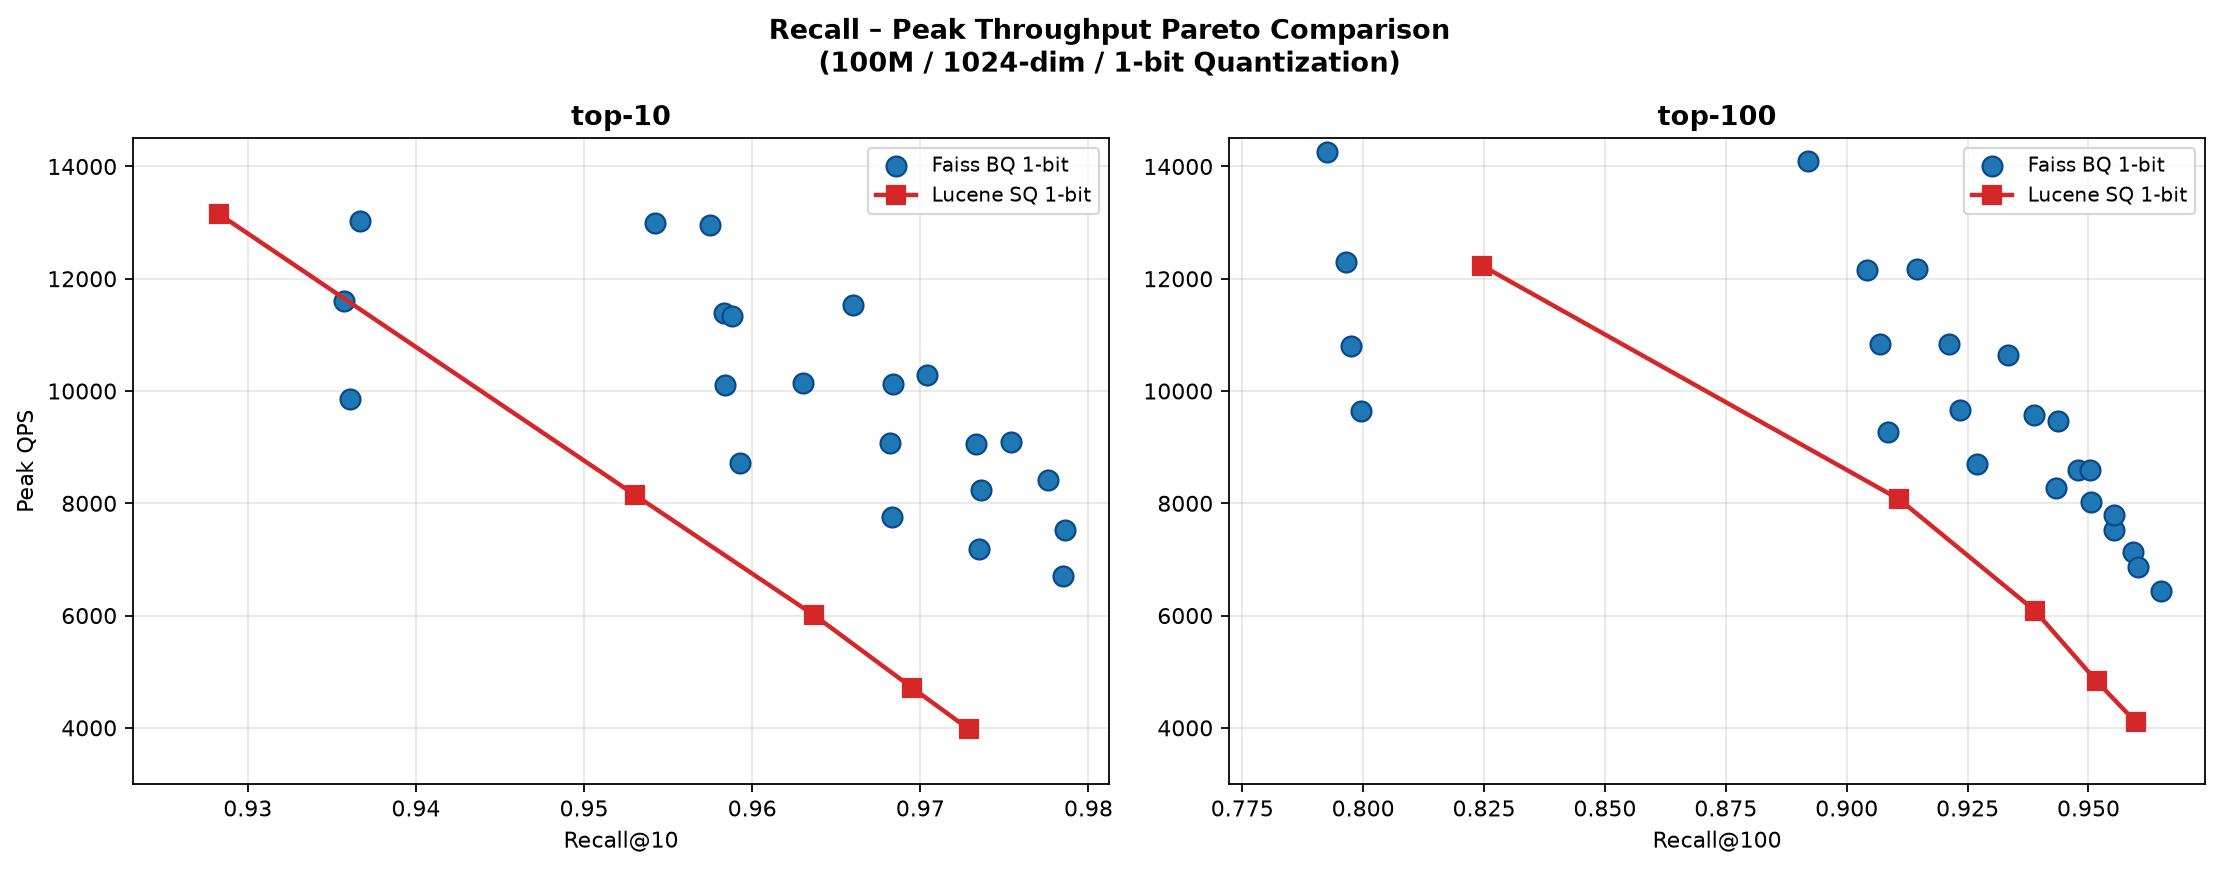
At the same recall target, Faiss throughput leads Lucene by 38%–144%, with the advantage growing as recall requirements increase. Each point in the chart represents a parameter configuration's recall–peak throughput pair:
-
At the same recall level, Faiss data points are consistently above the Lucene curve
-
The Lucene curve terminates earlier on the right side because at the shared peak
ef_search=500it only reaches 0.9729/0.9598, not because its recall capability has peaked.
The gap stems from Faiss being able to tune two parameters simultaneously, while Lucene can only raise ef_search, making the single-knob approach more costly.
Storage and memory
|
Engine |
Primary shard storage |
Hot data (per node) |
Hot data residency location |
Consumes circuit breaker quota |
|
Lucene |
460.3 GiB |
13.5 GiB |
Page cache |
No |
|
Faiss |
478.7 GiB |
21.6 GiB |
Off-heap memory |
Yes (measured at 29.7% of the circuit breaker limit) |
Primary shard storage differs by only 4% between the two engines, but the volume and residency location of hot data differ. Faiss requires 21.6 GiB/node of resident hot data, about 60% more than Lucene's 13.5 GiB. Both have the same neighbor count and identical 1-bit quantized vector sizes; the difference comes from graph structure encoding—Faiss stores neighbor IDs as fixed-length integers while Lucene uses variable-length compression, causing the same graph connections to consume more space in Faiss. Both store a copy of full-precision vectors for reranking (216.3 GiB/node each). For capacity planning, Lucene only needs to ensure page cache can hold the hot data, while Faiss additionally requires confirming that graph memory stays within the k-NN circuit breaker limit.
Comparison with FP32 full precision
Compared withPerformance test report: 100M-scale vectors (1024-D / FP32)to assess the value of quantization. Both reports share the same dataset, query set, graph-building parameters (M=32 / ef_construction=200), engine version, and per-node CPU specifications. The difference lies in cluster scale: the 1-bit side uses 2 nodes × 128 GiB (256 GiB total memory, 2 primary shards), while the FP32 side uses 3 nodes × 256 GiB (768 GiB total memory, 3 primary shards). The 1-bit side has less than two-thirds the memory and shard count of the FP32 side, so the throughput comparison below is conservative for 1-bit and should be read accordingly.
Comparable recall ceilings
|
Engine |
Precision |
Highest Recall@10 |
Highest Recall@100 |
|
Faiss |
FP32 |
0.9733 |
0.9728 |
|
Faiss |
1-bit |
0.9786 |
0.9650 |
|
Lucene |
FP32 |
0.9715 |
0.9732 |
|
Lucene |
1-bit |
0.9729 |
0.9598 |
-
At top-100, the
ef_searchpeak settings on both sides are both 500, comparable: 1-bit is 0.8–1.3 percentage points lower, with quantization error more exposed at tail positions. -
At top-10, the peak settings differ between sides (FP32 at 350, 1-bit at 500), not directly comparable. The higher value on the 1-bit side only reflects a deeper parameter sweep, and the FP32 side from
ef_search=256to 350 still shows a +0.46 percentage point increase with no saturation observed. What can be confirmed is that both precision levels can reach the 0.96–0.97 range and quantization does not constitute a recall bottleneck. However, this test is insufficient to determine which has a higher recall ceiling.
QPS at the same recall
At each recall target, the maximum QPS configurations achievable by each side are compared (the 1-bit cluster resources are only 1/3 of the FP32 side):
|
Engine |
top-k |
Recall range |
FP32 (768 GiB) |
1-bit (256 GiB) |
1-bit / FP32 |
|
Faiss |
10 |
≥ 0.97 |
7,113 (ef=350) |
10,280 (ef=400, osf=30) |
145% |
|
Faiss |
100 |
0.94 |
11,520 |
9,546 |
83% |
|
Faiss |
10 |
≈ 0.95 |
12,277 (ef=128) |
13,001 (ef=300, osf=10) |
106% |
|
Faiss |
10 |
0.96 |
10,552 |
12,541 |
119% |
|
Faiss |
100 |
≈ 0.96 |
6,549 (ef=400) |
6,871 (ef=400, osf=10) |
105% |
|
Faiss |
100 |
≈ 0.95 |
9,618 (ef=200) |
8,596 (ef=300, osf=7) |
89% |
|
Lucene |
10 |
≥ 0.97 |
4,468 (ef=350) |
3,974 (ef=500) |
89% |
|
Lucene |
100 |
0.94 |
8,413 |
5,981 |
71% |
|
Lucene |
10 |
≈ 0.95 |
8,785 (ef=128) |
8,154 (ef=200) |
93% |
|
Lucene |
10 |
0.96 |
6,910 |
6,747 |
98% |
|
Lucene |
100 |
≈ 0.95 |
6,477 (ef=200) |
4,831 (ef=400) |
75% |
|
Lucene |
100 |
0.9598 |
5,596 |
4,101 |
73% |
Reading methodology: For each side, first take the points with the highest throughput at the same recall from all parameter combinations to form the frontier, then linearly interpolate between adjacent frontier points to the recall target in the table. Compare only after aligning both sides to the same recall value. All recall targets fall within the measured range of both sides, with no extrapolation.
-
In the top-10 scenario, 1-bit achieves no less than full precision with 1/3 of the memory resources. Faiss side outperforms by 14%–25%, with the advantage growing as recall requirements increase; Lucene side is roughly on par (96%–99%). The 1-bit side cluster memory is only one-third of the FP32 side; this ratio actually underestimates the cost-effectiveness of quantization.
-
The reason Faiss outperforms in the high-recall range is an additional knob. Quantization gives Faiss an additional independent dimension—the reranking candidate pool, which can be scaled to 100x k; full-precision side recall is entirely determined by
ef_search, so in the high-recall range it can only deepen graph traversal, with higher marginal cost. -
In the top-100 scenario, 1-bit trails full precision by 16%–29%. When returning 100 results, the available multiplier for the reranking candidate pool is compressed by the upper limit, and quantization error is more exposed at the tail of the result list, requiring deeper graph traversal to compensate. Lucene side trails more (27%–29%), because it only has
ef_searchone effective knob. -
The ratios in this table should not be taken as the true production cost-effectiveness of quantization. The test uses 1,677 query samples, and reranking reads on the quantized side mostly hit page cache. Under production random query workloads, page faults reading full-precision vectors (216 GiB/node) from disk become the primary bottleneck, and actual throughput will be lower than reported here, while the FP32 side avoids this risk because all data is resident. Choosing quantization requires reserving additional page cache for full-precision vectors.
Storage and memory
|
Engine |
Precision |
Primary shard storage |
Hot data requiring resident memory (single node) |
|
Faiss |
FP32 |
898.7 GiB |
154.2 GiB |
|
Faiss |
1-bit |
478.7 GiB (down 47%) |
21.6 GiB (down 7×) |
|
Lucene |
FP32 |
444.2 GiB |
137.9 GiB |
|
Lucene |
1-bit |
460.3 GiB (slightly up) |
13.5 GiB (down 10×) |
Two observations:
-
Primary shard storage changes depend on engine architecture. Under Faiss FP32, two complete copies of vectors are stored (graph file + flat recomputation file); after quantization, the second copy becomes 1-bit, cutting storage roughly in half. Under Lucene FP32, graph and vectors coexist in a single segment file; after quantization, an additional 1-bit vector copy is added, slightly increasing storage.
-
Hot data drops by an order of magnitude. The hot data that both engines must keep resident (HNSW graph + quantized vectors) drops from over a hundred GiB to tens of GiB, shifting full-precision vectors from "fully resident" to "read on demand during reranking." This is the core value of quantization: the same hardware can support significantly larger datasets.
Selection and production guidance
Scenarios
1-bit quantization suits scenarios where memory is constrained and the dataset is too large to fully cache all vectors. Quantization compresses the memory-resident portion by an order of magnitude, at the cost of two-stage retrieval (coarse ranking + full-precision reranking), resulting in lower throughput and additional reranking read overhead compared to full precision at the same specifications. If the hardware can cache all vectors, quantization offers no advantage and full precision should be preferred.
Engine selection
Both engines have comparable storage footprints; engine selection primarily depends on throughput, recall ceiling, and operational complexity (conclusions below are based on the test specifications in this report; actual values vary with workload characteristics and hardware):
|
Dimension |
Lucene SQ 1-bit |
Faiss BQ 1-bit |
|
Throughput at equal recall |
Baseline |
Leads (advantage grows with higher recall requirements) |
|
Recall ceiling |
Relatively low |
Relatively high |
|
Tuning dimensions |
1 ( |
2 ( |
|
Memory constraints |
Whether page cache can hold hot data |
Additionally constrained by the k-NN circuit breaker (graph memory) |
|
Operational considerations |
No special requirements |
Requires evaluating graph memory against the circuit breaker limit; recommend calling the warmup API before queries to preload the graph |
Choose Faiss for higher throughput and recall ceilings; choose Lucene for simpler tuning without memory circuit breaker concerns (verify specific differences on target hardware through benchmarking). Under the test specifications used here, Faiss leads by 15%–118% in equal-recall comparisons, with the gap widening at higher recall requirements.
Parameter trade-offs
First determine the recall target, then select the configuration with the highest throughput among those meeting the target.Optimal values and inflection points depend on the dataset, dimensionality, and scale, and must be determined by parameter sweeping on actual business data; the following provides only a parameter selection methodology.
-
Lucene has only one knob: only sweep
ef_search;oversample_factor; no need to set (values belowef_searchhave no effect). -
For Faiss, prioritize tuning
oversample_factor: when the two parameters take effect independently, increasing the reranking candidate count offers better recall cost-effectiveness than widening the coarse-ranking beam—the former only adds reranking computation while solidly improving recall; the latter lengthens graph traversal paths, and coarse-ranking quality quickly plateaus when the candidate count is insufficient. -
Watch for diminishing marginal returns and stop in time: as
oversample_factorincreases, recall saturates (top-10 saturates earlier, top-100 later); beyond the inflection point, throughput keeps declining without recall improvement, yielding pure negative returns. In this test, top-10 saturates afterosf=30(further increasing to 100 causes recall to stagnate or slightly decrease while throughput drops 35%); top-100 continues to improve slowly up toosf=10; the exact inflection point varies with business data, so parameter sweeping on production traffic is recommended. -
Costs escalate sharply in the high-recall range: pushing from a usable recall level (e.g., ~0.93) to the recall ceiling often requires several times the search breadth and sacrifices most of the throughput. If the workload tolerates moderate recall, lowering the recall target can yield significant throughput gains.
-
The two top-k values require separate tuning: with the same reranking candidate count, top-100 recall is inherently lower than top-10, so top-10 tuning results cannot be directly reused.
Build parameters
M/ef_constructionare set at index build time and determine graph quality and memory footprint. This test fixesM=32/ef_construction=200:-
M=32: at the 100M scale with high dimensionality (1024-D), graph connectivity must be high enough to sustain 0.97+ recall;M=16is acceptable at the 10M scale, but at the 100M scale the larger graph suffers insufficient connectivity and a limited recall ceiling. -
ef_construction=200: graph construction candidate queue width—200 strikes a good balance between graph quality and indexing speed, and further increases yield diminishing returns on recall.
-
-
Additional considerations for quantization: under 1-bit quantization the graph is built from quantized vectors, so its navigation quality is inherently lower than that of full precision;
Ma value that is too small further amplifies this disadvantage, so for 100M-scale quantized scenarios we do not recommend going belowM=32.
is not recommended. For 100M-scale scenarios, directly adopt M=32 / ef_construction=200and focus tuning on query-time parameters (ef_search / oversample_factor); for empirical comparisons of build parameters on the recall–throughput trade-off, refer toPerformance test report: 10M-scale vectors (1024-D / FP32).
Production environment considerations
-
Memory planning has two layers: hot data (HNSW graph + quantized vectors) must be fully resident to ensure zero disk reads during coarse ranking; full-precision vectors are read on demand during reranking, requiring as much page cache as possible. This report is based on a fixed query set with strong locality, where reranking mostly hits page cache; before going live, validate page cache hit rates with real query distributions—otherwise reranking disk reads may become the primary bottleneck, and actual QPS degradation will be significantly worse than reported.
-
Faiss requires circuit breaker quota verification: Faiss graphs occupy off-heap memory and count toward the k-NN circuit breaker; re-evaluation is needed when data volume, replica count, or quantization parameters change—otherwise graph loading may be blocked by the circuit breaker.
-
Replicas and capacity planning: this test uses 0 replicas to isolate variables; production requires ≥1 replica for availability, and hot data and storage must scale by the replica multiplier.
-
Segment count and continuous writes: all data in this report was measured under single-segment-per-shard steady state, representing the upper bound of query performance; continuous writes produce multiple segments that increase query traversal overhead—schedule force merge during low-write periods or rely on automatic merging.
FAQ
-
Why does
ef_searchbelow 100 have no effect?1-bit quantization has a minimum reranking candidate count of 100, and the actual search breadth cannot go below this floor, so when
ef_search ≤ 100, the effect is always equivalent to 100. The parameter matrix in this test starts fromef_search=100without including lower tiers. -
Why was the 32-core 128 GiB × 2 configuration chosen?
The value of 1-bit quantization is compressing the hot data that must reside in memory. Its hot data (graph + 1-bit vectors) is only 13.5 GiB/node (Lucene, in page cache) and 21.6 GiB/node (Faiss, in off-heap memory)—a 128 GiB node can fully accommodate this with room left for full-precision reranking. Using larger-memory nodes would allow caching all full-precision vectors as well, negating the "small hot data" advantage of quantization and invalidating the test conclusions.
-
Why does 1-bit quantization require
mode: on_disk?mode: on_diskmode: on_disk enables two-stage retrieval. 1-bit quantization retains only the sign bit per dimension, causing extreme information loss; using it alone for ranking lacks sufficient precision. After coarse ranking produces candidates, full-precision raw vectors must be read for exact reranking to achieve usable recall. Without this mode, reranking is skipped and recall drops to unusable levels. -
Can the test data be extrapolated to larger scales or random query workloads?
Direct extrapolation is not recommended. Growing data scale simultaneously affects graph depth, traversal node count, and memory usage; furthermore, this test uses a fixed query set with strong locality and near-zero steady-state disk reads, whereas under random query workloads, the proportion of disk reads for full-precision reranking is higher and latency is greater. For larger-scale or random workload scenarios, validation testing with actual business data is recommended.