This topic describes how to use Prometheus to monitor ApsaraMQ for Kafka and self-managed Kafka.
Pain points of monitoring Kafka with self-managed Prometheus
When you use a self-managed Prometheus instance to monitor Kafka, you may encounter the following issues:
For security or organizational reasons, your services are often deployed in multiple isolated Virtual Private Clouds (VPCs). This requires you to deploy and maintain a separate Prometheus instance in each VPC, which increases deployment and O&M costs.
Each complete self-managed monitoring system requires you to install and configure Prometheus, Grafana, and AlertManager. This process is complex and time-consuming.
The open source Kafka JMX Agent can cause high CPU usage in some scenarios. This can interfere with your self-managed Kafka services.
A self-managed Prometheus instance cannot monitor ApsaraMQ for Kafka. This prevents you from building a centralized monitoring system with a global view.
For self-managed Kafka on Elastic Compute Service (ECS) instances, a self-managed Prometheus instance lacks a built-in service discovery mechanism that integrates with Alibaba Cloud ECS. You cannot flexibly define scrape targets based on ECS tags. To implement this feature yourself, you would need to develop Go code to call Alibaba Cloud ECS POP API operations, integrate it with the open source Prometheus code, and then compile, package, and deploy it. This approach is difficult, complex, and makes future upgrades challenging.
Common open source Grafana dashboards cannot be deeply customized based on Kafka principles and best practices.
There are no predefined alert templates for Kafka. You must configure alert rules yourself, which is time-consuming and technically difficult.
Self-managed Prometheus vs. Managed Service for Prometheus
For Kafka monitoring scenarios, a detailed comparison between self-managed Prometheus and Managed Service for Prometheus is provided below:
Comparison Item |
Self-managed Prometheus |
Managed Service for Prometheus |
Deployment and maintenance costs |
You must purchase ECS instances to deploy Prometheus, Grafana, and AlertManager in multiple VPCs. This results in high O&M costs. |
An integrated, fully managed, and out-of-the-box service that combines Managed Service for Prometheus, Grafana, and an alerting center. |
Availability, performance, and data capacity |
Low availability, low performance, and small data capacity. |
High availability, high performance, and large data capacity. |
Exporter performance |
The open source Kafka JMX Agent can cause high CPU usage in some scenarios, which can interfere with Kafka services. |
Managed Service for Prometheus continuously optimizes the Kafka JMX Agent to enhance its performance and stability. |
Service discovery |
In an ECS environment, service discovery relies on methods such as open source static_configs or third-party registries. These methods are inconvenient and have high maintenance costs. |
In addition to being compatible with open source service discovery, it has built-in aliyun_sd_configs. This lets you match target ECS instances using ECS tags, similar to using LabelSelector in Kubernetes. This greatly simplifies the configuration and maintenance of service discovery. |
Grafana dashboards |
Open source Grafana dashboards for Kafka are often basic. They typically display only the collected metrics and lack deep optimizations based on Kafka principles and best practices. |
Provides professional Kafka dashboard templates. This helps you quickly and accurately understand the end-to-end status of your Kafka service and troubleshoot issues. |
Alerting rules |
Lacks Kafka alert metric templates. You must research and configure alert rules yourself. |
Provides professional and flexible alert metric templates based on Kafka monitoring best practices. You can configure alert rules through a simple user interface. |
Centralized, global view |
Because you may have multiple Prometheus setups and a self-managed Prometheus instance cannot monitor ApsaraMQ for Kafka, you cannot achieve a centralized monitoring system with a global view. |
Managed Service for Prometheus is a fully managed service, and Kafka provides built-in integration with Managed Service for Prometheus, which natively provides a unified monitoring system. |
Monitor ApsaraMQ for Kafka using Prometheus
Alibaba Cloud Kafka is integrated with Managed Service for Prometheus by default, providing monitoring for the following main metrics:
Traffic metrics at the instance, Group, and Topic levels.
Message accumulation metrics for Groups and Topics.
Disk usage metrics for instances.
Rebalancing metrics for Groups.
View ApsaraMQ for Kafka monitoring dashboards
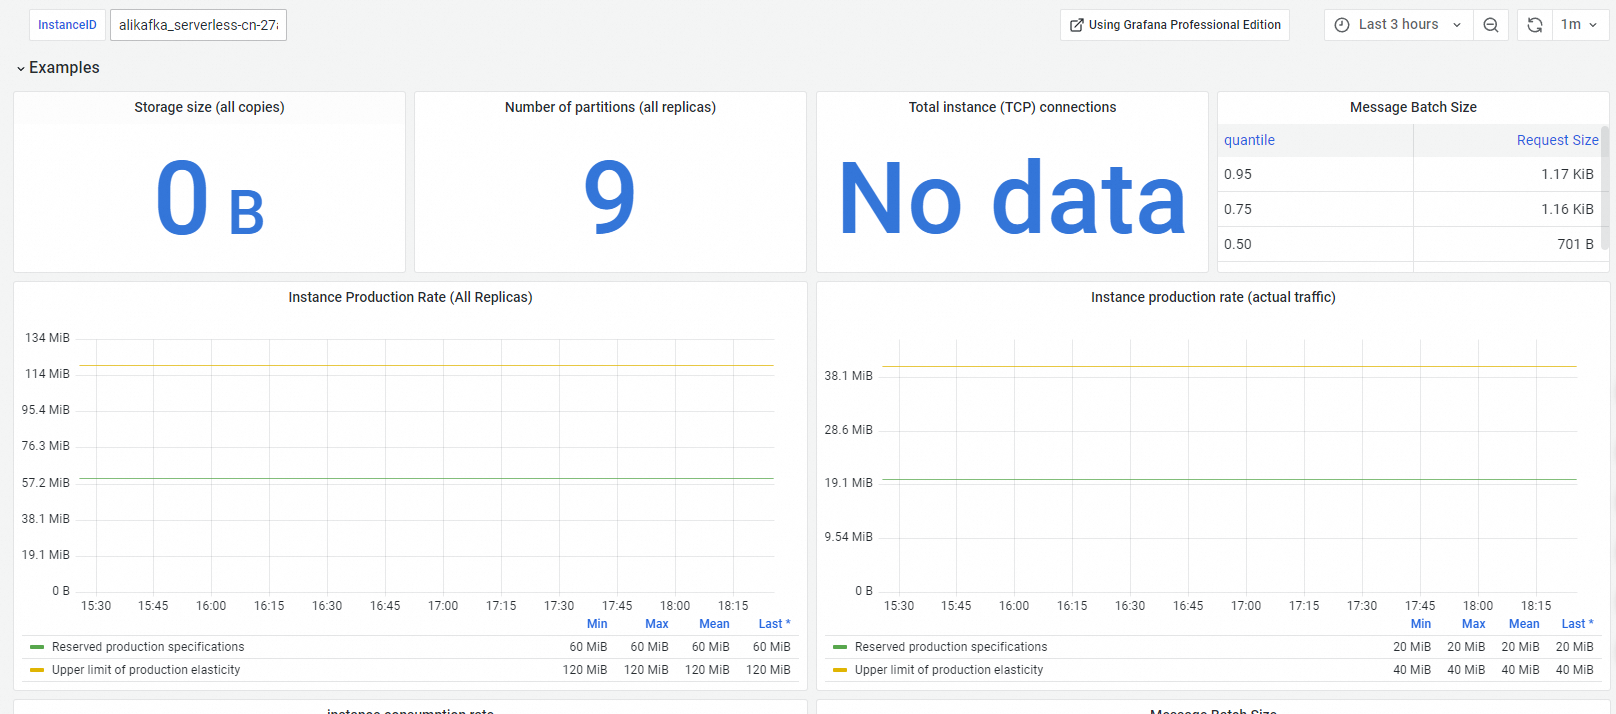
ApsaraMQ for Kafka provides three monitoring dashboards: instance, Group, and Topic. These dashboards help you understand the status of message production and consumption in real time and quickly identify issues.
Alibaba Cloud Kafka Instance Monitoring Dashboard
Log on to the ApsaraMQ for Kafka console. In the left-side navigation pane, click Instances.
Click the name of the target instance. In the navigation pane on the left, click Prometheus Monitoring to view the instance monitoring dashboard.
Alibaba Cloud Kafka Consumer Group Monitoring Dashboard
Log on to the ApsaraMQ for Kafka console. In the left-side navigation pane, click Instances.
Click the name of the target instance. In the navigation pane on the left, click Group Management. Click the hyperlink of the target Group ID, and then click the Prometheus Monitoring tab to view the consumer group monitoring dashboard.
Alibaba Cloud Kafka Topic Monitoring Dashboard
Log on to the ApsaraMQ for Kafka console. In the left-side navigation pane, click Instances.
Click the name of the target instance. In the navigation pane on the left, click Topic Management. Click the hyperlink of the target Topic name, and then click the Prometheus Monitoring tab to view the Topic monitoring dashboard.
Use Managed Service for Prometheus to configure Alibaba Cloud Kafka alerts
-
Log on to the Cloud Monitor console.
-
In the navigation pane on the left, choose to open the instance list for Managed Service for Prometheus.
Click the name of the Managed Service for Prometheus instance instance that you want to manage to go to the Integration Center page.
Click the Message Queue for Kafka card in the Installed area. In the panel that appears, click the Alerts tab to view the Prometheus alerts for Alibaba Cloud Kafka. Managed Service for Prometheus provides key alert metrics for instances, groups, and topics. You can also add new alert rules as needed. For more information about how to create Prometheus alert rules, see Create a Prometheus alert rule.
Monitor self-managed Kafka using Prometheus
In addition to Alibaba Cloud Kafka, Managed Service for Prometheus provides the capability to monitor self-managed Kafka. This feature supports Kafka monitoring in two types of environments: container services (such as ACK, ASK, and registered clusters) and ECS. Kafka monitoring can collect basic metrics, such as the number of brokers, topic partitions, and consumer group lag. In addition, the Kafka server-side does not require any configuration or restarts.
Unlike monitoring ApsaraMQ for Kafka, when you monitor self-managed Kafka, you must pay attention to both routine usage metrics and internal O&M metrics.
Deploy infrastructure monitoring for self-managed Kafka
-
Log on to the Cloud Monitor console.
In the navigation pane on the left, click Integration Center. On the page that appears, click the Kafka card.
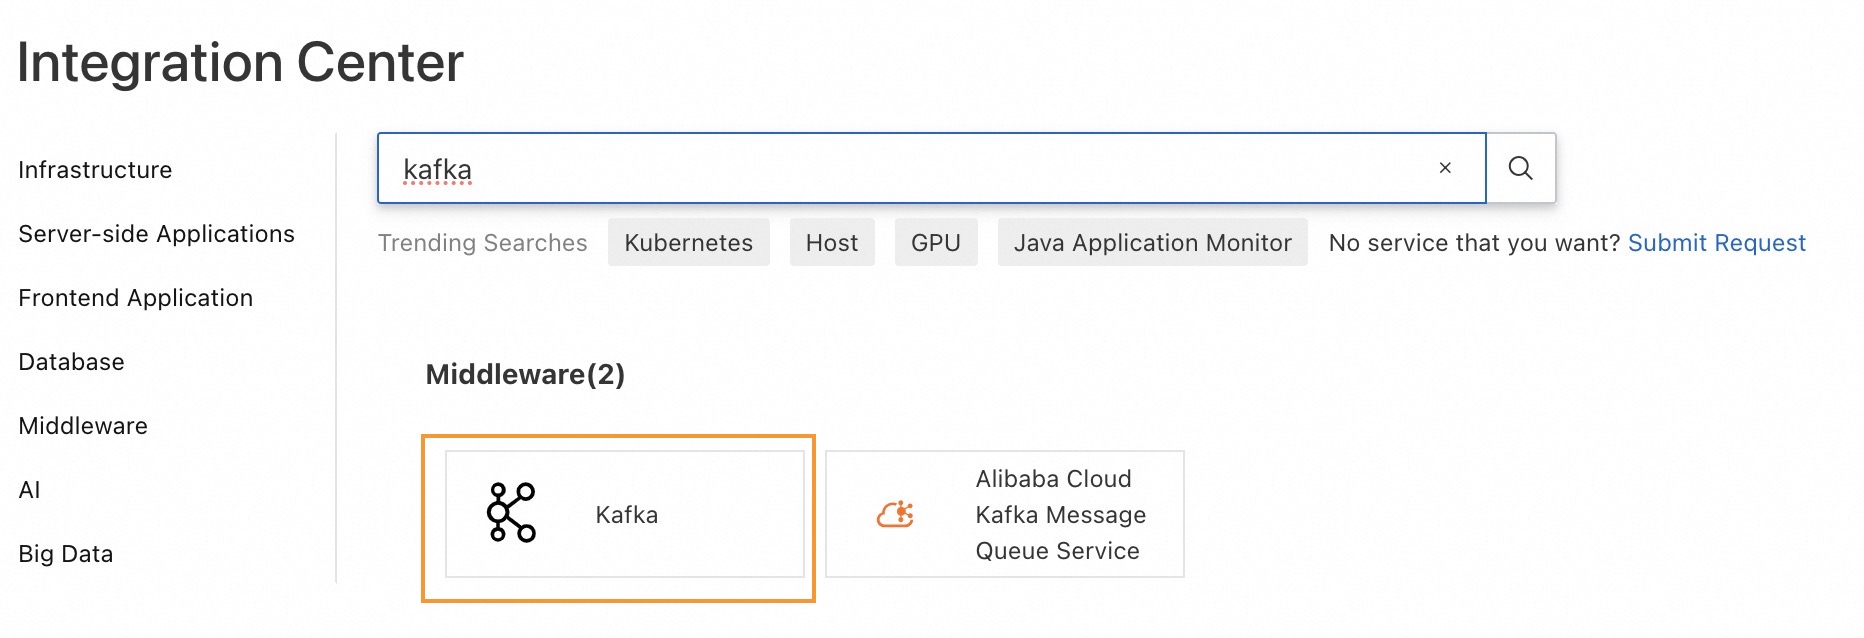
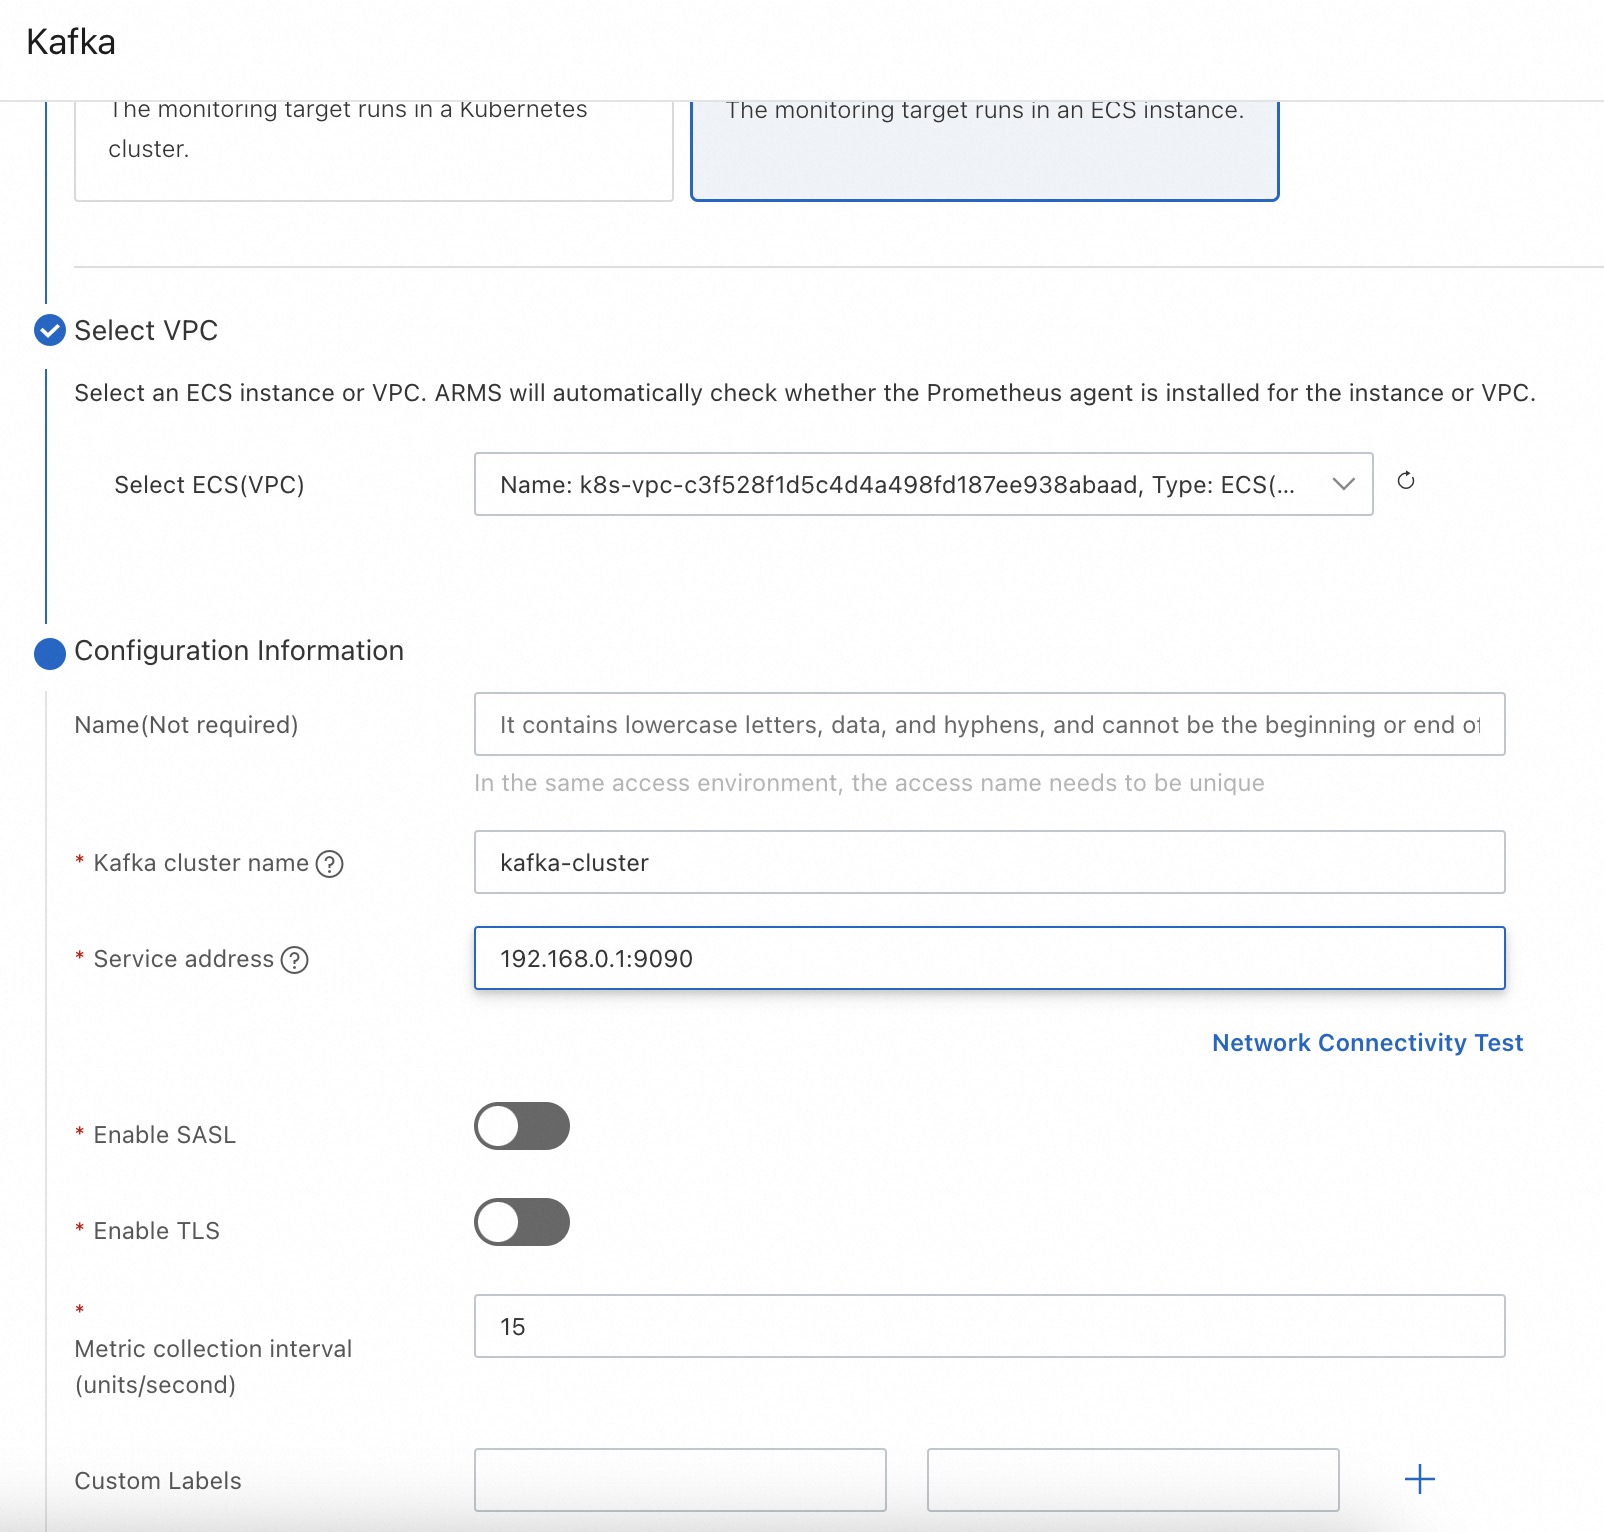
Configure the integration parameters as prompted and click OK. The following tables describe the main parameters.
Container service environment
Parameter
Description
Pod Selector Label
When you deploy the JMX Agent, Managed Service for Prometheus uses the labels and tag values configured for the pod to perform service discovery. For more information, see How to deploy and configure the Kafka JMX Agent.
Metric Scrape Interval
The interval at which monitoring data is collected.

ECS (VPC)
Parameter
Description
Kafka Cluster Name
Use a unique cluster name for each integration to prevent duplicate metric collection, which can cause dashboard display errors.
Endpoint
The connection addresses of the Kafka brokers. You can use IP addresses or DNS names. Separate multiple broker addresses with commas (,) or semicolons (;).
Enable SASL
Specifies whether the Kafka server-side uses SASL.
Enable TLS
Specifies whether the Kafka server-side uses TLS.
Metric Scrape Interval (Seconds)
The interval at which monitoring data is collected.
View the infrastructure monitoring dashboard for self-managed Kafka
-
Log on to the Cloud Monitor console.
-
In the navigation pane on the left, choose to open the instance list for Managed Service for Prometheus.
Click the name of the Managed Service for Prometheus instance instance that you want to manage to go to the Integration Center page.
Click the Kafka card in the Installed section. On the panel that appears, click the Dashboards tab, and then click a dashboard thumbnail to view the corresponding Grafana dashboard.
The Kafka monitoring dashboard displays the following information, as shown in the following figure:
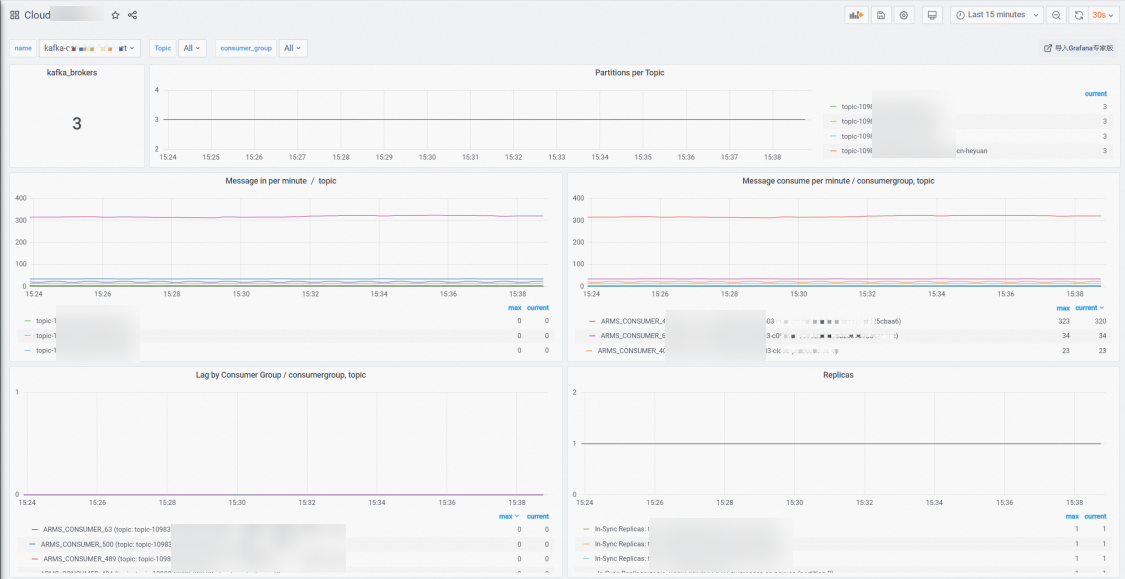
Number of Kafka brokers.
Number of partitions for each Topic.
Number of incoming, outgoing, and accumulated messages for each Topic.
Number of in-sync replicas (ISRs) for each Topic.
Configure infrastructure monitoring alerts for self-managed Kafka
On the Integration Center page of the Managed Service for Prometheus console, click the Kafka card in the Installed area, and in the panel that appears, click the Alerts tab to view the Prometheus alerts for Kafka.
Managed Service for Prometheus provides four key alert metrics: a decrease in the number of active brokers (3 minutes), under-replicated partitions, an excessive number of partitions, and message accumulation in consumer topics. You can also add alert rules based on your business needs. For more information about how to create Prometheus alert rules, see Create Prometheus alert rules.