Monitoring Windows with Prometheus
This topic describes how to monitor Windows using Managed Service for Prometheus.
Step 1: Install Windows exporter (optional)
There are two methods to deploy the exporter to Collection Windows metrics. If you choose Automatic Installation, you can skip this step.
-
Automatic installation: The service automatically discovers ECS instances based on the filter policy that you provide and installs the Windows Exporter service on the discovered hosts.
-
Manual installation: You must install the Windows Exporter service on the ECS host and open the corresponding port for access within the VPC before integration.
-
Download Windows Exporter: Log on to your Windows system as an administrator and download the Windows Exporter package to the ECS instance.
-
Install Windows Exporter: Double-click the
windows_exporter-1.22.0-amd64.msiinstallation package downloaded in the previous step, or run the commandmsiexec /i windows_exporter-1.22.0-amd64.msito complete the installation.-
By default, the exporter is installed in the
C:\Program Files (x86)\windows_exporterdirectory. -
The default listening port is 9182.
-
By default, the following collectors are enabled:
cpu,cpu_info,memory,process,tcp,cs,logical_disk,net,os,system,textfile, andtime.
-
After the installation is complete, you can find the service in the Windows Services console.
-
-
Verify that the exporter is working correctly: Run the command
curl localhost:{listening_port}/metricsor openhttp://localhost:{listening_port}/metricsin a browser. The exporter is working correctly if Prometheus metrics are returned. -
Modify the configuration file: You can modify the configuration file to change the port or add or remove collectors. For more information, see the official Windows Exporter documentation. After modifying the configuration file, you must restart the
windows_exporterservice by running the commandsc stop windows_exporter && sc start windows_exporteror by using the Windows Services console.
Step 2: Integrate Windows
-
Log on to the Managed Service for Prometheus console. In the navigation pane on the left, click Integration Center, then search for and click Windows.
-
On the Start Integration tab, configure the parameters and click OK.
Parameter
Note
Select the environment type.
The environment where your hosts are running.
-
ECS (VPC)
Windows exporter installation method
The method for installing Windows exporter.
-
Automatic installation
-
Manual installation
Host service discovery method
The method for discovering hosts to monitor.
-
Unconditional (Selects all Windows instances in the current VPC)
-
Selection by taint tag
-
Selection by tag
-
IP CIDR
-
Instance ID
Collect textfile
Enter the absolute path of the directory that stores text files. The path does not support environment variables. Example: /home/app/textfiles.
Windows exporter service port
The port of the exporter service. The default port is auto-populated.
Automatically configure security group
If enabled, the system automatically adds a security group rule to the target ECS host if required for integration.
Custom ECS tag injection
Specifies ECS tag keys. The key-value pairs of the specified tags are automatically added to Prometheus metrics as labels.
Scrape interval (seconds)
The interval at which Managed Service for Prometheus scrapes metric data. The default is 15 seconds.
-
Step 3: View Windows dashboards
-
Log on to the Managed Service for Prometheus console. In the navigation pane on the left, click Integration Management. On the Integration Management page, click the Integrated Environments tab. In the environment list, click the name of your target environment to view its details page.
The Integrated Environments tab has three subtabs: Container Environment, ECS Environment, and Cloud Service Environment. Click the subtab for your environment type, and then click the name of the target environment.
-
On the Component Management tab, under Component Type, click Windows and then click Dashboards to view the available dashboard names.
The dashboard list includes Windows Details, Windows Process, and Windows TopN.
-
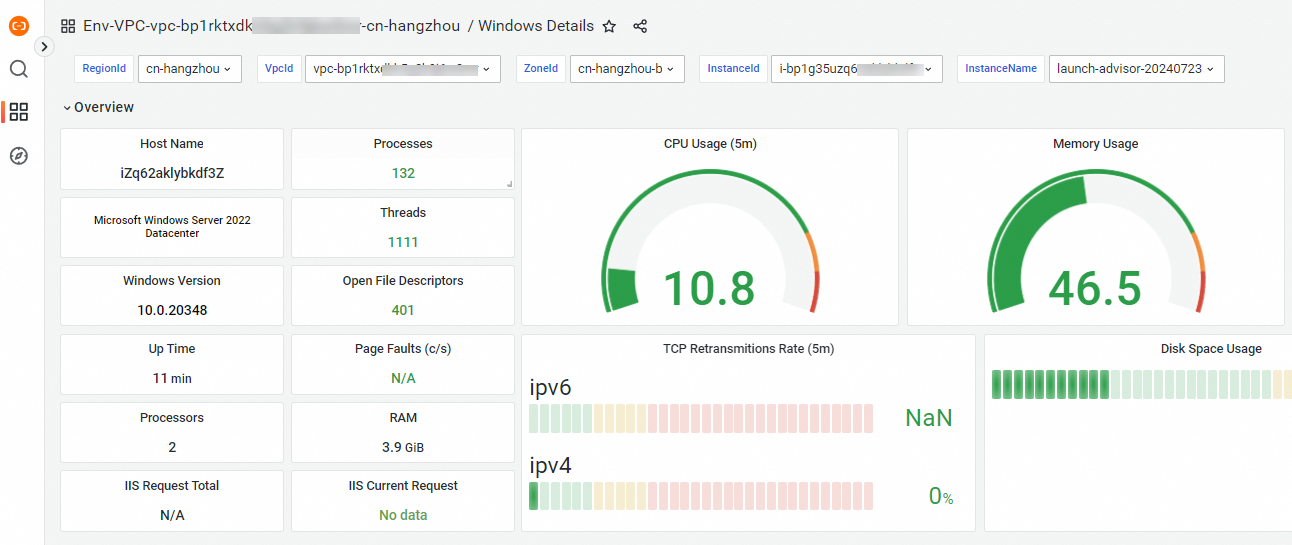
Click a dashboard name to view its Grafana dashboard.
Step 4: Configure Windows alerting
For details on how to create a Prometheus alert rule, see Create an alert rule for a Prometheus instance.