Quick BI allows you to embed reports, such as dashboards and spreadsheets, from a workspace into third-party systems. This integration helps you create a unified business application. This topic describes how to embed a report using the basic solution, available for Quick BI Advanced Edition and Professional Edition.
Limitations
The basic solution supports embedding only dashboards and spreadsheets.
For users who need to embed spreadsheet data entry pages into a third-party environment: Data submission may fail. Some system browsers, such as the built-in browser of Enterprise WeChat on iOS, prevent cross-domain iframes from writing cookies, which causes data submission to fail on complex spreadsheet data entry pages.
Therefore, we recommend that you use the spreadsheet data entry feature directly on the Quick BI platform.
Background information
To integrate Quick BI reports into your system, configure the report embedding feature.
When you use Quick BI Advanced Edition, embedded reports do not support differentiated data permissions. The row-level security feature does not apply to embedded reports, so all viewers have the same data permissions as the report author. The enhanced solution for embedding is not supported.
When you use Quick BI Professional Edition, embedded reports support differentiated data permissions. This means different users can view different data within the same report. This edition also supports the enhanced solution for embedding. For more information, see Enhanced security solution for data permission control and parameter passing in embedded reports.
Step 1: Enable embedding for a report
You can enable embedding only for reports that are in the Published state.
You can enable report embedding from the Open Platform module:
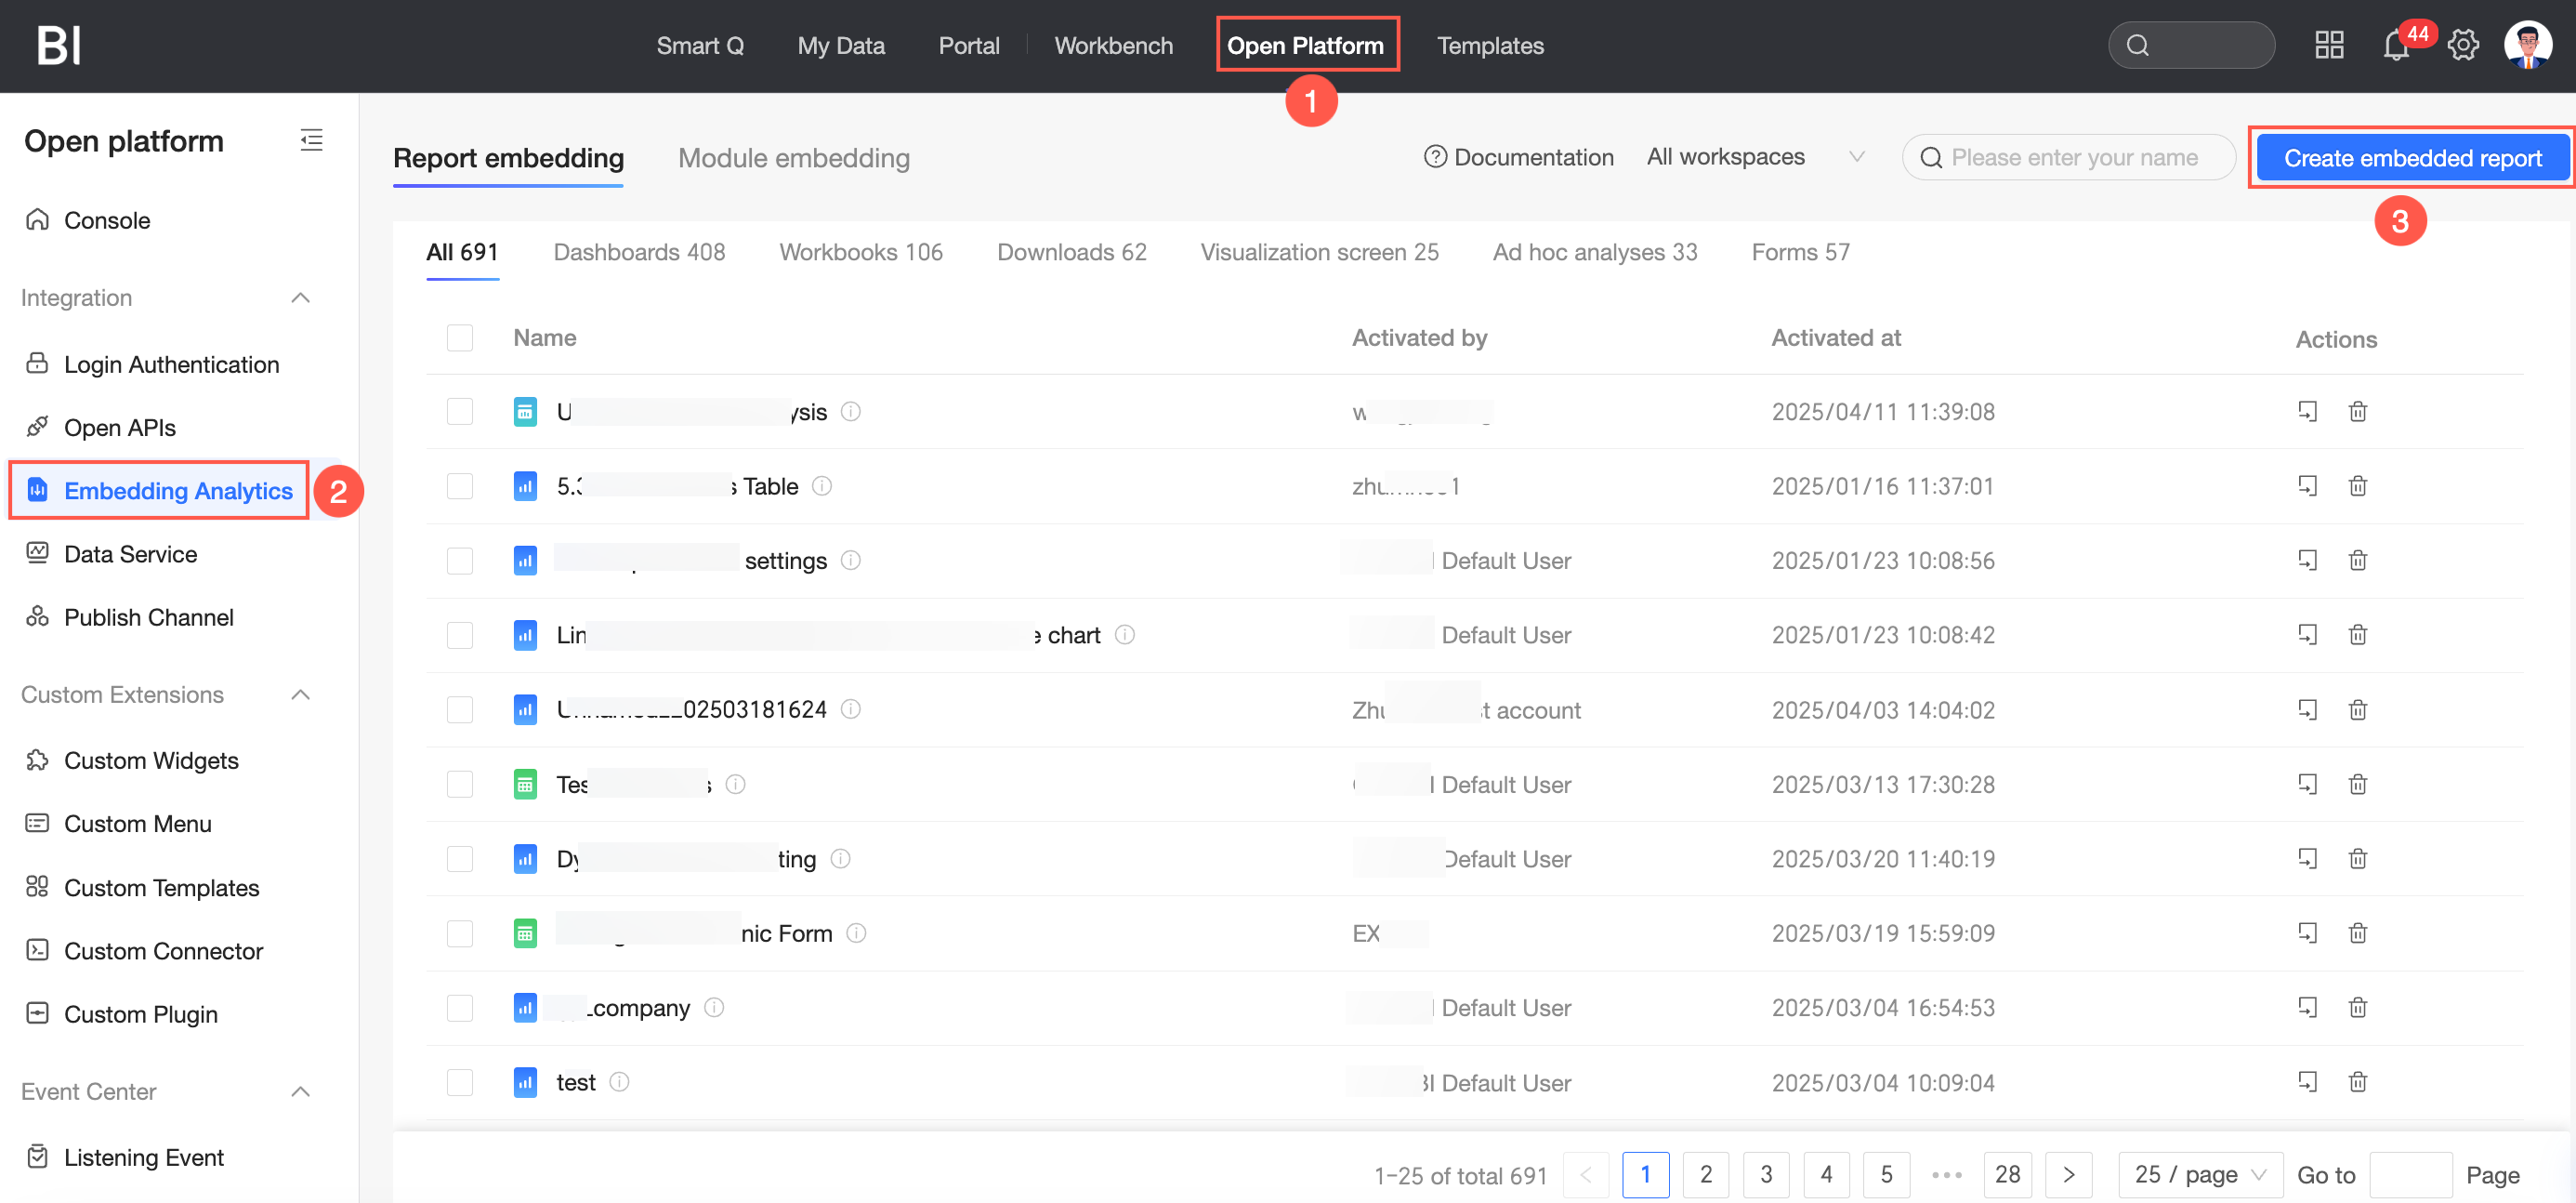
On the Quick BI homepage, navigate to the report embedding page as shown in the figure.
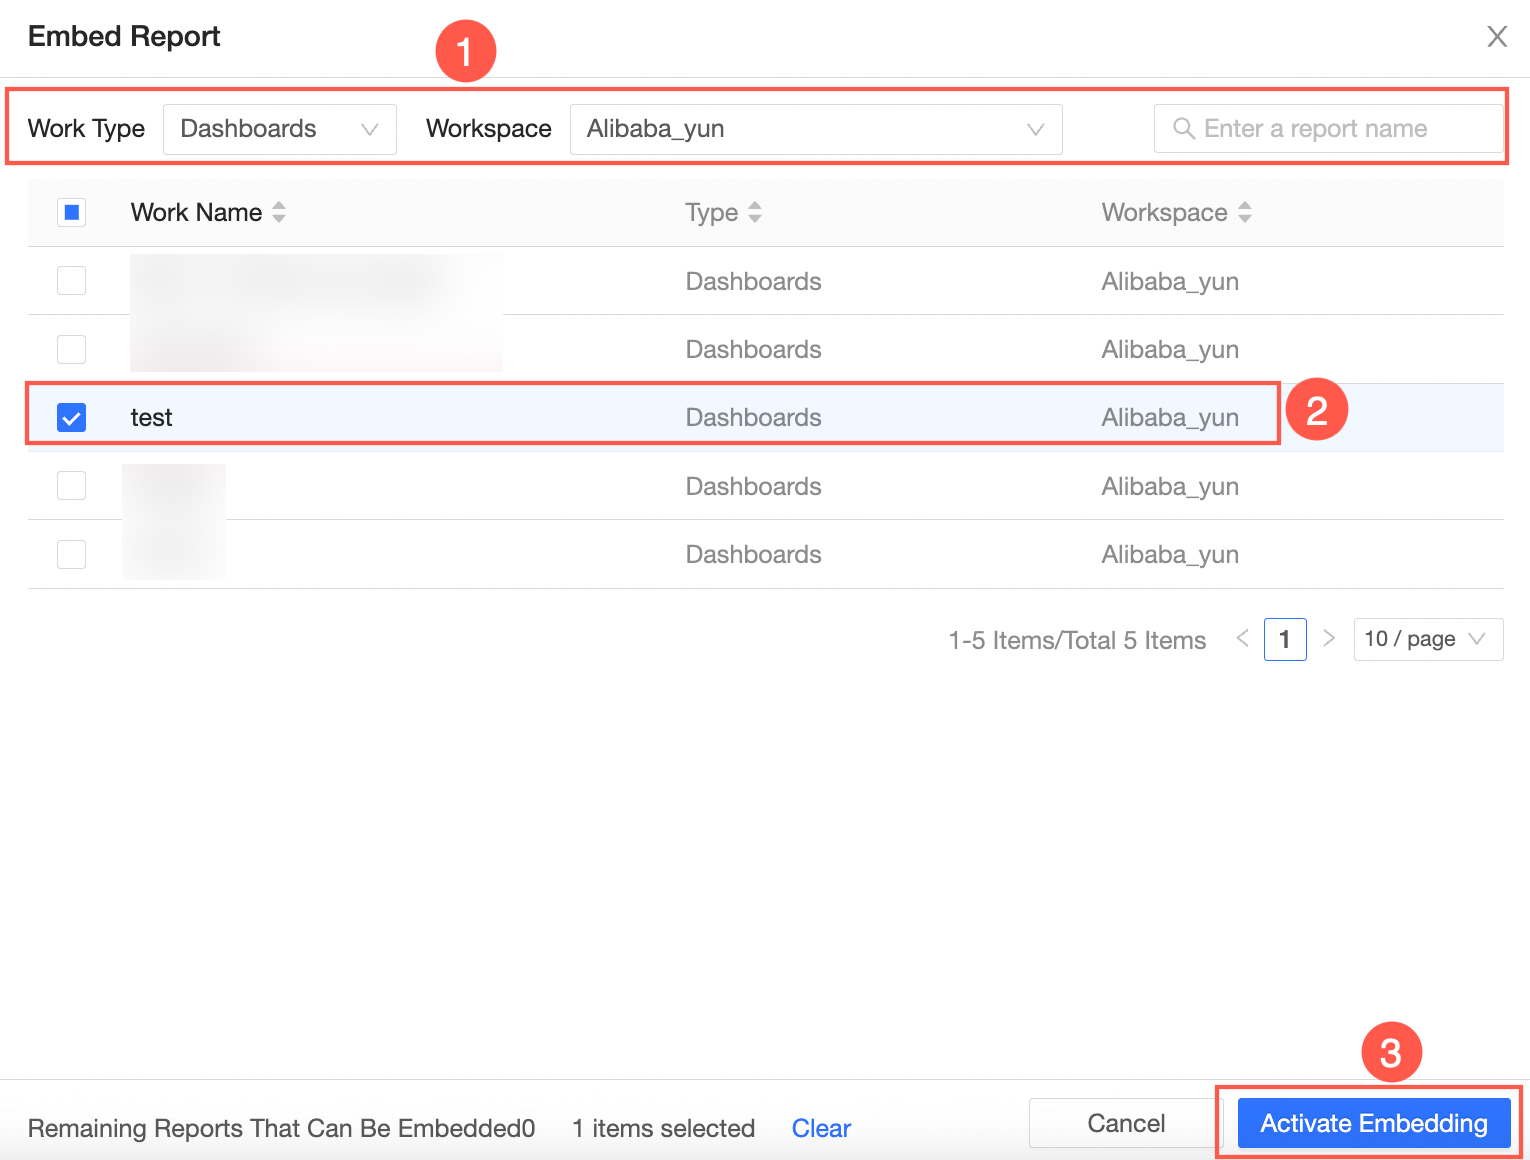
On the Add Embedded Report page, select the target workspace and data object type. From the list, select the data object name and click Enable Embedding. If you have many reports, you can search for a report by its name.
 Note
NoteFor users who need to embed spreadsheet data entry pages into a third-party environment: Data submission may fail because some system browsers prevent cross-domain iframes from writing cookies. Therefore, we recommend that you use the spreadsheet data entry feature directly on the Quick BI platform.
Configure embedding.
The debugging feature in Report Embedding Configuration is only for the enhanced solution.
ImportantThe debugging feature is for testing purposes only. For actual implementation, you must complete Step 2: Obtain an accessTicket and Step 3: Construct the SSO URL.
After you enable embedding for a report, the basic solution and enhanced solution offer different features. See the table below for details:
Feature
Basic solution
Enhanced solution
Bound user
Report owner (cannot be changed)
Customizable, allowing for per-user data views
Access count
Up to 100,000 views per ticket
Unlimited, with customizable settings
Watermark
Not supported
Supported
Data screens do not support watermarks.
Validity period
Up to 240 minutes
Customizable
Global parameters
Not supported
Supported
Block embedding
Not supported
Supported
Number of jumps
NoteEmbedding must also be enabled for the destination report.
Only one jump is allowed
For example, if you jump from Report A to Report B, you cannot jump from Report B to Report C.
Unlimited jumps are supported
For example, if you jump from Report A to Report B, you can then jump from Report B to Report C, and so on.
Step 2: Obtain an accessTicket
This section uses embedding a dashboard as an example.
An account with Developer or Analyst permissions can only enable embedding for dashboards it created.
An account with Admin permissions can enable embedding for all reports in the workspace.
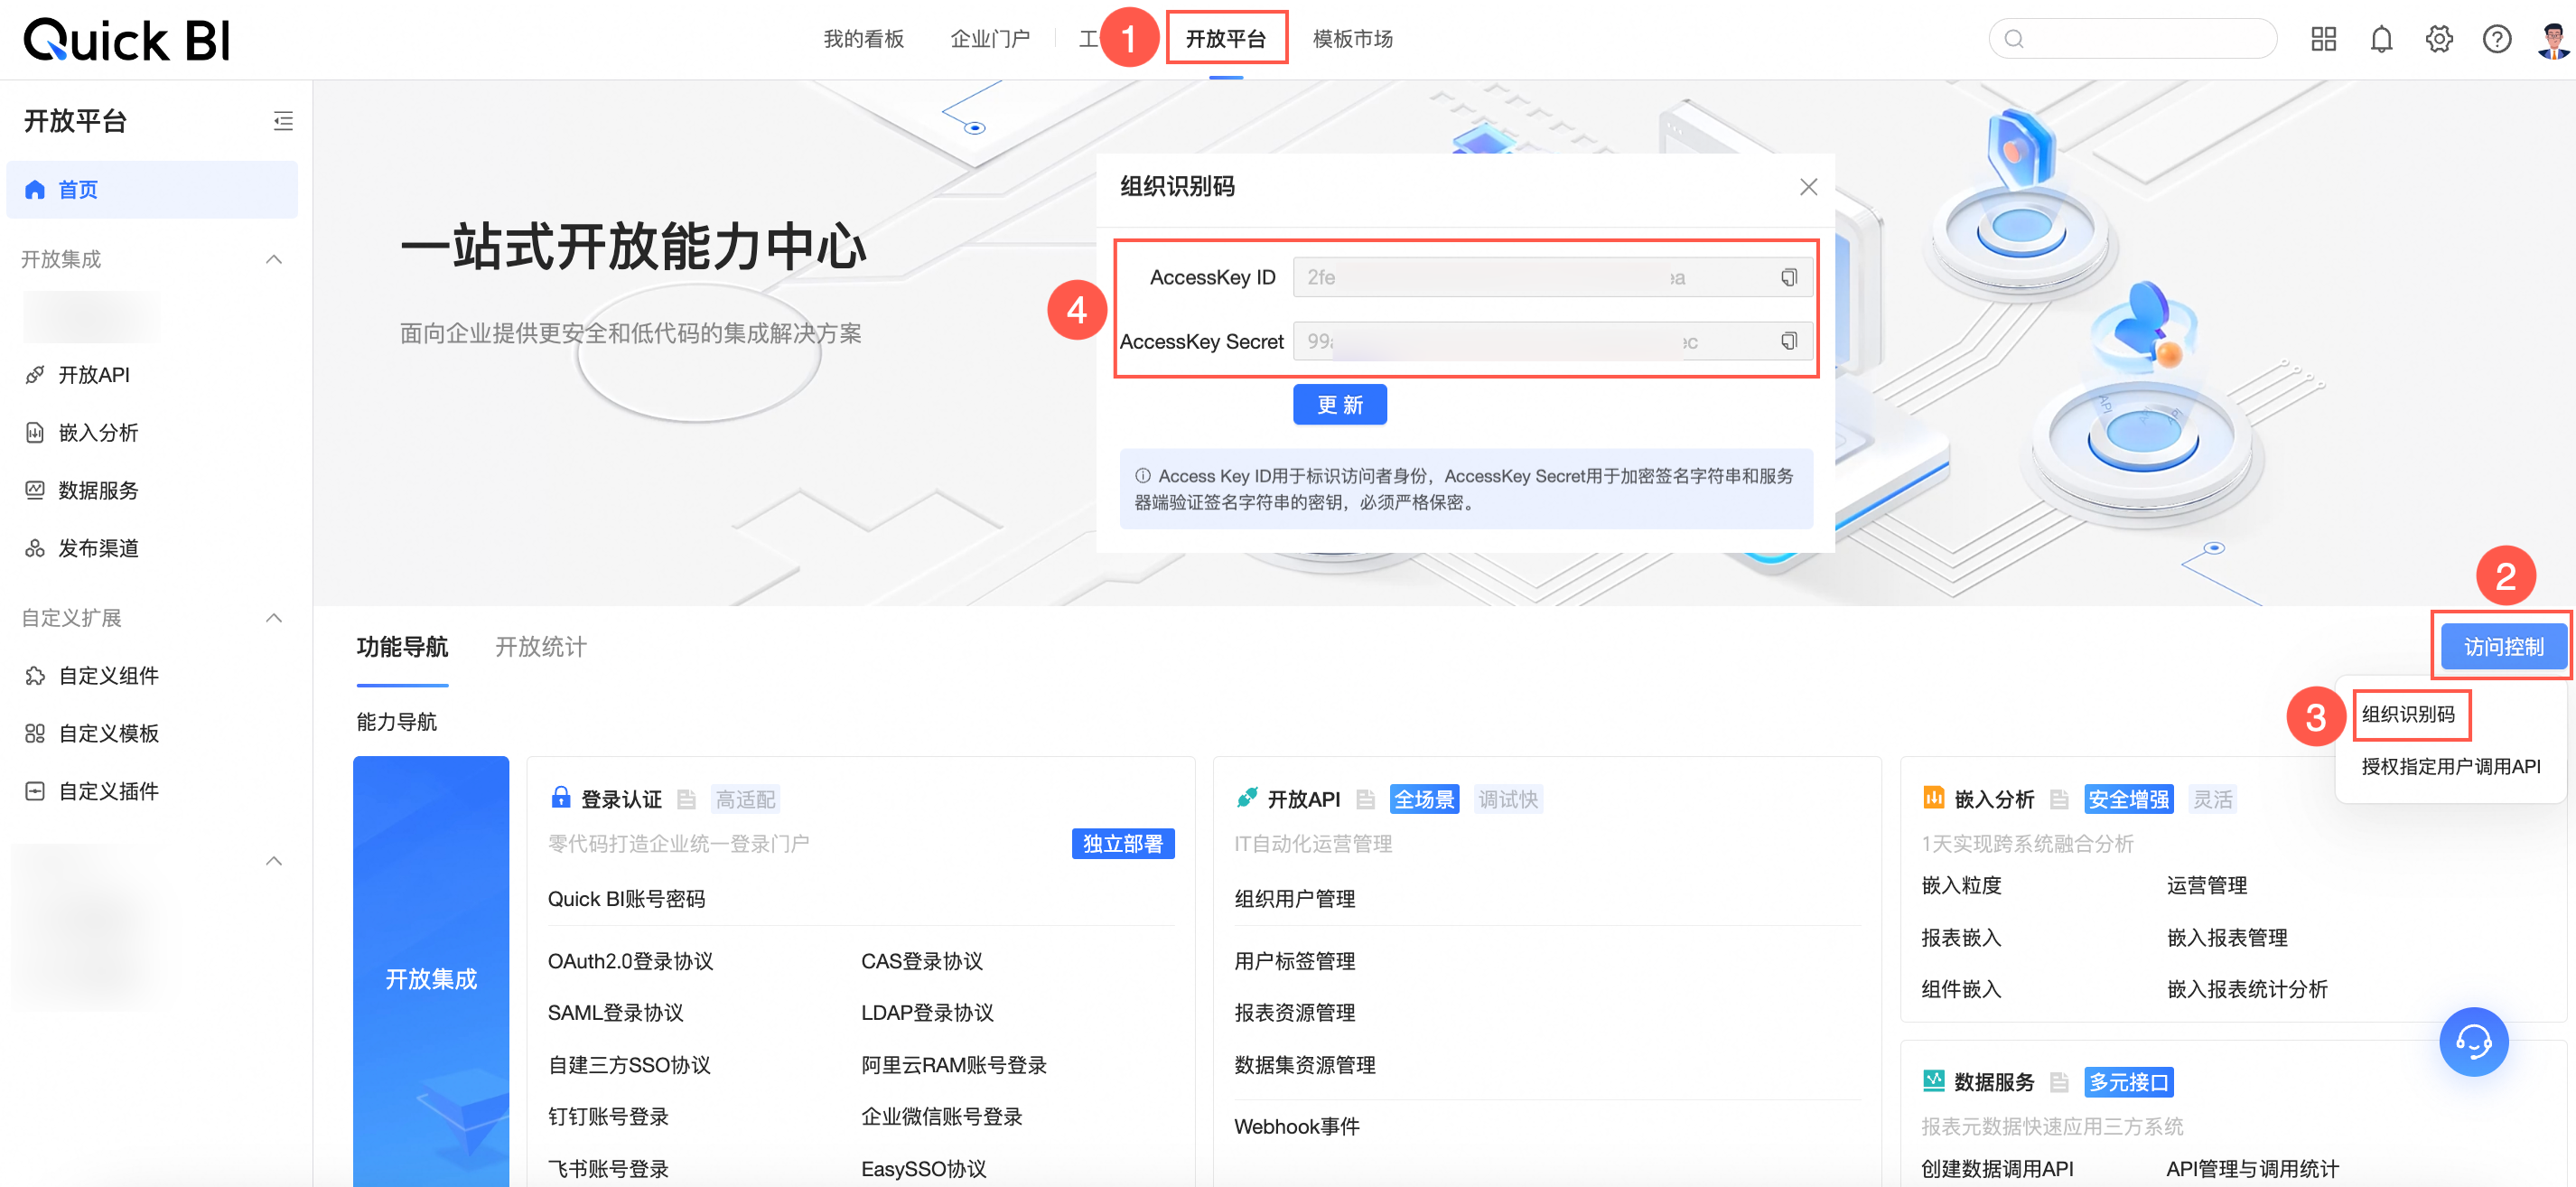
Obtain an AccessKey ID (accessId) and an AccessKey Secret (accessKey).
Log on to the Quick BI console.
On the Quick BI homepage, obtain the AccessKey ID and AccessKey Secret as shown in the figure.
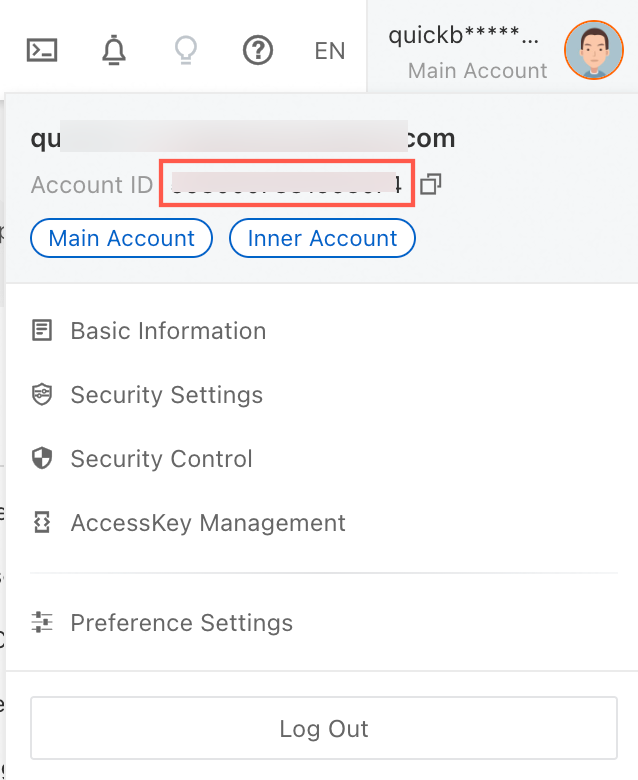
Obtain the Alibaba Cloud account ID (aliyunUid).
Log on to your Alibaba Cloud account and click your avatar in the upper-right corner to view your account ID.
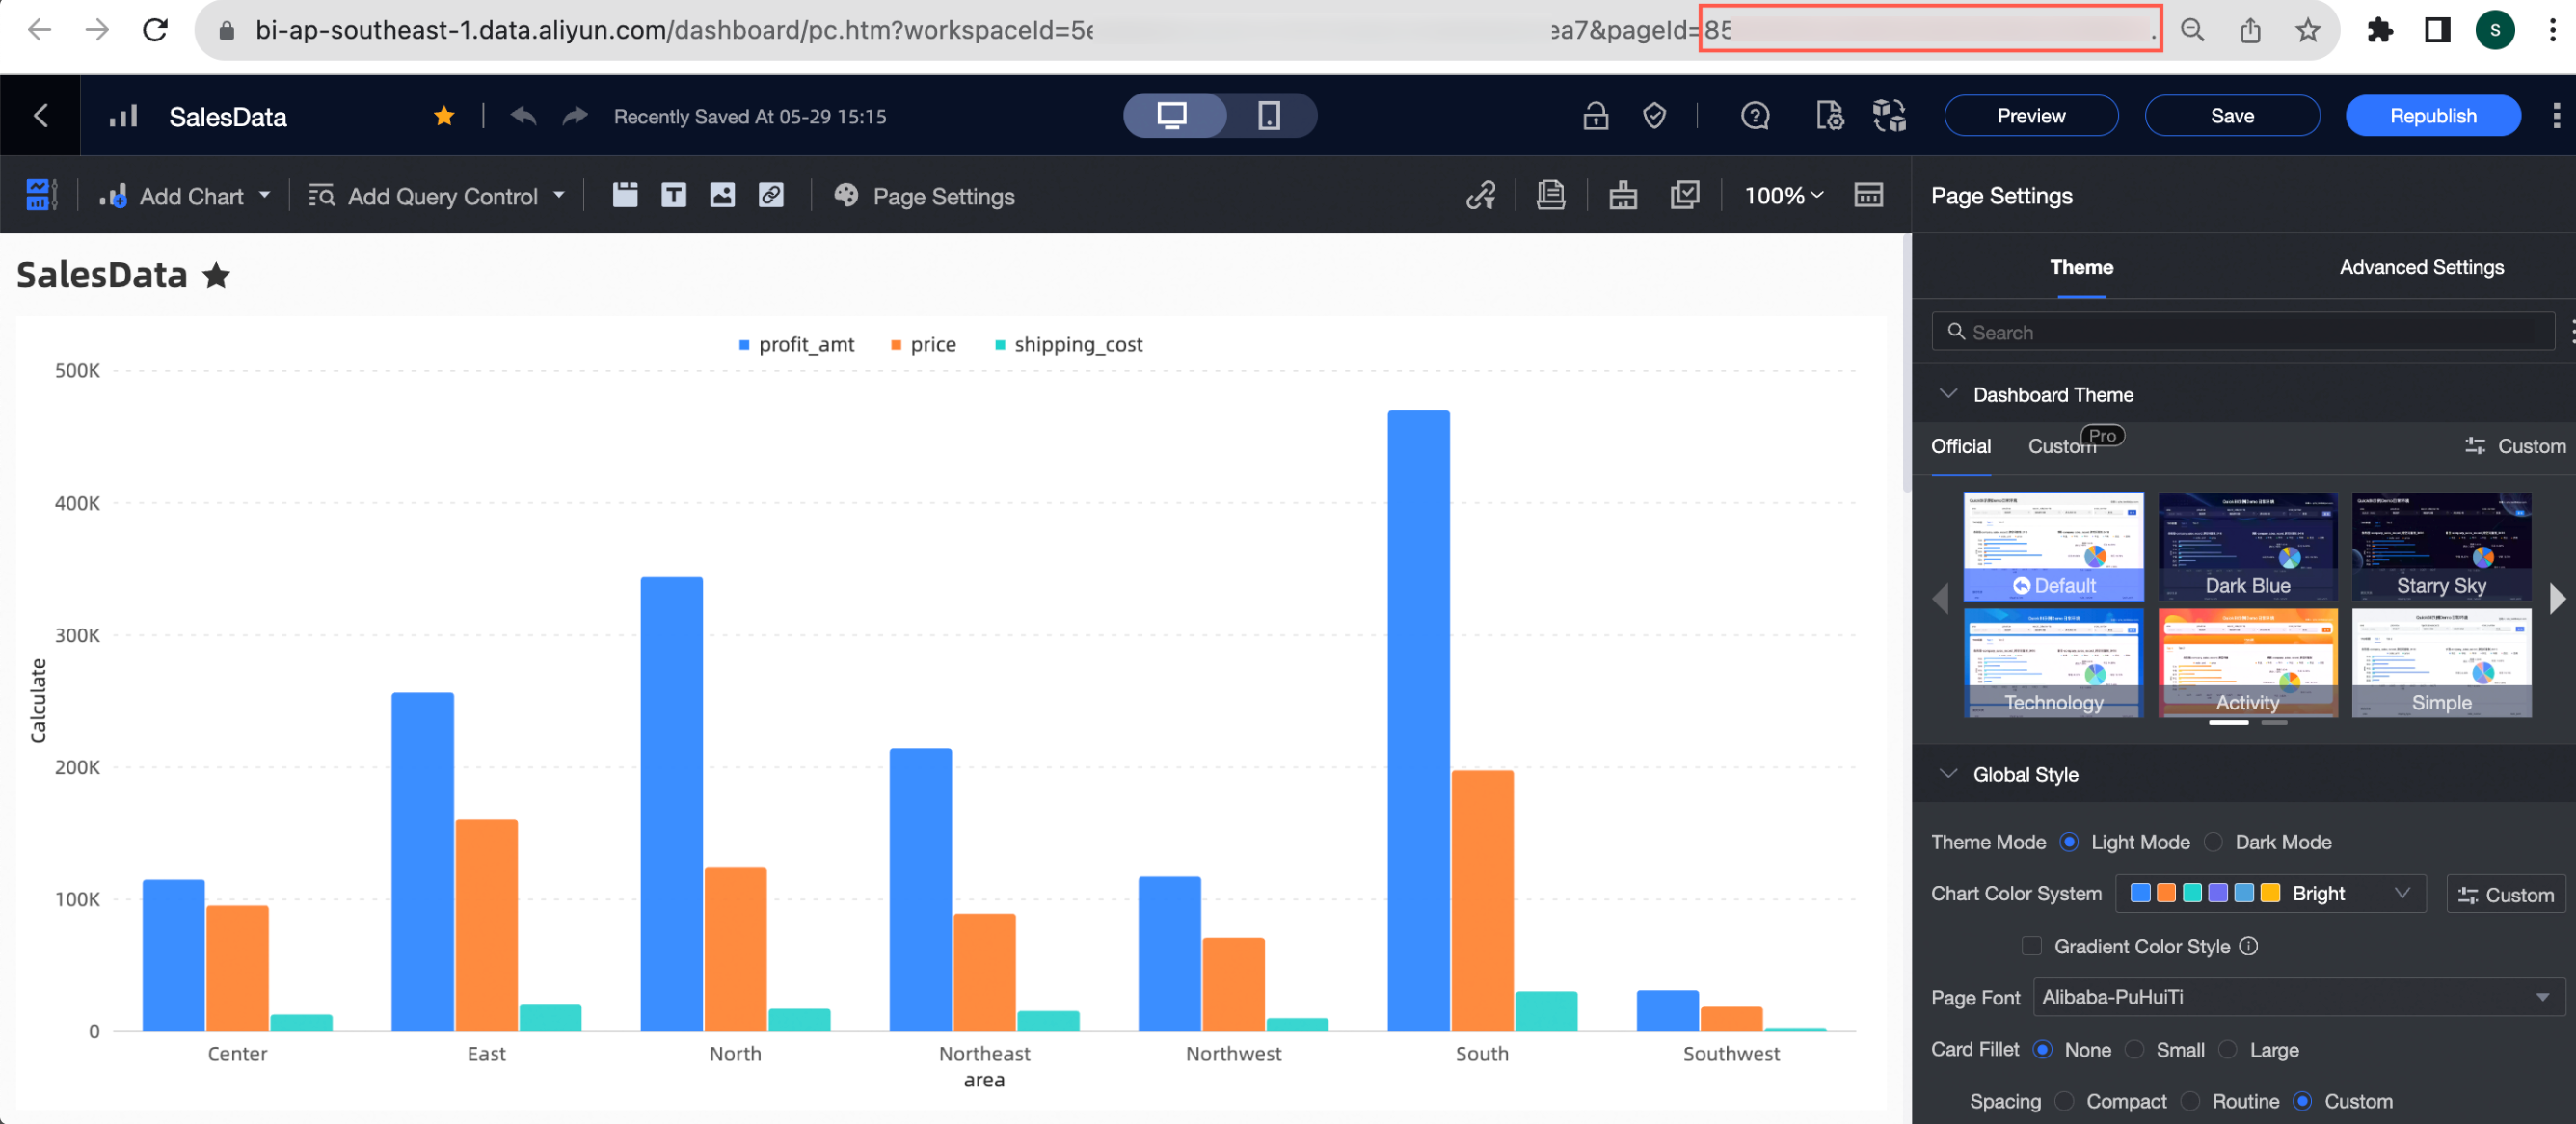
Obtain the report ID (worksId) from the report editing page:
Obtain the
accessTicket.To obtain the
accessTicket, send a GET request to the following URL with theaccessId,accessKey,aliyunUid, andworksIdyou collected.https://bi.aliyun.com/openapi/ac3rd/ticket/create?worksId=xx&aliyunUid=xx&accessKey=xx&accessId=xx&validityTime=xxNoteThe following restrictions apply to the account used to obtain the accessTicket:
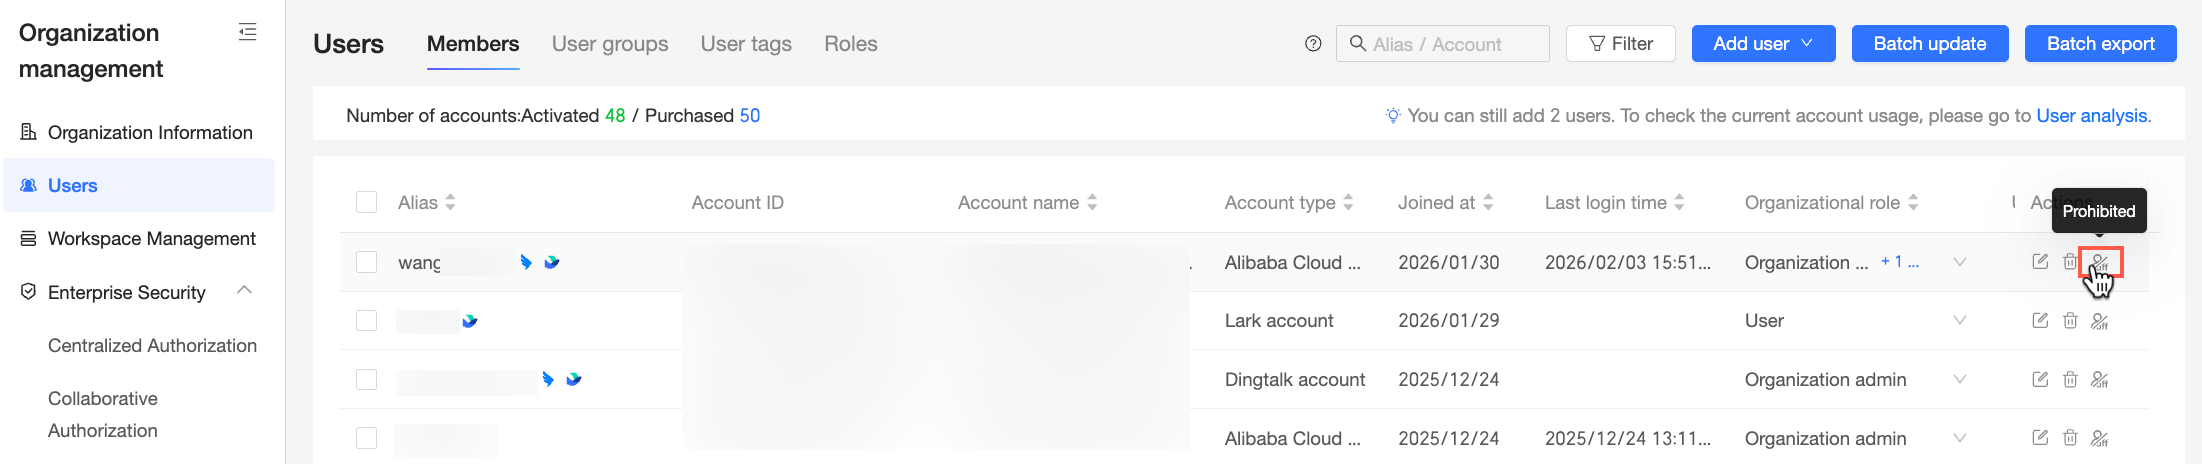
If the account is Disabled in Organization Management > User Management, you cannot generate new accessTickets. However, previously generated tickets remain valid.

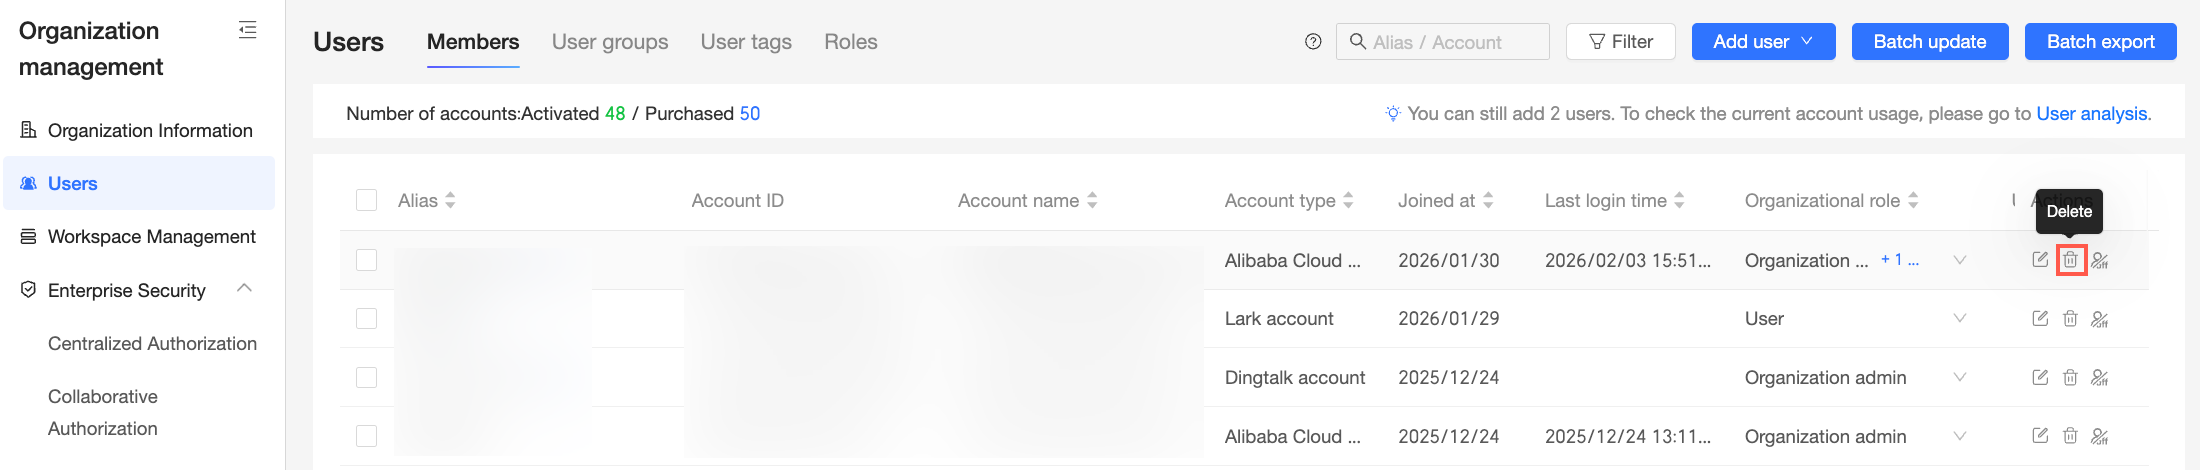
If the account is deleted in Organization Management > User Management, you cannot generate new accessTickets, and previously generated tickets are invalidated.
The
aliyunUidis used only to verify the user's edit permissions for the report when generating the accessTicket. It is not used for identity binding in third-party embedded reports.The
validityTimeparameter is optional. Its value can range from 1 to 240. The default value is 240. The value is in minutes.To invalidate an
accessTicketimmediately, send a POST request with the correspondingaliyunUid,accessId,accessKey, andaccessTicketvalues.https://bi.aliyun.com/openapi/ac3rd/ticket/invalid?aliyunUid=xx&accessId=xx&accessKey=xx&accessTicket=xx
Step 3: Construct the SSO URL
This solution does not support user-specific authentication. The embedded report inherits the permissions of the report owner by default.
The following table shows the process and examples.
Process | Dashboard example | Spreadsheet example |
|
| |
|
| |
|
| |
|
|
The following are the URL formats and examples.
Format for dashboards:
https://<Quick BI domain>/<report preview URL>?pageId=<report ID>&accessTicket=<AccessTicket>. Example URL:https://bi.aliyun.com/token3rd/dashboard/view/pc.htm?pageId=dd0****83f&accessTicket=fd138bcb-****-4fde-b413-81bcee59bdb6Format for spreadsheets:
https://<Quick BI domain>/<report preview URL>?id=<report ID>&accessTicket=<AccessTicket>. Example URL:https://bi.aliyun.com/token3rd/report/view.htm?id=42****18ef6&accessTicket=fd138bcb-****-4fde-b413-81bcee59bdb6
Get the Quick BI domain name.
For example, the Quick BI public cloud domain is
bi.aliyun.com. Use the domain name specific to your environment.Get the report preview URL.
The preview page URLs for different report types are as follows:
Dashboard:
token3rd/dashboard/view/pc.htmSpreadsheet:
token3rd/report/view.htm
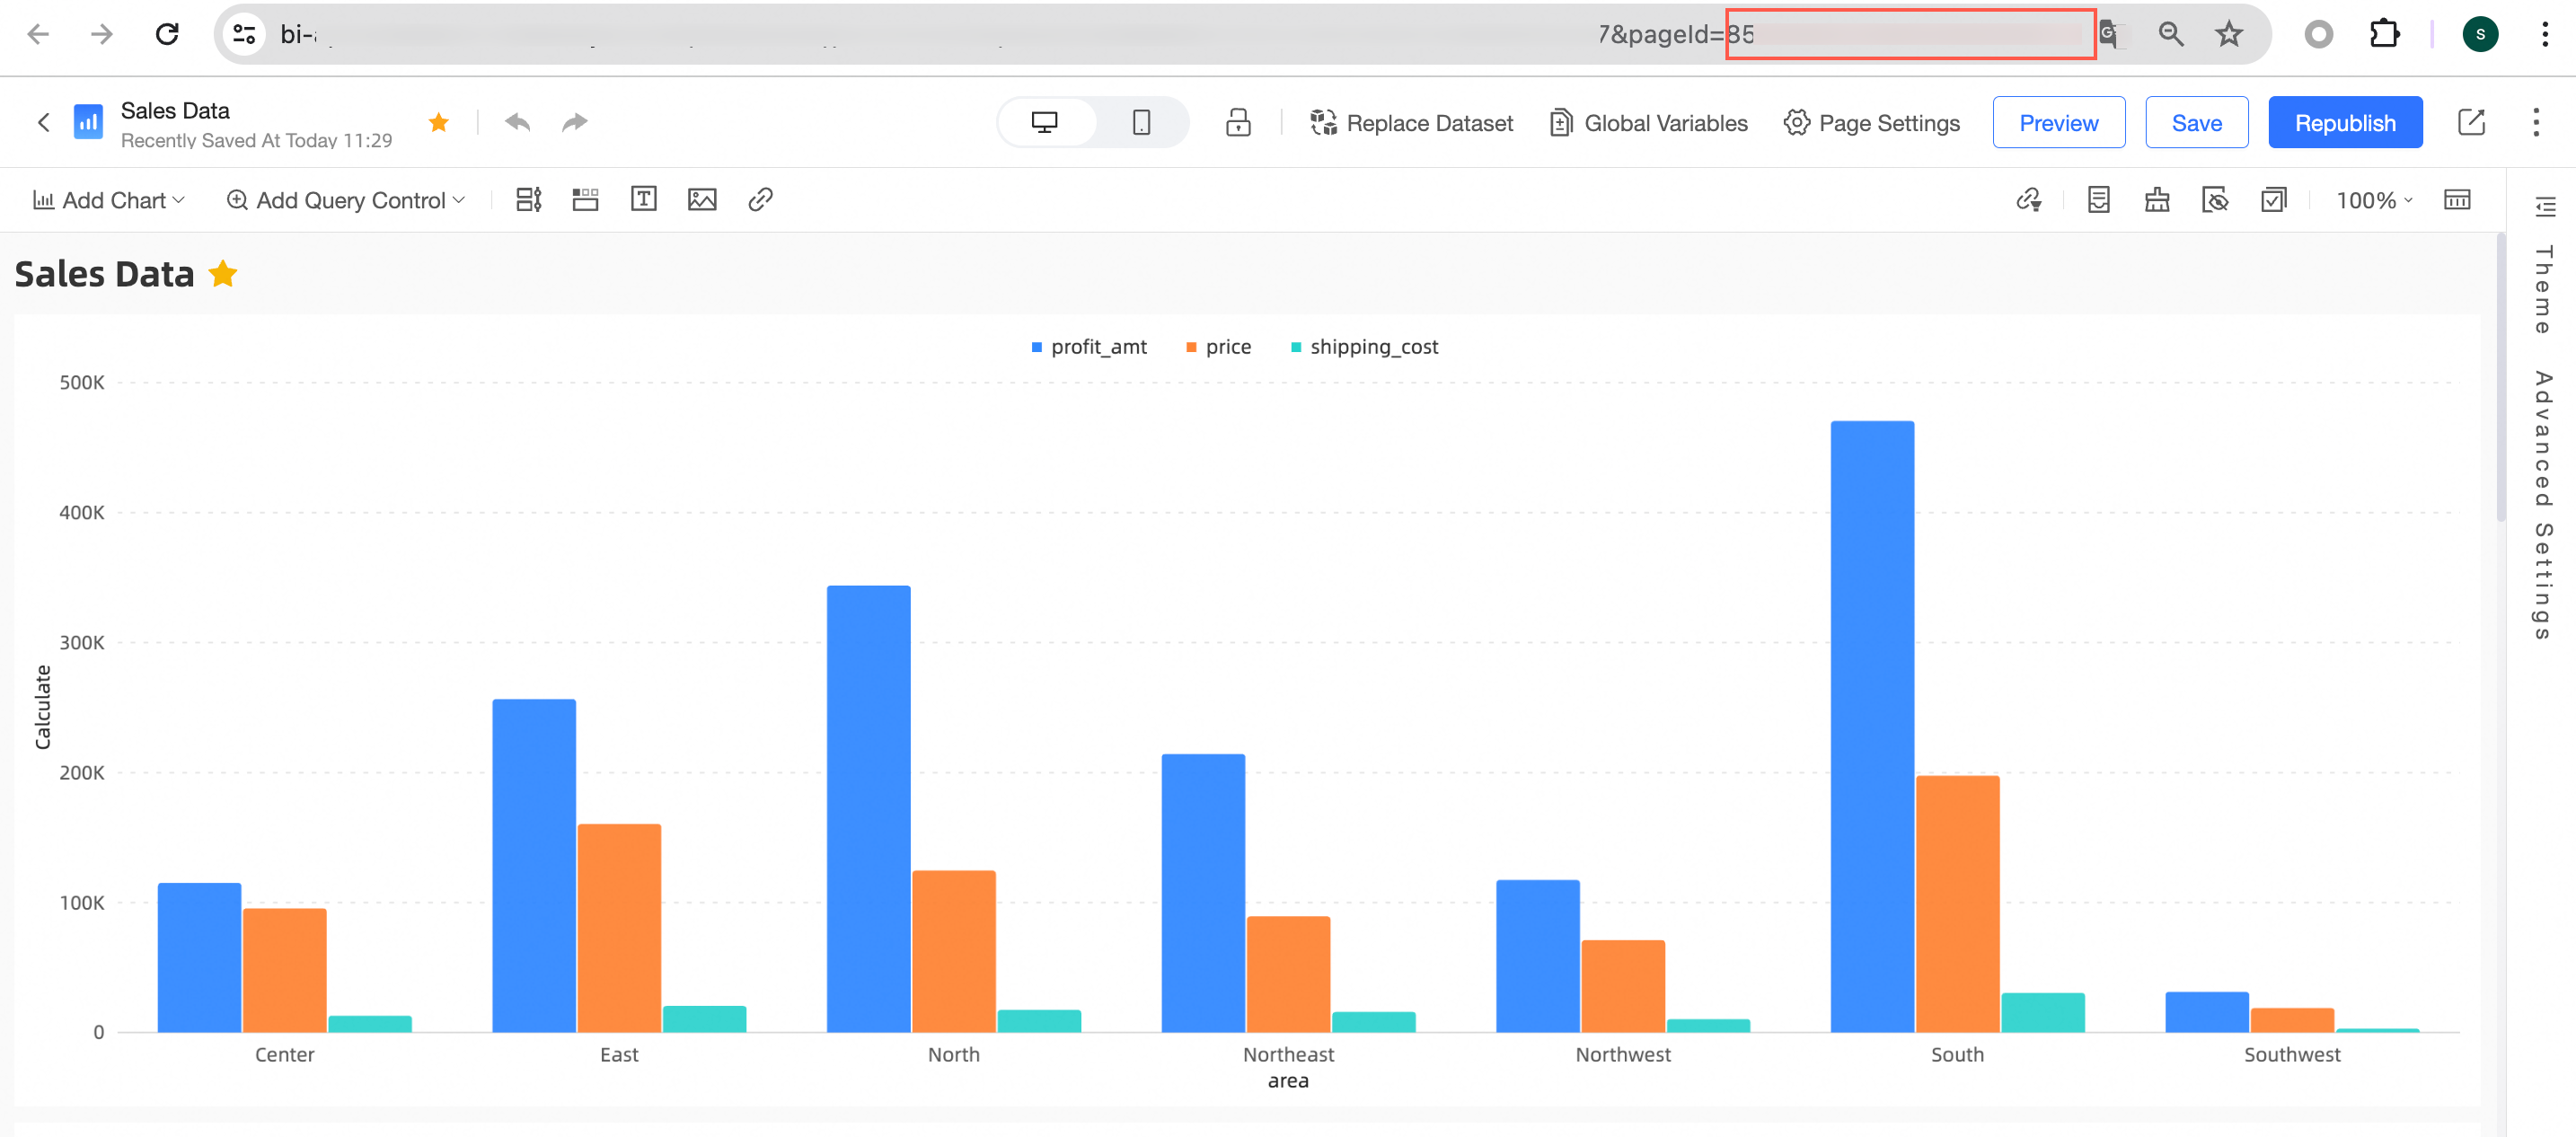
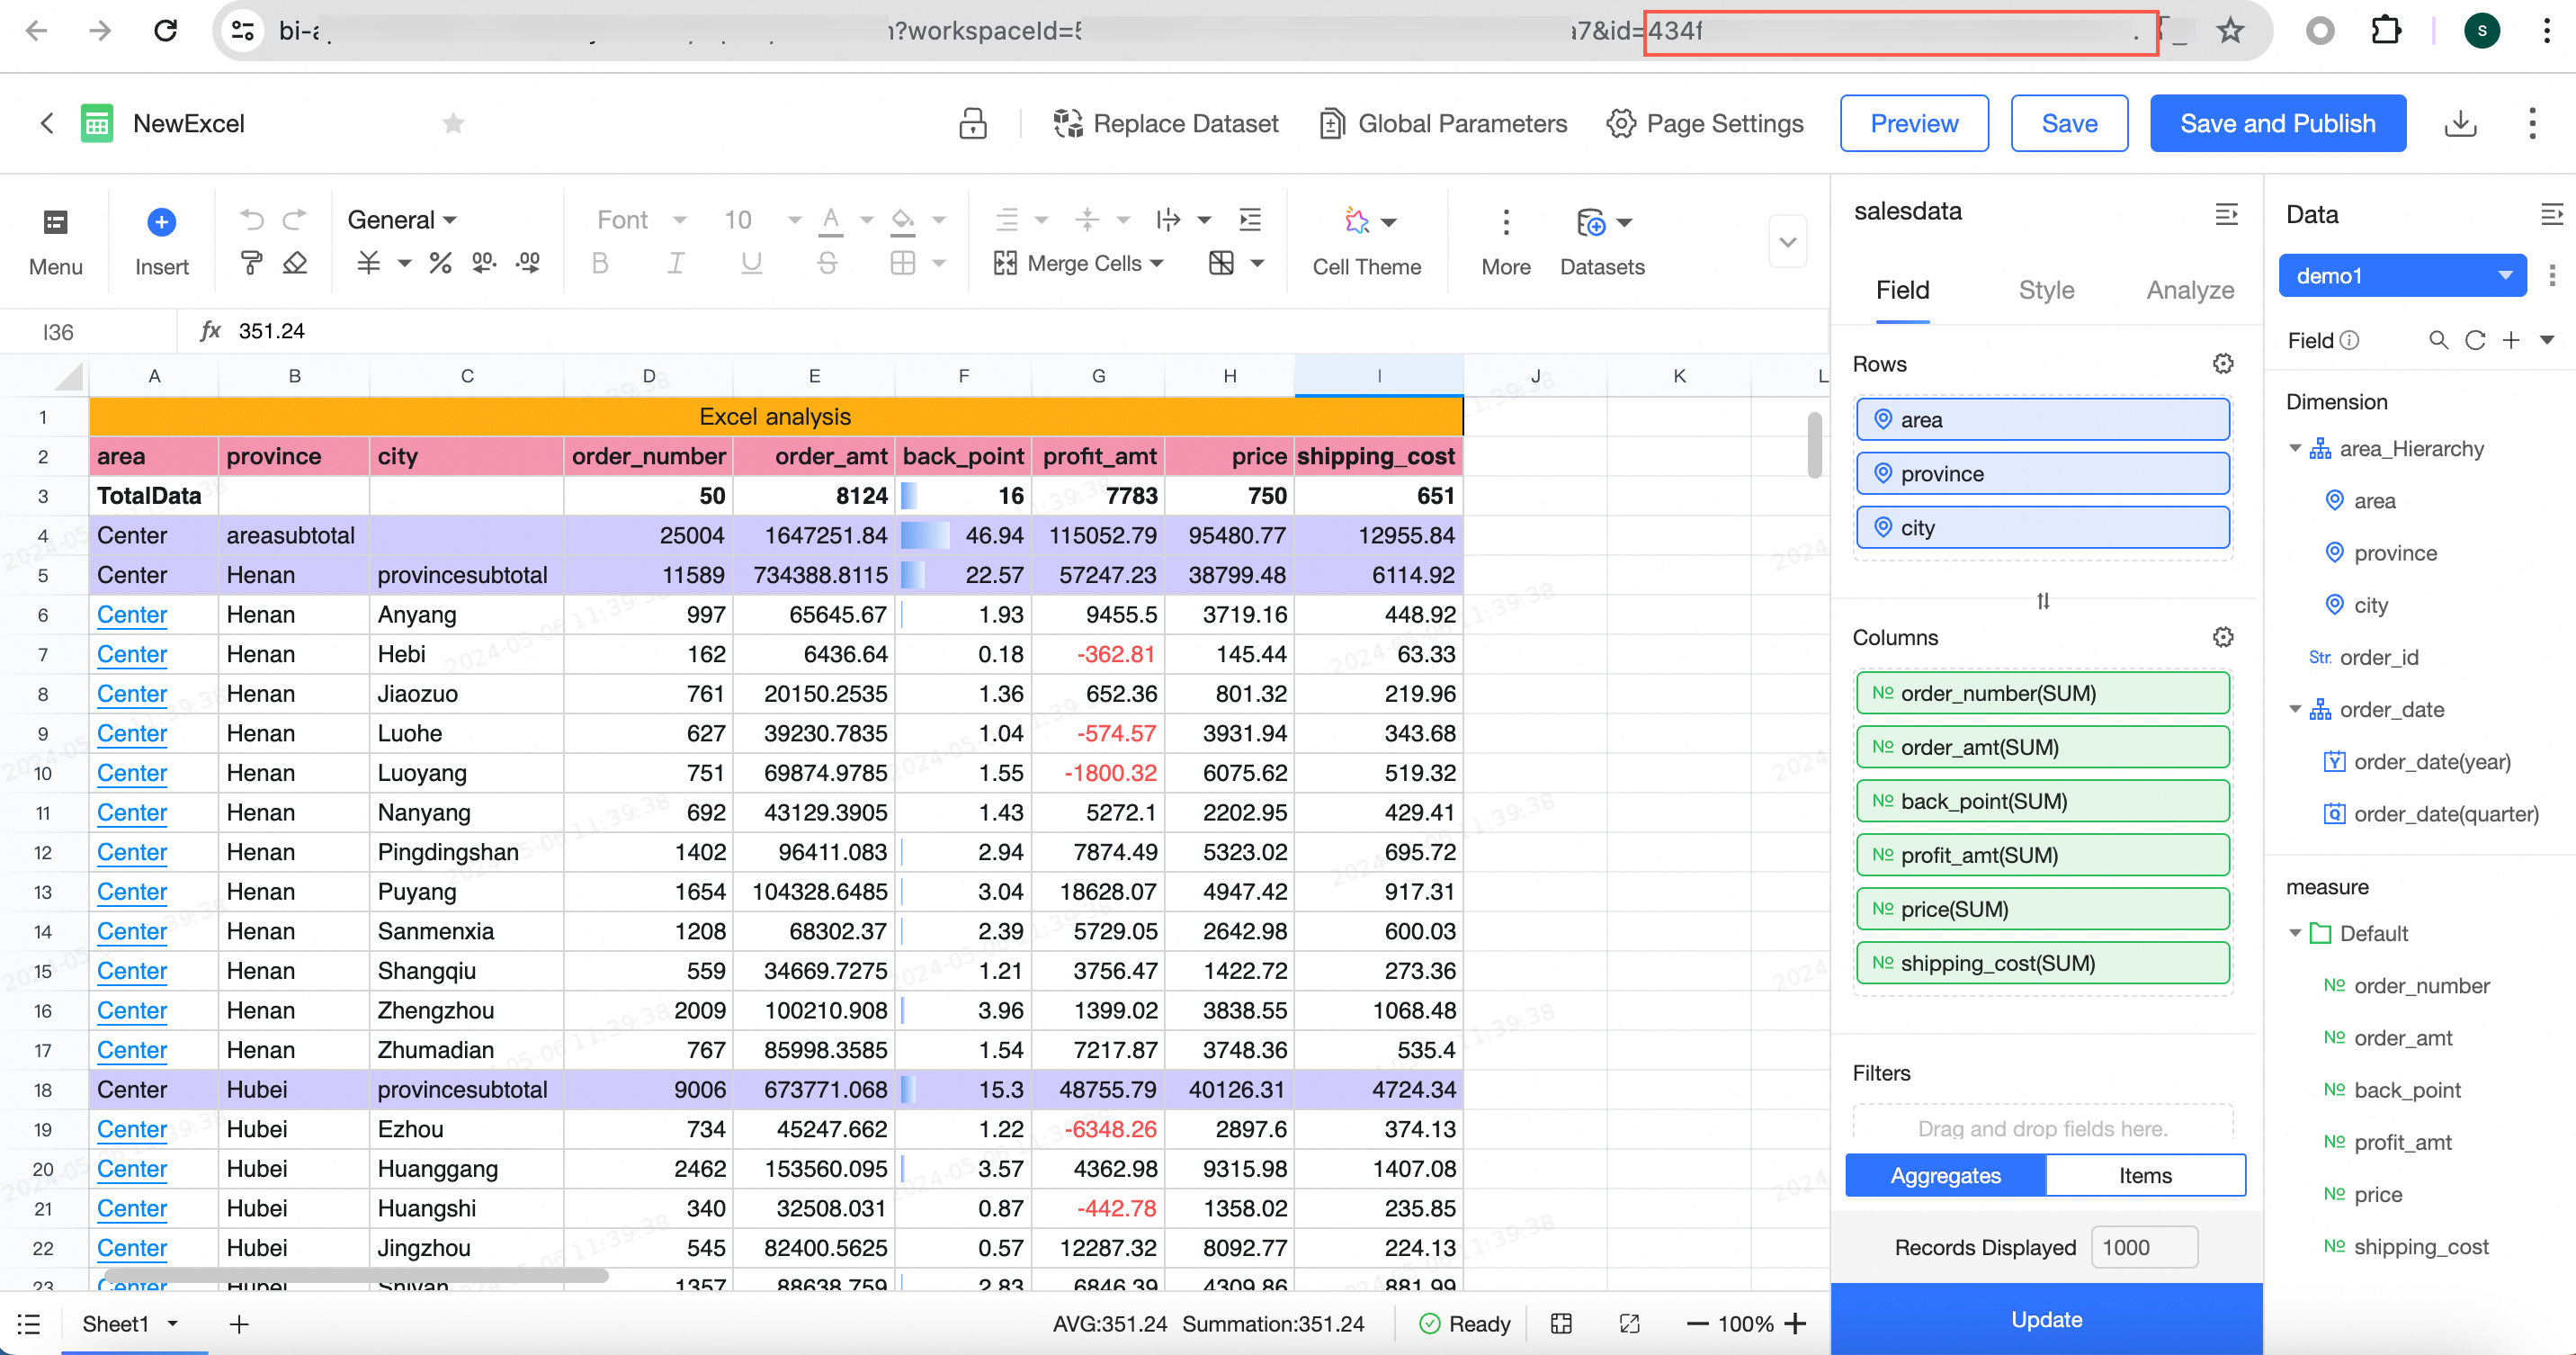
Get the report ID from the report editing page.
Dashboard
On the dashboard editing page, get the value of
pageIdfrom the address bar.Spreadsheet
On the spreadsheet editing page, get the value of the spreadsheet ID from the address bar.
Construct the final URL by combining the Quick BI domain, report preview URL, report ID, and the accessTicket obtained in Step 2.
Dashboard format:
https://<Quick BI domain>/<report preview URL>?pageId=<report ID>&accessTicket=<AccessTicket>Spreadsheet format:
https://<Quick BI domain>/<report preview URL>?id=<report ID>&accessTicket=<AccessTicket>
Manage embedded reports
You can perform the following operations on embedded reports:
Search for an embedded report: On the report list page, enter a keyword for the report name in the search box and click the
icon.You can narrow down the search by selecting the report's workspace or report type.
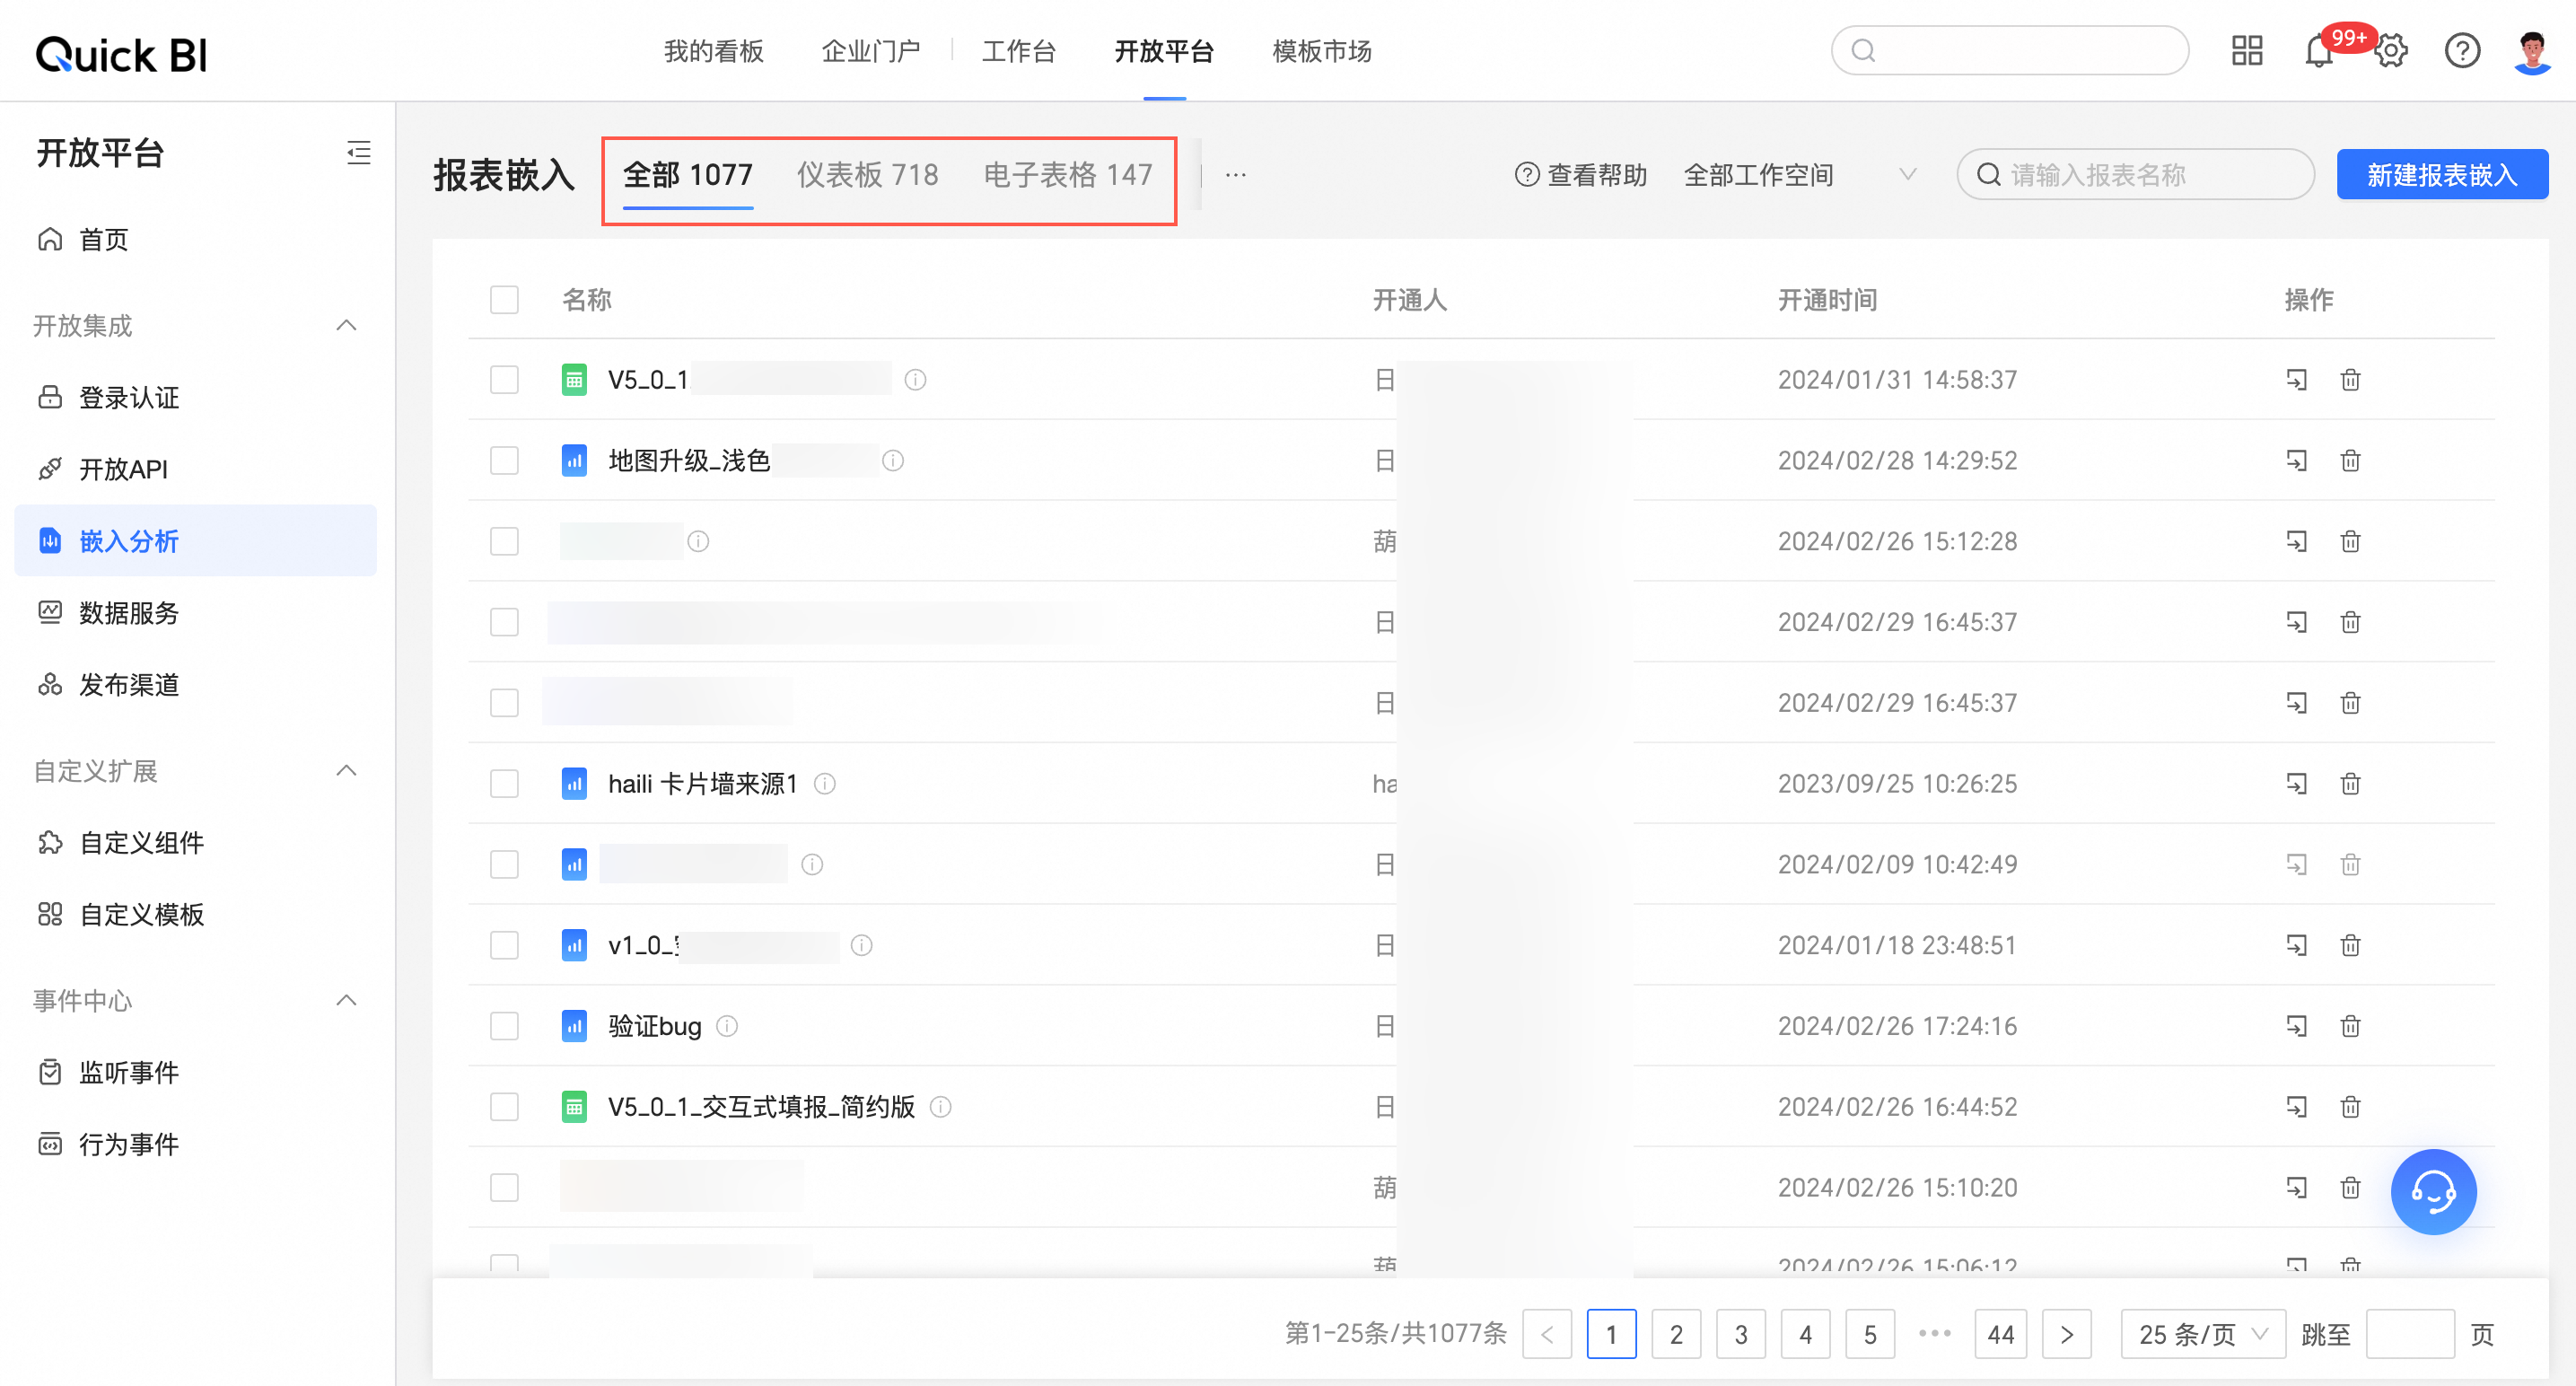
View the number of embedded reports. See View the number of embedded reports.
Delete an embedded report: Click the
icon next to the report to delete it.
 icon.
icon. icon next to the report to delete it.
View the number of embedded reports
On the Quick BI homepage, click Open Platform.
In the left-side navigation pane, click Embedded Analytics.
On the Report Embedding page, you can see the number of reports embedded in third-party systems.
Fix "access report_tree unauthorized" error
Problem
When you use the third-party report embedding feature, the following error message appears.
Cause
Report permissions have not been enabled in the corresponding workspace.
Solution
Enable report permissions as shown in the figure.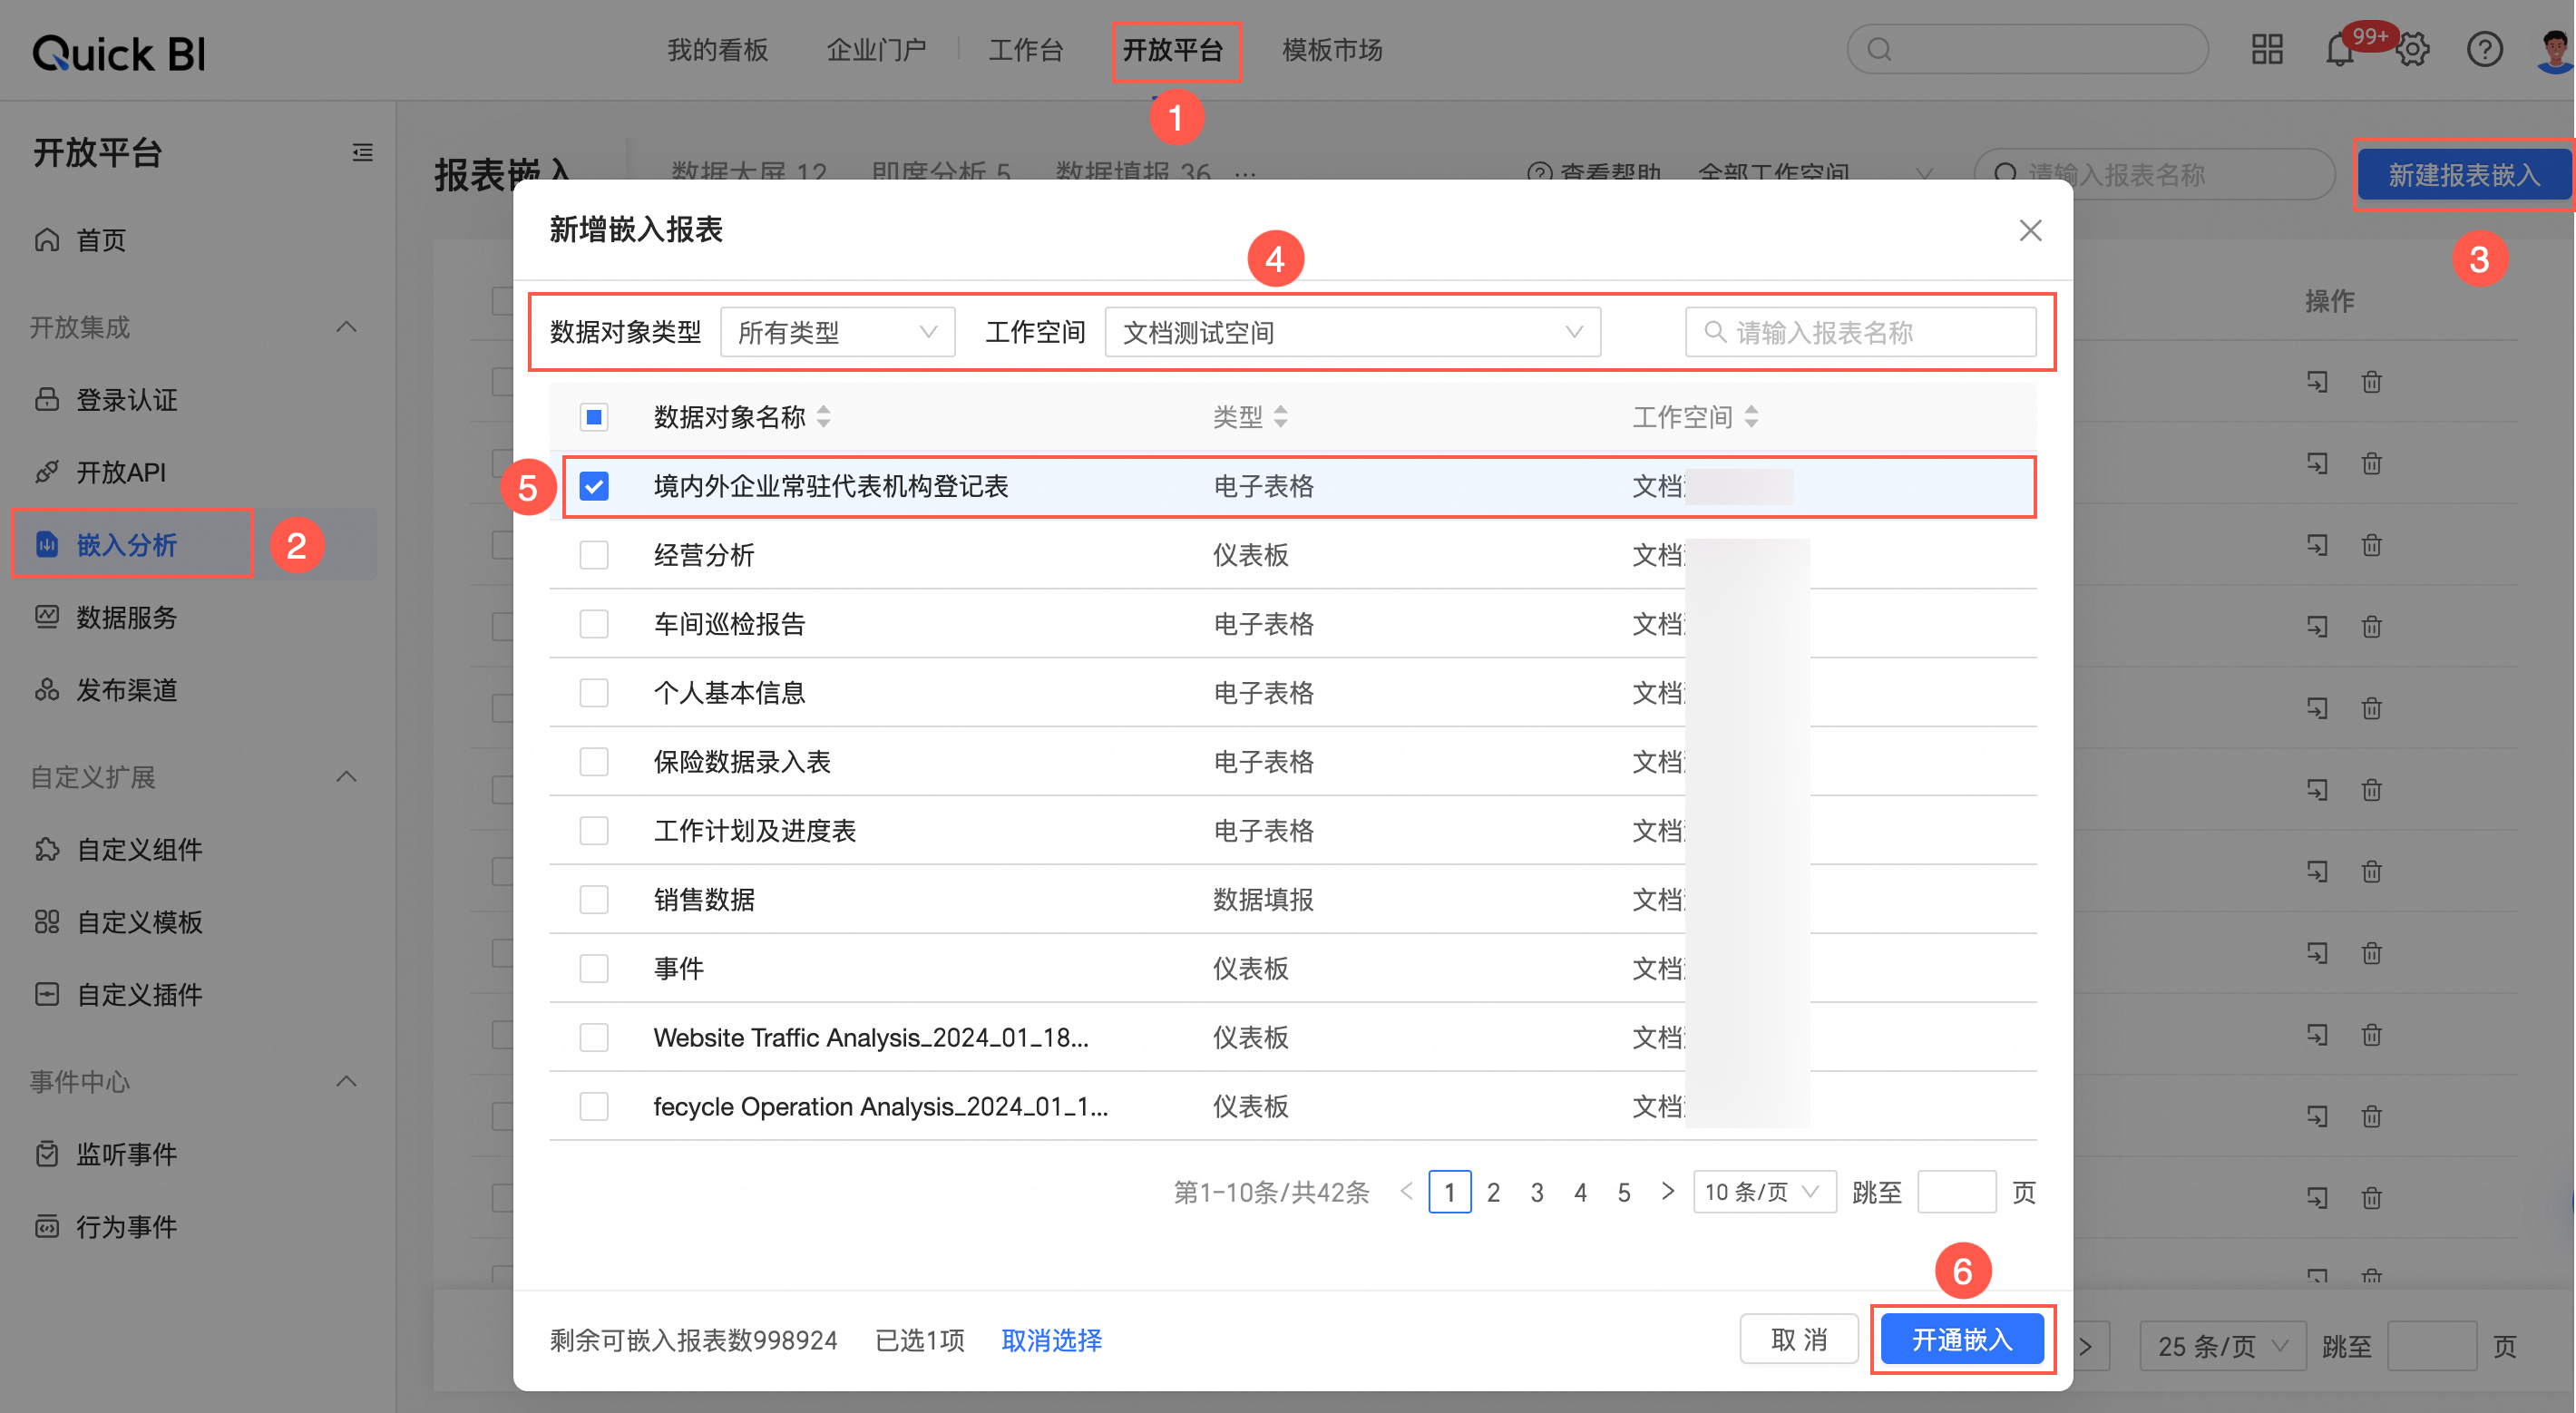
Auto-adjust embedded dashboard height
Problem
When a Quick BI dashboard is embedded in a third-party system using an iframe, the browser's cross-origin security restrictions prevent the parent page from accessing the height of the dashboard within the iframe. This can cause the dashboard to have a scrollbar.
Solution
When a Quick BI dashboard loads, it sends its current height to the parent page via postMessage. The parent page can use an event listener to get the dashboard's height and ID.
You can do this in two ways:
Passively listen for the iframe content height sent to the parent page.
// Quick BI URL. You can add other URLs if necessary.
const quickBIURL = ['https://bi.aliyun.com/'];
function messageListener(event) {
  if (quickBIURL.includes(event.origin)) {
    // The height value from postMessage
    console.log('Quick BI Dashboard Height:', event.data.height);
    // The dashboard page ID from postMessage
    console.log('Quick BI Dashboard Id:', event.data.pageId);
  }
}
// Add the listener before the dashboard loads.
window.addEventListener('message', messageListener);
Actively request the dashboard height by sending a
postMessagefrom the parent page to the iframe page.Where:
iframeis the iframe element that embeds the Quick BI dashboard.The
dataobject in the message must include{ getDashboardHeight: true }.
The following is a code example.
// Quick BI URL. You can add other URLs if necessary. const quickBIURL = ['https://bi.aliyun.com/']; function messageListener(event) { if (quickBIURL.includes(event.origin)) { // The height value from postMessage console.log('Quick BI Dashboard Height:', event.data.height); // The dashboard page ID from postMessage console.log('Quick BI Dashboard Id:', event.data.pageId); } } // Add the listener before the dashboard loads. window.addEventListener('message', messageListener); // Actively request the Quick BI dashboard height. // The iframe that embeds the Quick BI dashboard. const iframe = document.querySelector('iframe'); // The data object in the message must include { getDashboardHeight: true }. iframe.contentWindow.postMessage({getDashboardHeight: true}, '*');NoteA Quick BI dashboard's width automatically adapts to its parent container, so horizontal scrollbars do not appear and no manual width adjustment is needed.
Complete example
<!DOCTYPE html>
<html lang="en">
    <head>
        <meta charset="UTF-8" />
        <meta name="viewport" content="width=device-width, initial-scale=1.0" />
        <meta http-equiv="X-UA-Compatible" content="ie=edge" />
    </head>
    <body>
        <iframe
        class="quickbi-iframe-demo"
    src="https://bi.aliyun.com//token3rd/dashboard/view/pc.htm?pageId=dd0****83f&accessTicket=fd138bcb-****-4fde-b413-81bcee59bdb6"
      scrolling="no"
     frameborder="0"
      width="100%"
      height="600">
    </iframe>
   <!-- <useBodyAutoHeight=true> enables auto-height for the page body, <page_Id> is the dashboard page ID, and accessTicket is the token for accessing the dashboard. -->
        <script>
      // Quick BI URL. You can add other URLs if necessary.
      const quickBIURL = ['https://bi.aliyun.com'];
      function messageListener(event) {
        if (quickBIURL.includes(event.origin)) {
          // The height value from postMessage
          console.log('Quick BI Dashboard Height:', event.data.height);
          // The dashboard page ID from postMessage
          console.log('Quick BI Dashboard Id:', event.data.pageId);
        }
      }
      // Add the listener before the dashboard loads.
      window.addEventListener('message', messageListener);
      // The iframe that embeds the Quick BI dashboard.
      const iframe = document.querySelector('iframe');
       // Actively request the Quick BI dashboard height.
      // The data object in the message must include { getDashboardHeight: true }.
      iframe.contentWindow.postMessage({getDashboardHeight: true}, '*');
        </script>
    </body>
</html>
Set width for mobile iframe embedding
Problem
Due to iframe compatibility issues on older iOS versions, the actual iframe width can overflow its container. This can cause issues like horizontal scrolling of the entire dashboard, unresponsive fixed-column tables, truncated charts, and misplaced query control pop-ups.
Solution
Modify the iframe style.
Use the following CSS code:
iframe {
    border-width: 0;
    min-width: 100%;
    width: 0;
    *width: 100%;
    height: 667px; /* Height must be a fixed value. You can set it dynamically after getting the screen height. Using height: 100% may cause compatibility issues. */
}