The rich text widget adds formatted text to a dashboard, such as descriptions, annotations, or titles. It offers extensive editing features that let you:
Edit text content: Enter custom text for your business scenarios.
Format text: Adjust font, font size, color, background color, alignment (left, center, right), bold, italics, and underline.
Insert dynamic metrics: Embed measure or dimension fields from a dataset to display real-time data values.
Add hyperlinks: Insert hyperlinks to internal dashboard pages, external websites, or other resources to improve navigation and connectivity.
This topic describes how to add and configure a rich text widget.
Use cases
You can use a rich text widget for chart annotations, displaying key real-time metrics, weekly report email subscriptions, and automatic generation of data reports.
Limitations
Prerequisites: You must have a dashboard. For more information, see Create a dashboard and Overview of Visualized Charts.
Note the following when using the rich text widget:
Metric display limit: When you insert a dimension field into a rich text widget to display multiple dimension values, you can set the number of results to display, up to a maximum of 50.
Pin to top limitation: You can set a rich text widget to pin to top, but this feature is not supported on mobile devices in non-full-screen mode.
Procedure
Add a rich text widget: On the dashboard toolbar, click the
 icon to add a rich text widget.
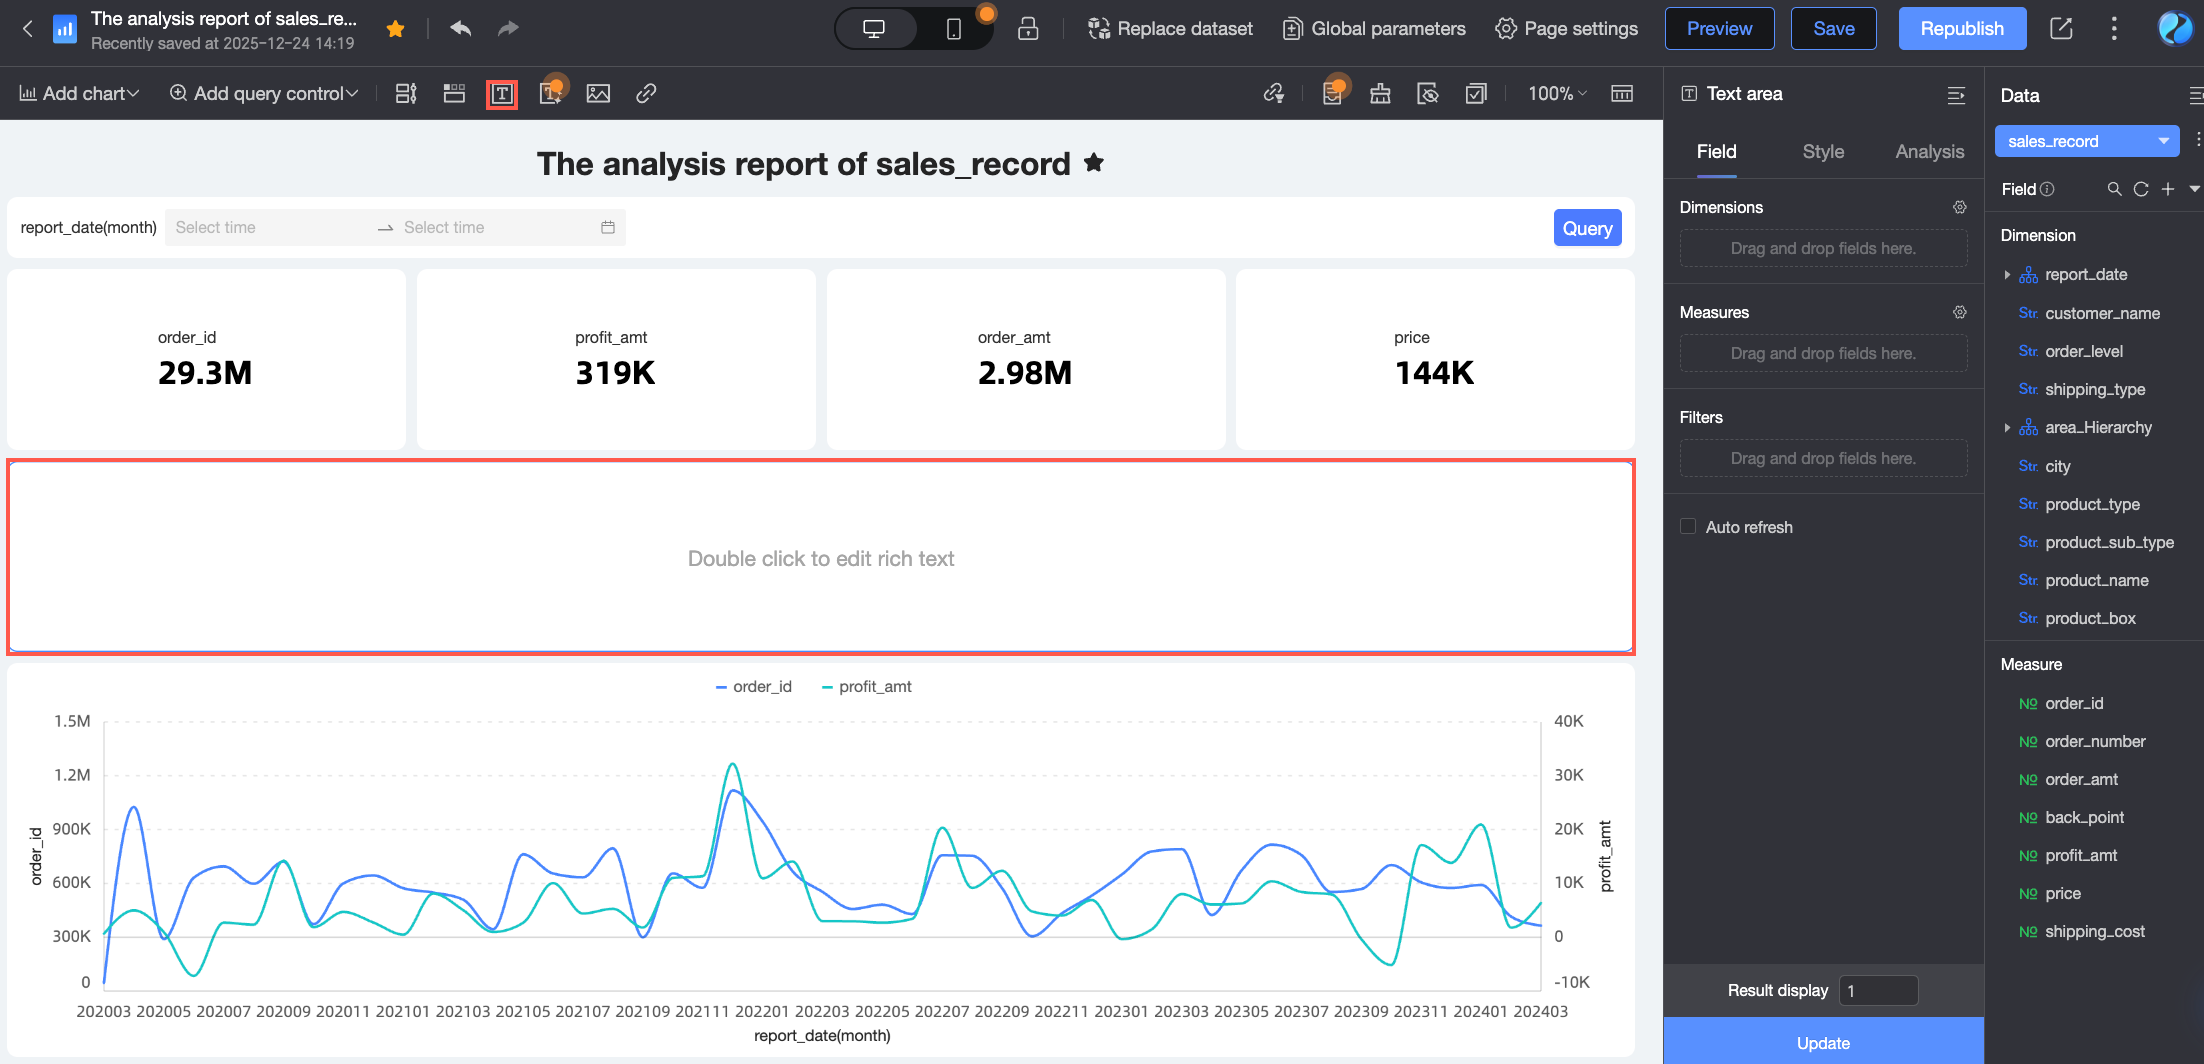
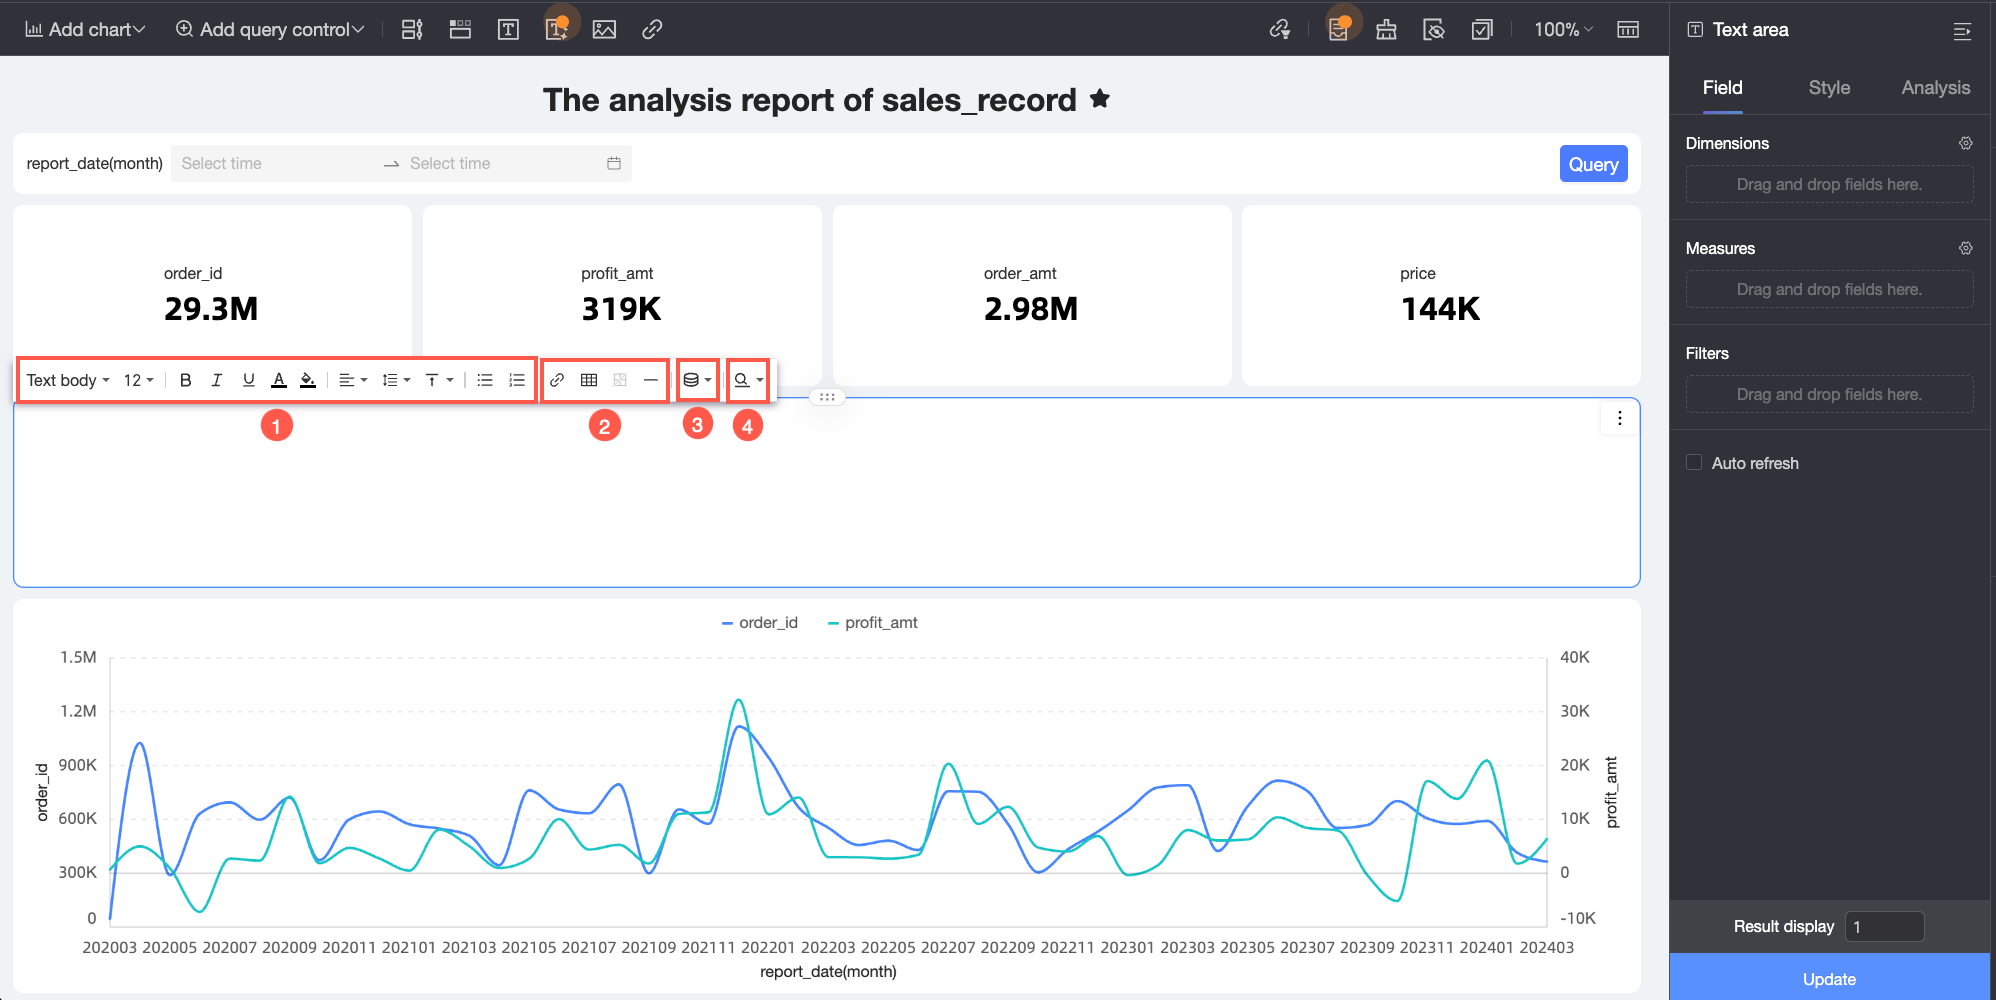
Edit the rich text widget content: Double-click the widget to perform the following editing operations.
Operation
Description
① Text input and formatting
Enter text and use the toolbar to format it by setting the font, font size, color, background color, and alignment.
② Insert content
You can insert links, tables, or separators.
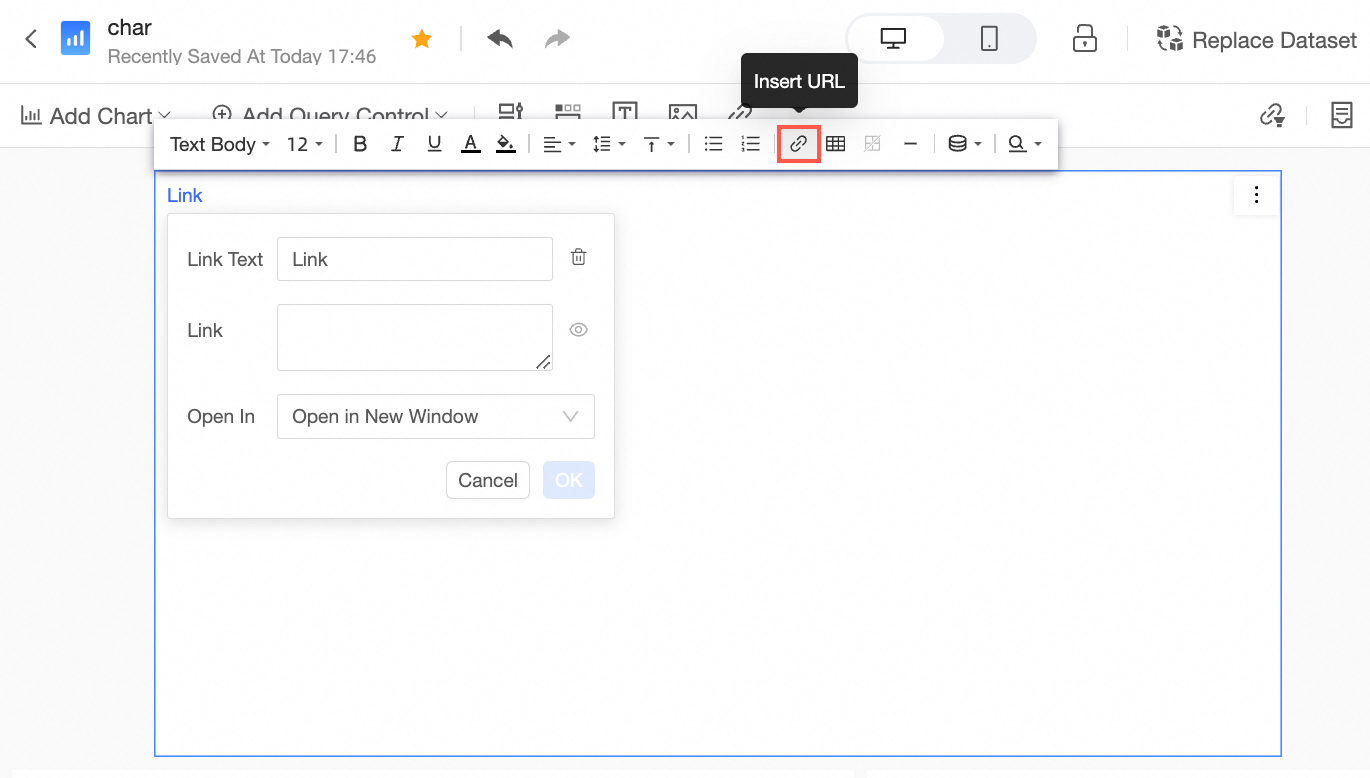
Link: Click the
 icon on the rich text toolbar, enter the link URL and select its target behavior: Open in new window, Open in current window, or Pop-up.
After the hyperlink is added, you can press Ctrl and click the linked text to open the link.
Table: Click the
icon on the rich text toolbar and select the number of rows and columns to insert a table in the rich text widget. This helps structure your data, improving clarity for viewers. If you need to modify the number of rows and columns in an inserted table, click the icon again to reselect the number of rows and columns.Separator: Click the
icon on the rich text toolbar to add a separator (a horizontal line) that visually divides content and improves readability.
③ Add metric
You can add a Selected field for chart or a query field.
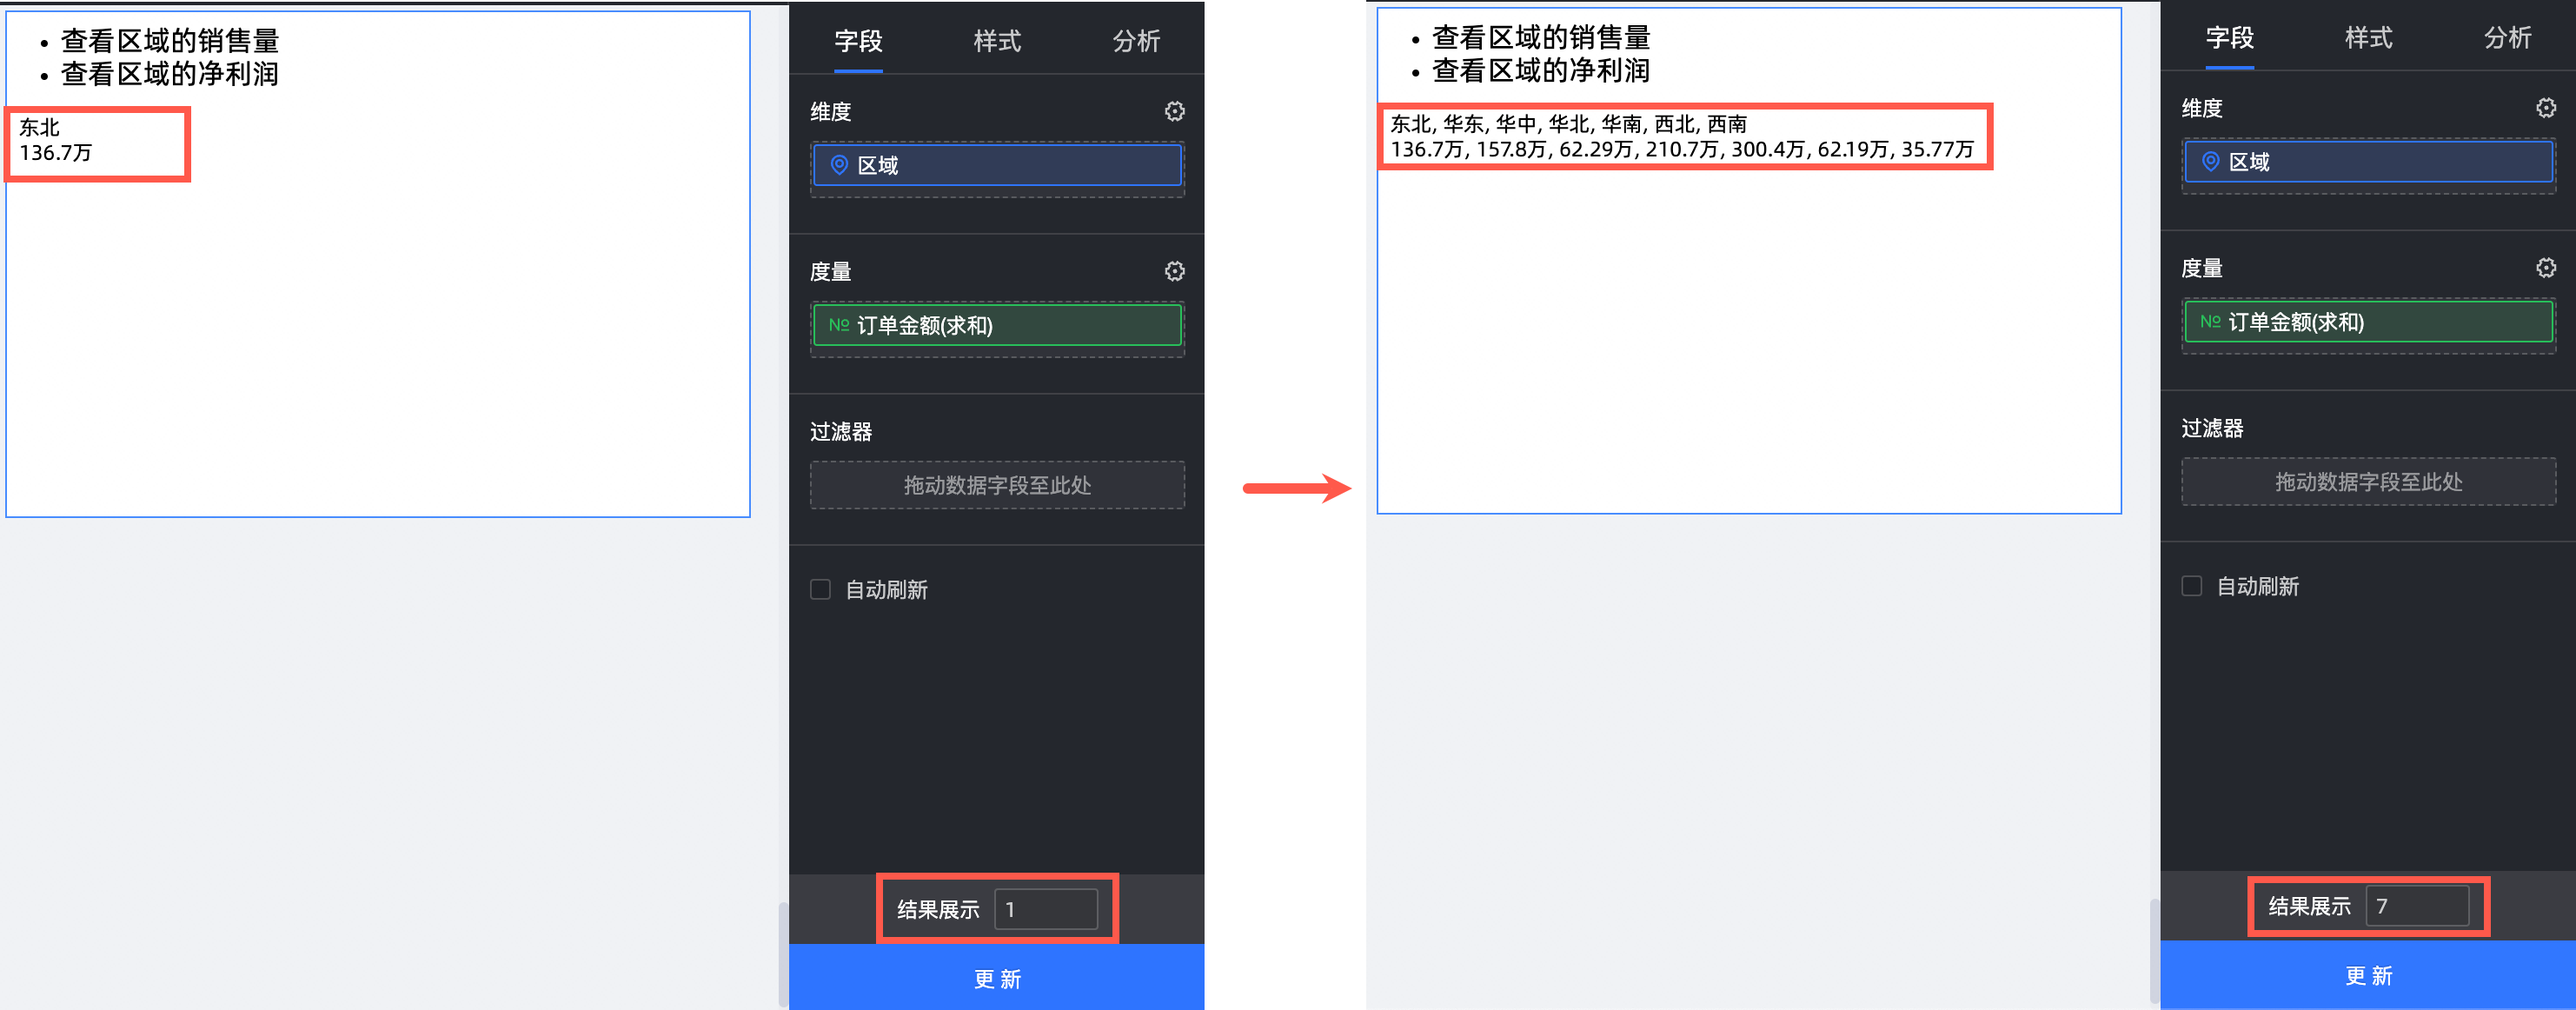
Selected field for chart: Drag the required metric fields into the Field configuration panel of the rich text widget. Click the
icon on the toolbar, and select the metric to insert from the Selected field for chart drop-down list.To view multiple values for a single dimension, set the number of results to display. For example, if you set the dimension field to region and the measure field to order amount, the widget displays one data entry by default. If you need to view data for seven regions, set the number of results to 7 in the Data panel under the Field tab.
NoteYou can display a maximum of 50 results.
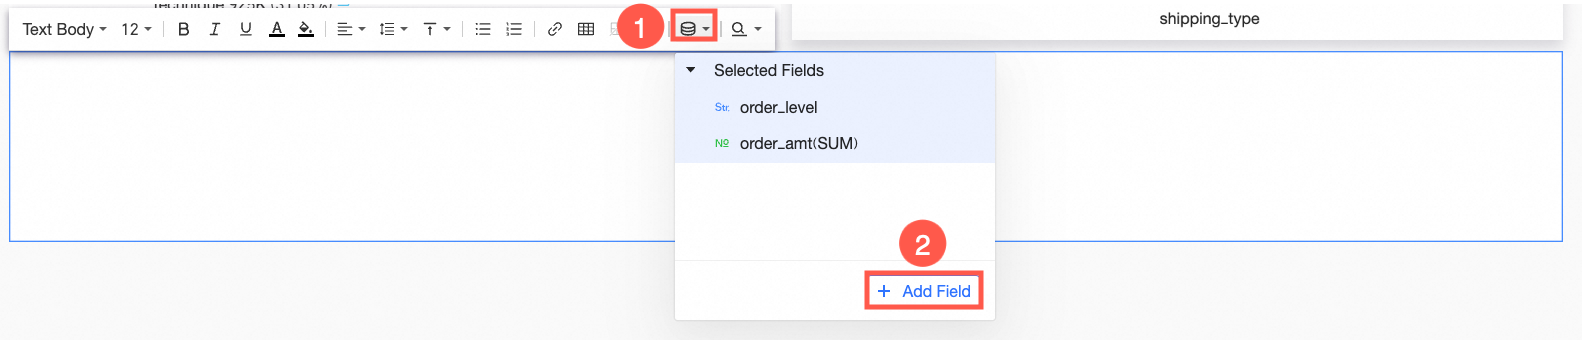
Query field: If you need to insert other dataset fields or use different configurations for fields from the current dataset, such as a different sort order, click Add Field under Add Metric to add a subquery.
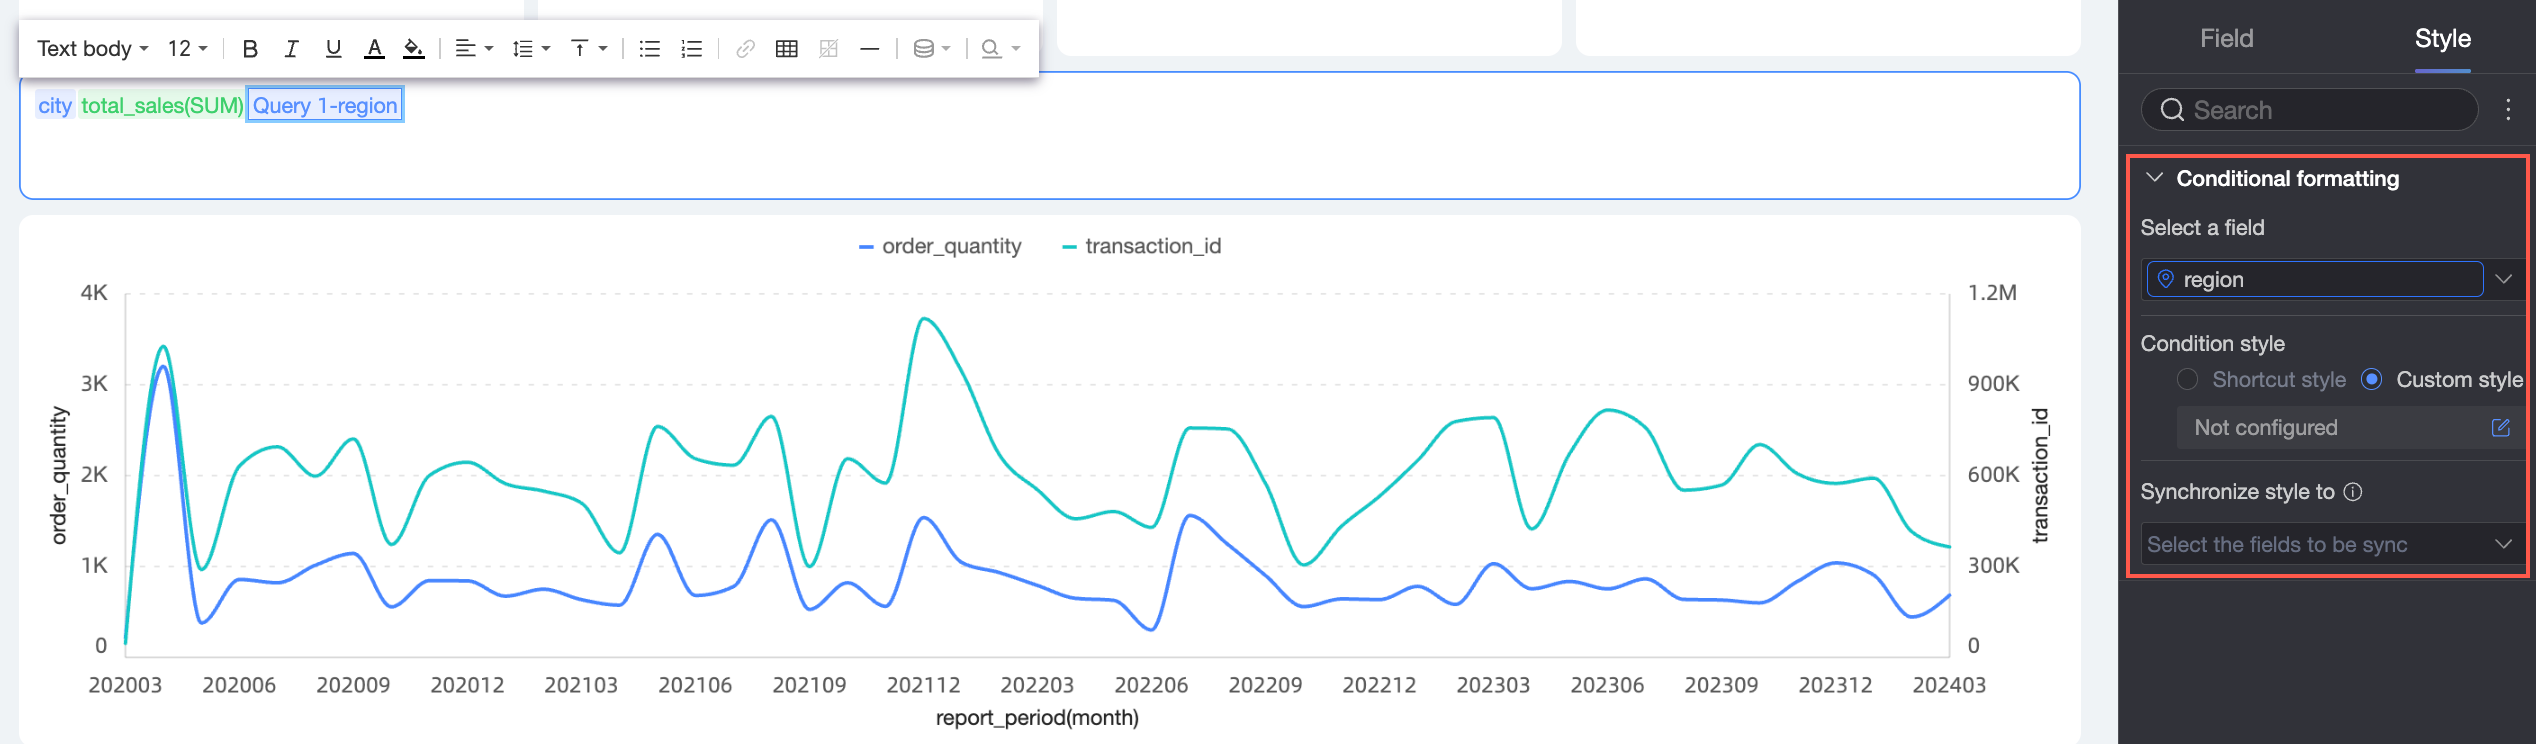
You can use conditional formatting for metrics to highlight key data based on specific rules, such as targets or outliers. In the Add Metric panel, select a Selected field for chart or a query, and then configure conditional formatting for its fields in the corresponding Style panel on the right. For more information, see conditional formatting.
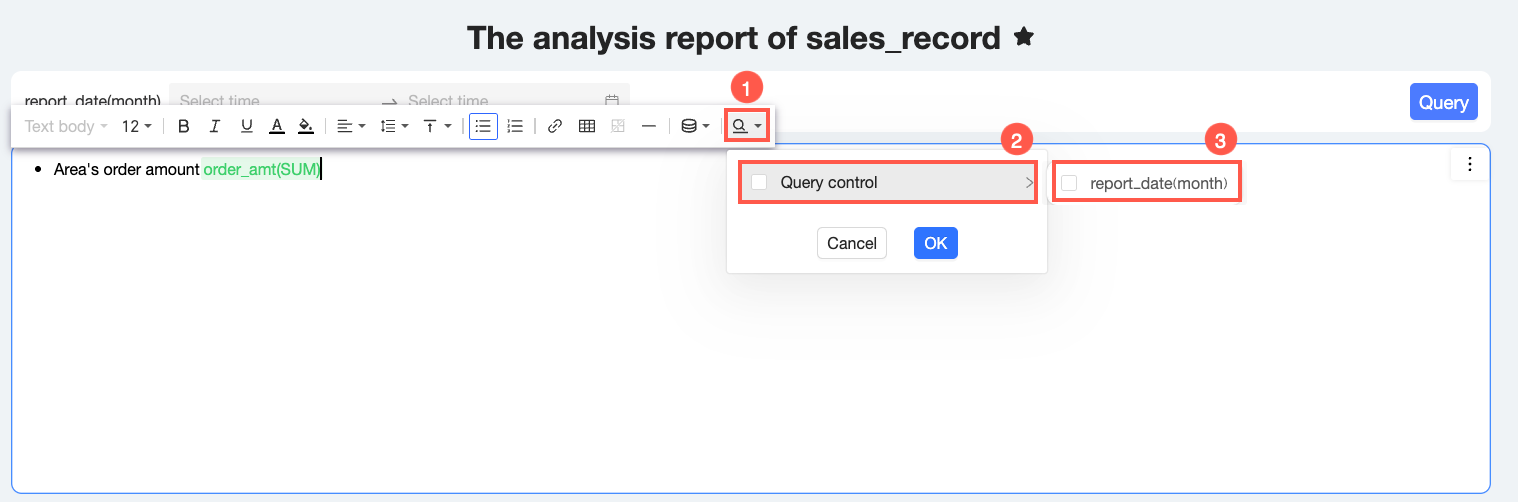
④ Add query
You can add an existing query control from the current dashboard to the rich text widget to create a dynamic link between the text content and the query control.
For example, in the Business Summary widget shown in the following figure, the text Total Sales for the Period needs to dynamically display the statistical range based on the filter from the Time Selection query control. To achieve this, click the
icon on the toolbar and select the Time Selection query control from the drop-down list to add it to the rich text.The final result is as follows:
Configure the widget style: You can configure the following style settings.
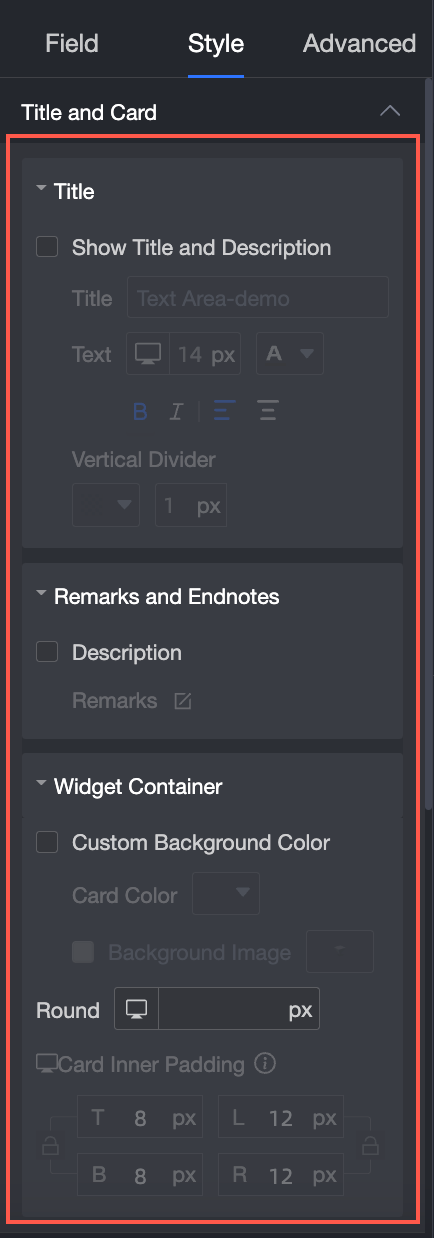
In Title & Card, configure the Title, Remarks and Endnotes, and Component container.
Parameter
Description
Example
Title
Show or hide the main title and configure its style.
Remarks and endnotes
Configure the content of remarks.
Component container
Configure the custom background fill, corner radius, and card padding.
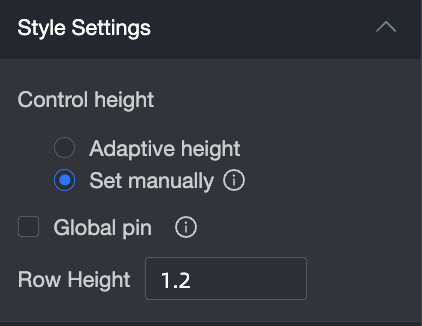
In Style Settings, configure Widget Height, Pin to top, and Line height.
Parameter
Description
Example
Widget height
Choose between Auto height and Manual setting.
Pin to top
Selecting this option pins the widget, replacing any other pinned widget. This feature is not supported on mobile devices in non-full-screen mode.
Line height
Enter a value manually.
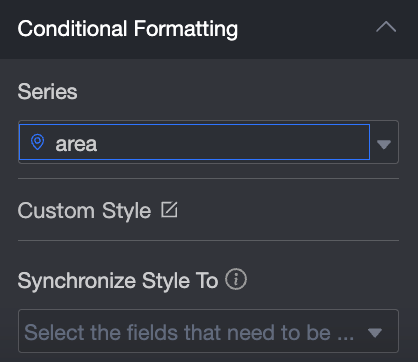
In Conditional formatting, configure conditional formatting for measure data.
Parameter
Description
Example
Select series
The data series added to the Data tab.
Custom style
Customize text and icon styles, and set marker icons, value ranges, and font colors.
Sync style to
Sync the current conditional formatting settings to other measures.
Delete the rich text widget: Click the
icon in the upper-right corner of the rich text widget and select Delete.
 icon on the rich text toolbar and select the number of rows and columns to insert a table in the rich text widget. This helps structure your data, improving clarity for viewers.
 If you need to modify the number of rows and columns in an inserted table, click the
  icon on the rich text toolbar to add a separator (a horizontal line) that visually divides content and improves readability.
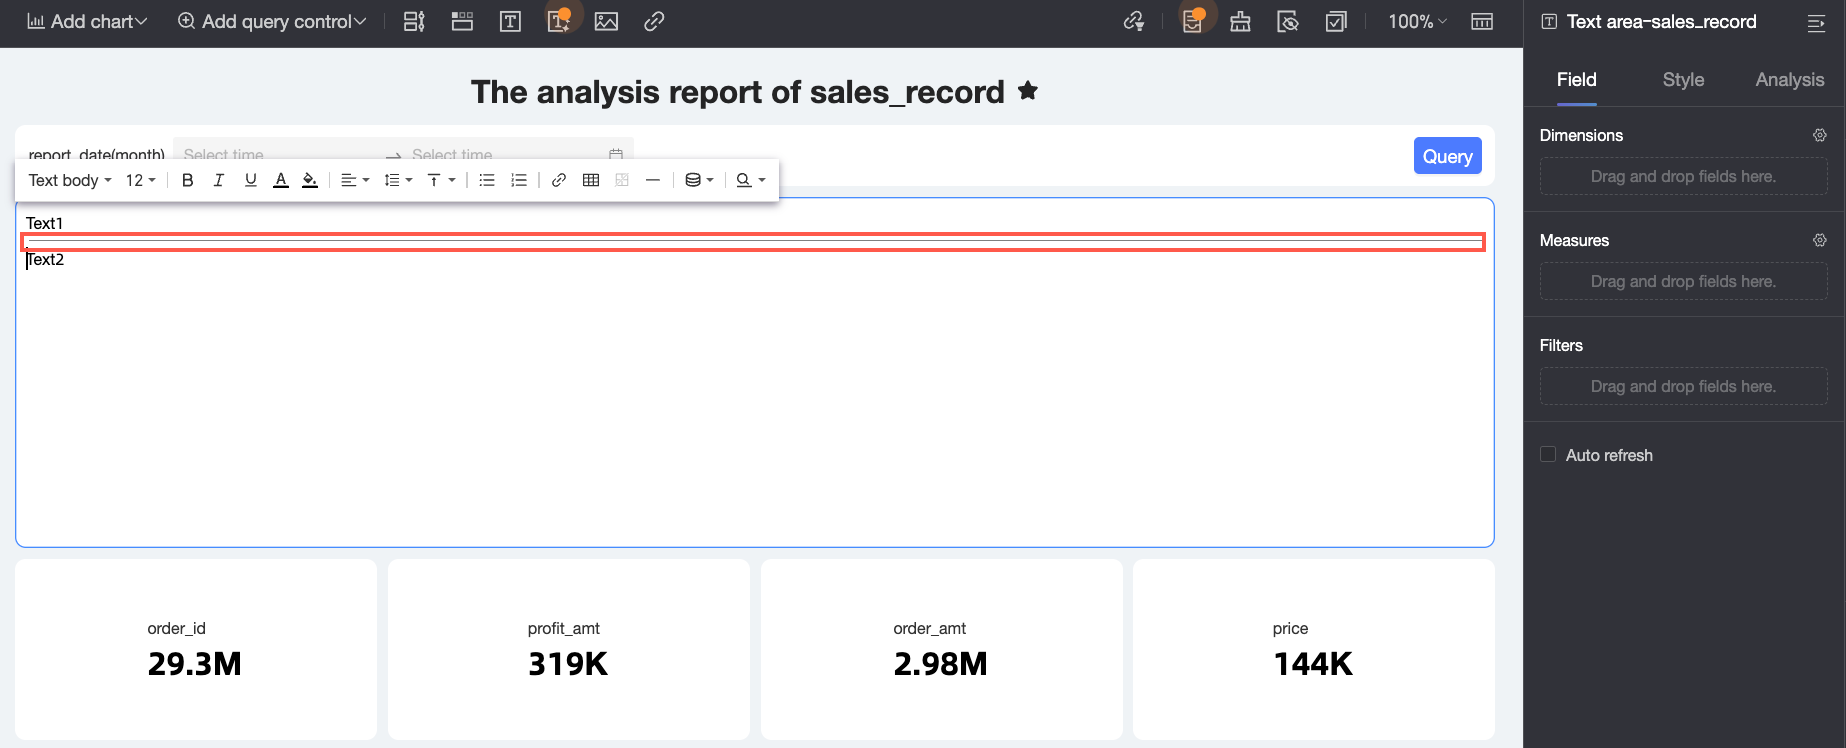
 icon on the toolbar, and select the metric to insert from the Selected field for chart drop-down list.
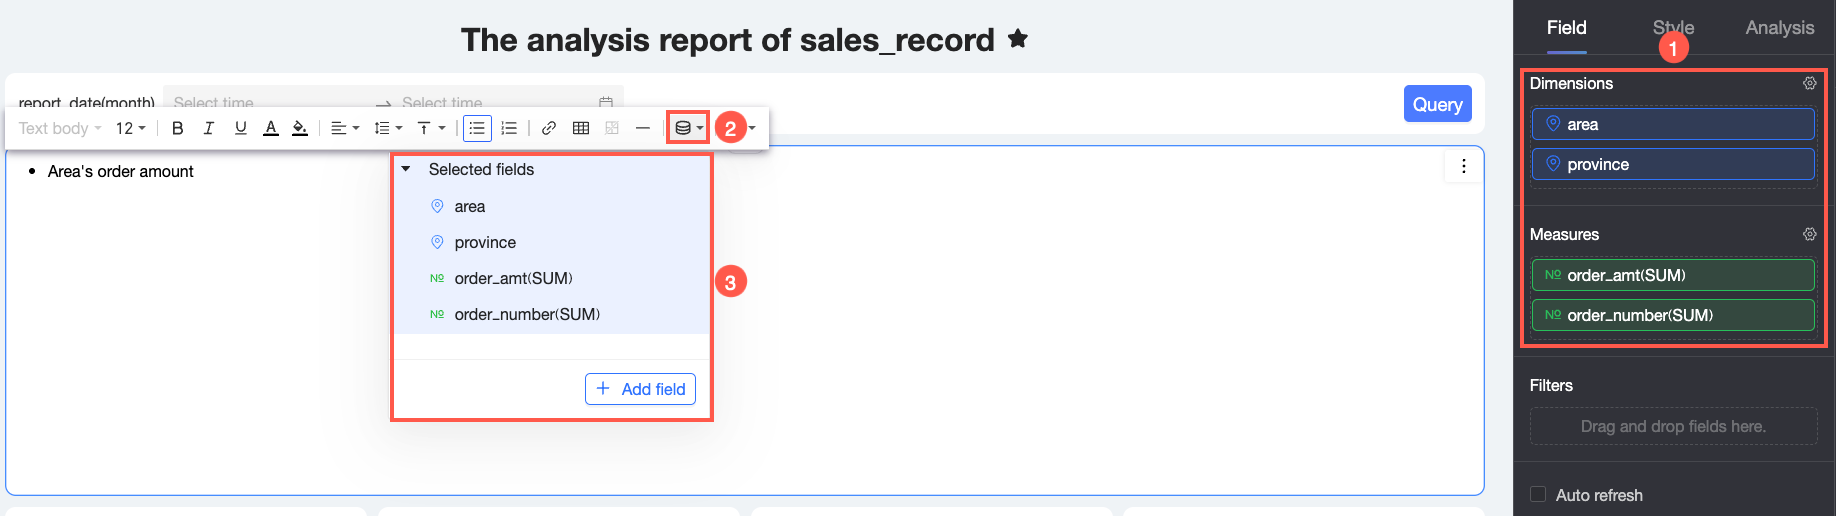
 icon on the toolbar and select the Time Selection query control from the drop-down list to add it to the rich text.