Custom GeoJSON
If your reports require analyzing custom areas, you can upload a GeoJSON file to define their geographic boundaries. This topic explains how to use a GeoJSON file to define this geographic information and display the custom areas on a map.
Usage notes
The custom GeoJSON feature is available only in Professional Edition.
Only an organization administrator can configure custom areas.
Once configured, developers and analysts can use the custom area for data analysis and visualization.
Single-layer geographic information
Create a custom area
Log on to the Quick BI console.
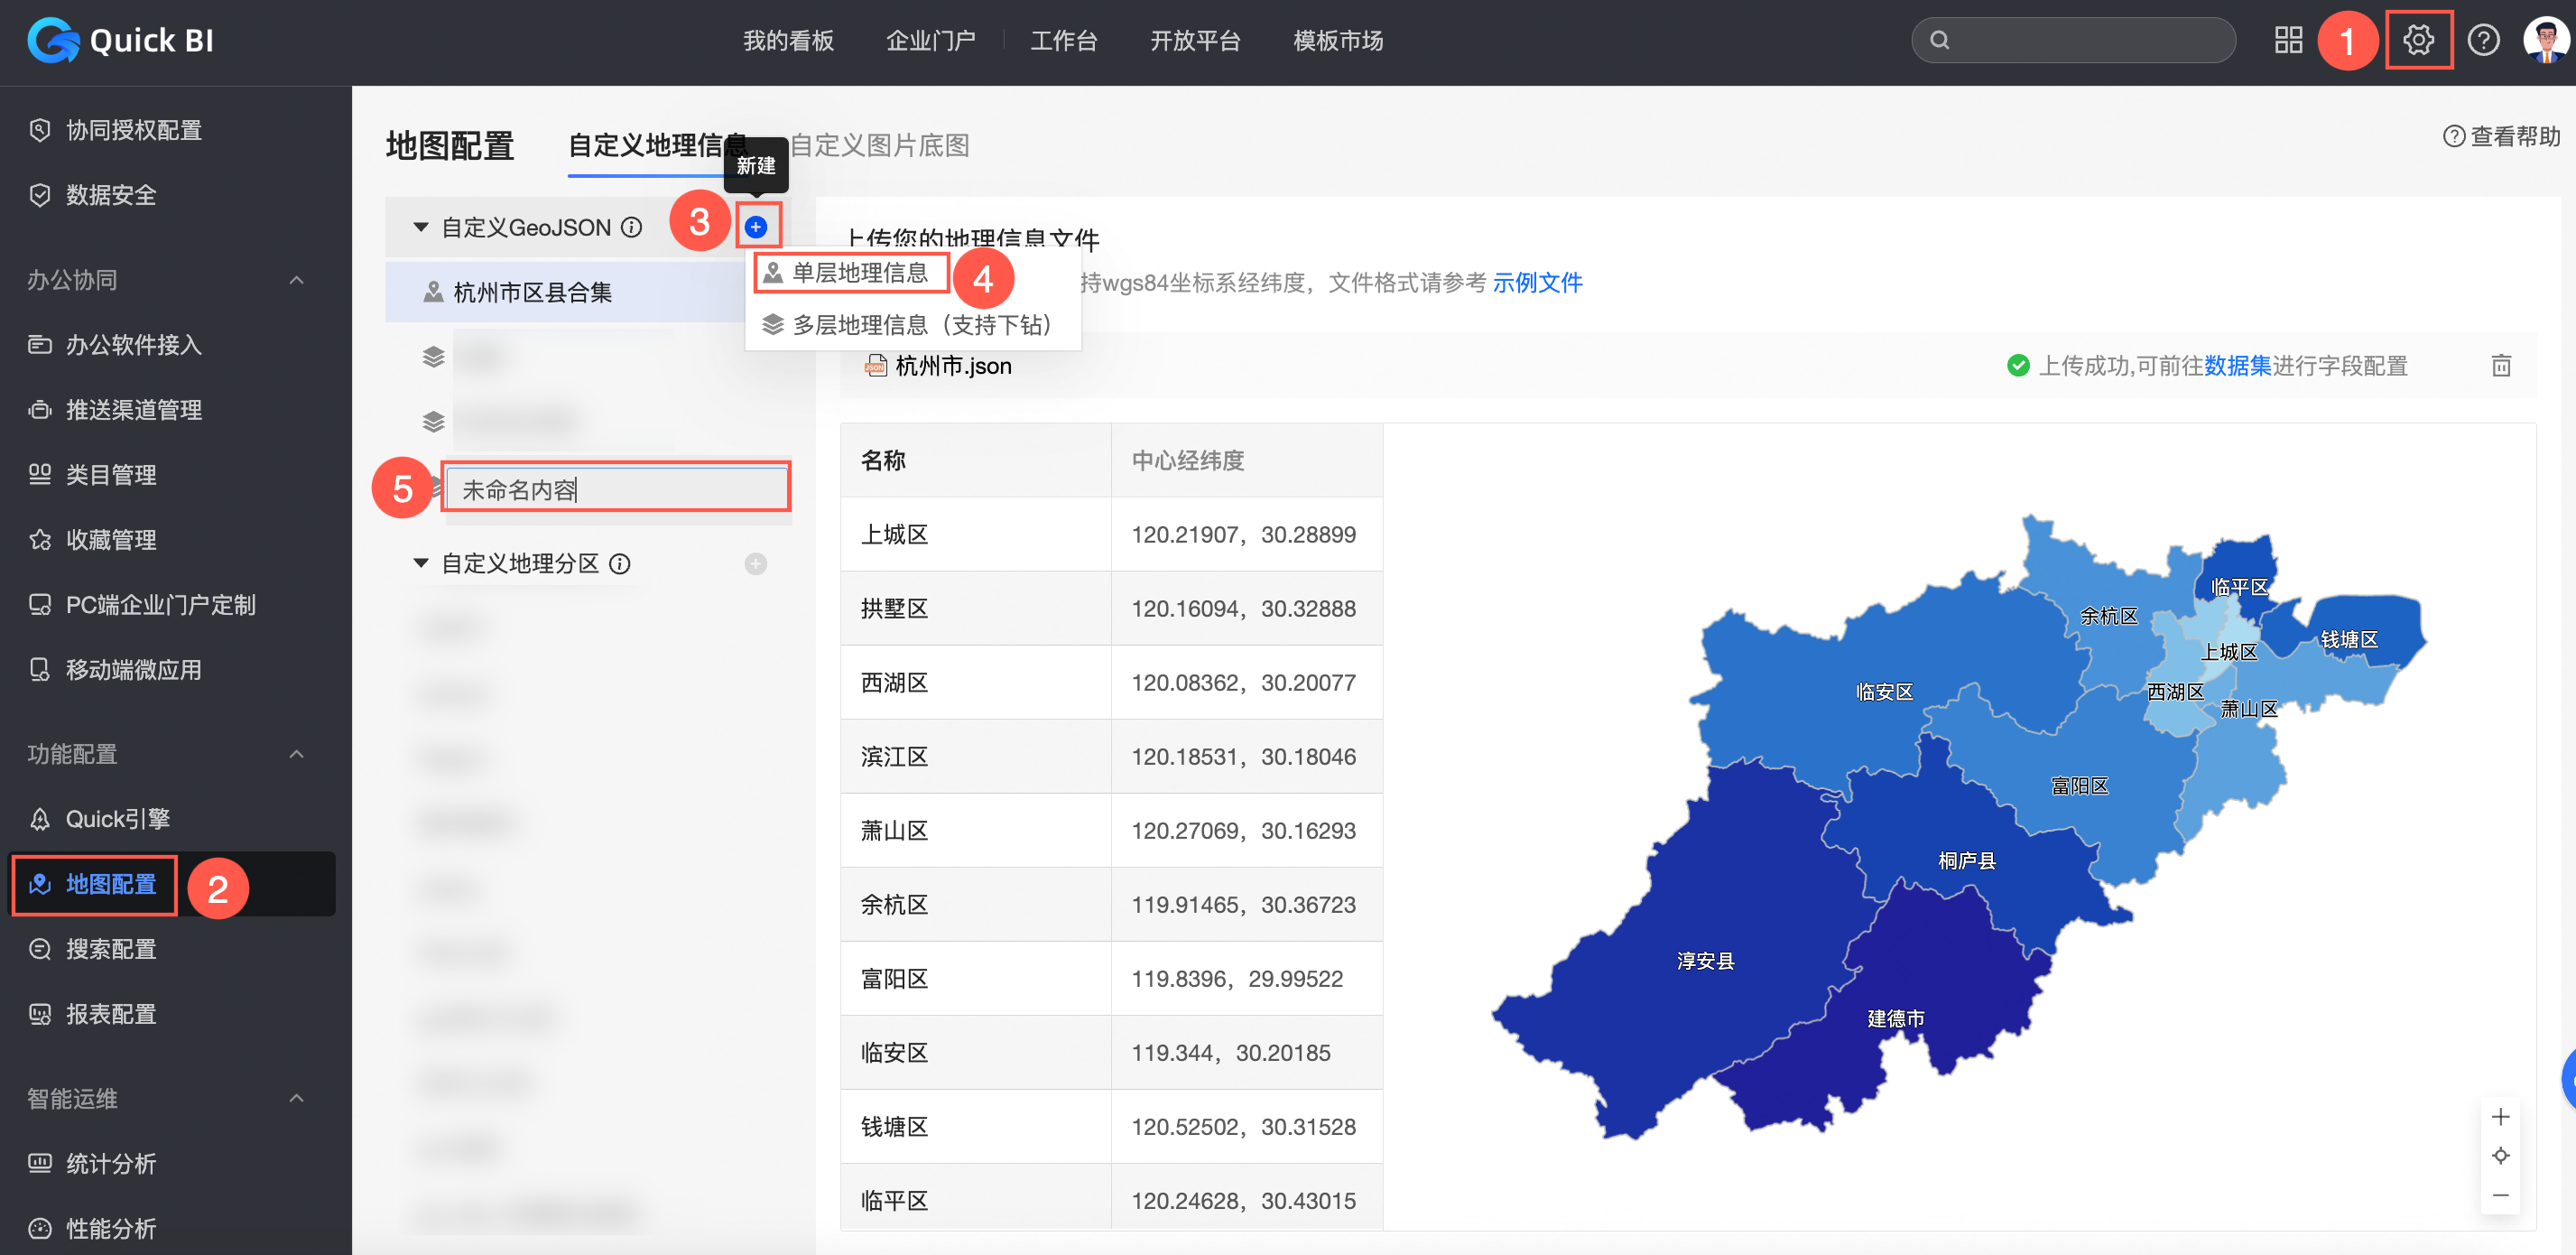
As an organization administrator, click New (③), select single-layer geographic information (④), and enter a custom name (⑤), as shown in the following figure.
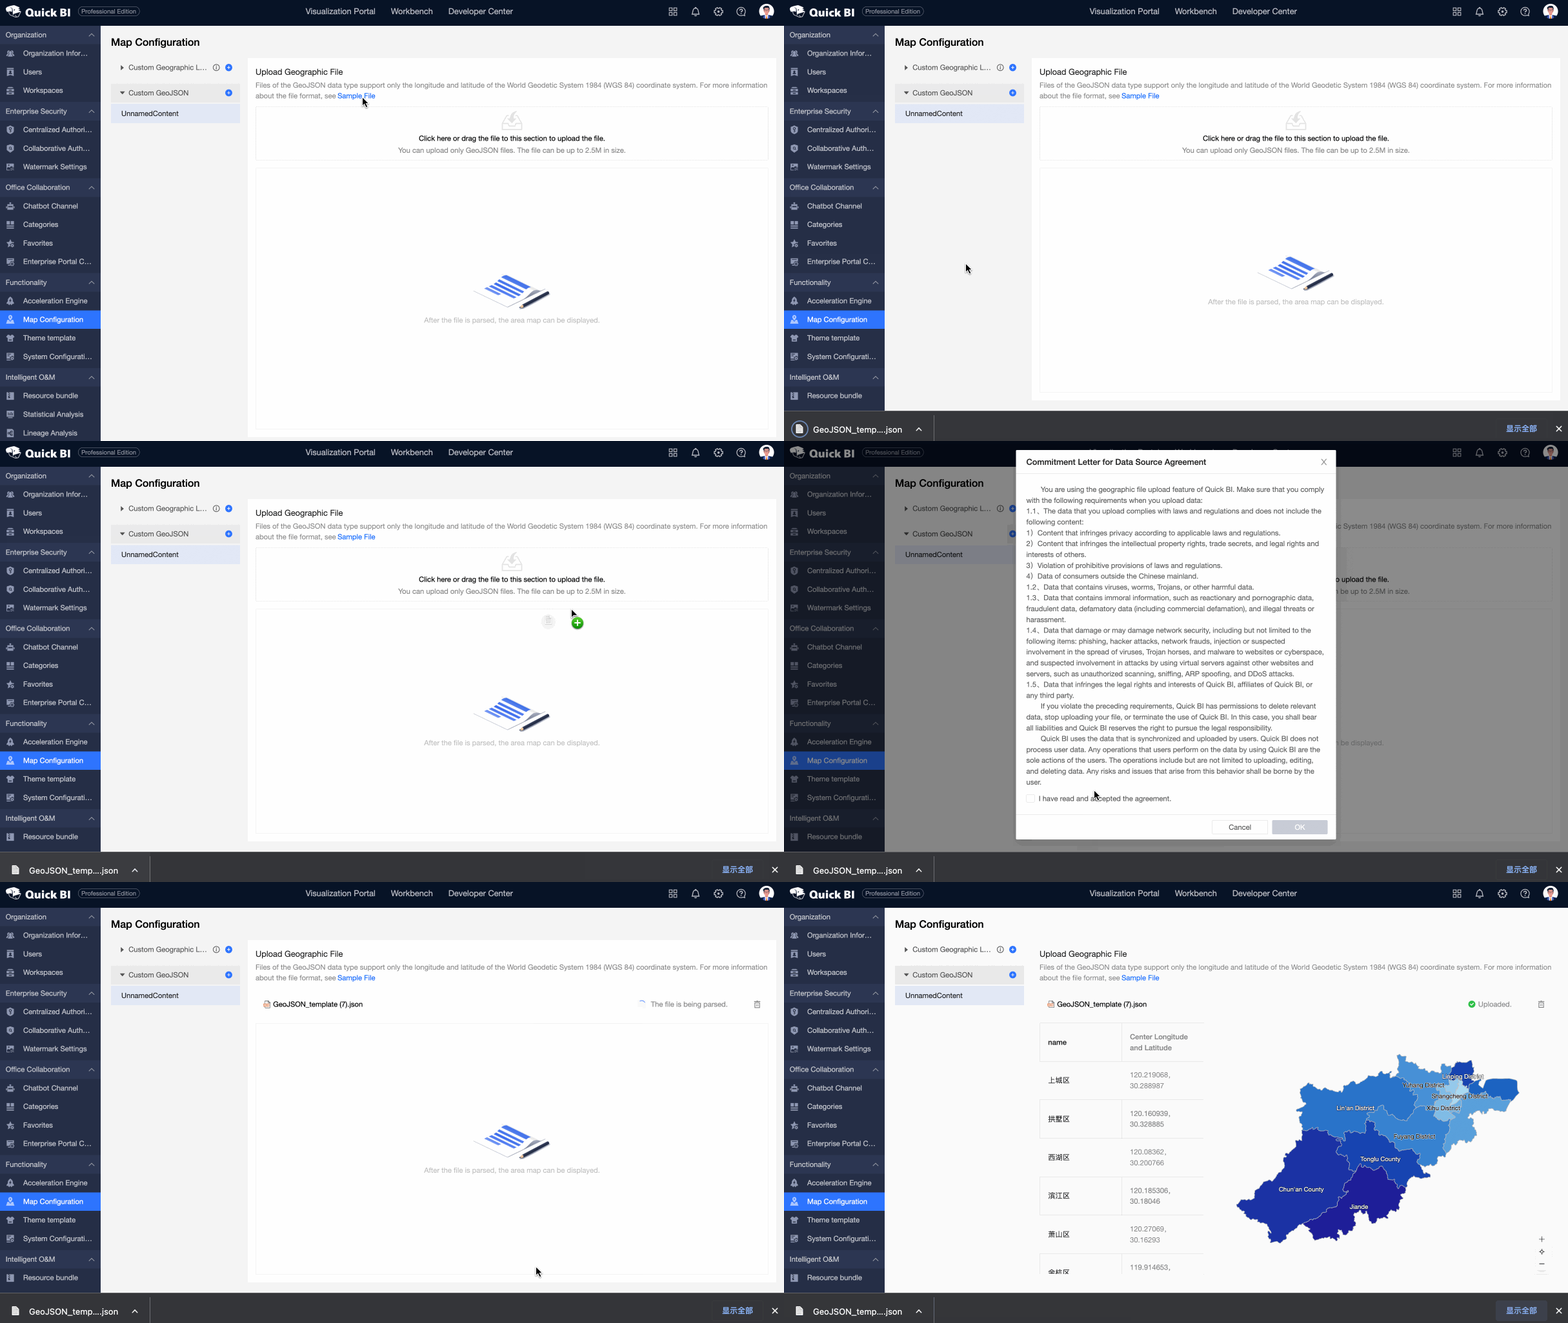
Select the target custom area and follow the steps in the figure to upload the geographic information.
Click or drag to upload a GeoJSON file. See the sample file for the required format.
You must review and accept the agreement before the upload can begin.
After the file is uploaded and parsed, you can verify the result in the preview area.
 Note
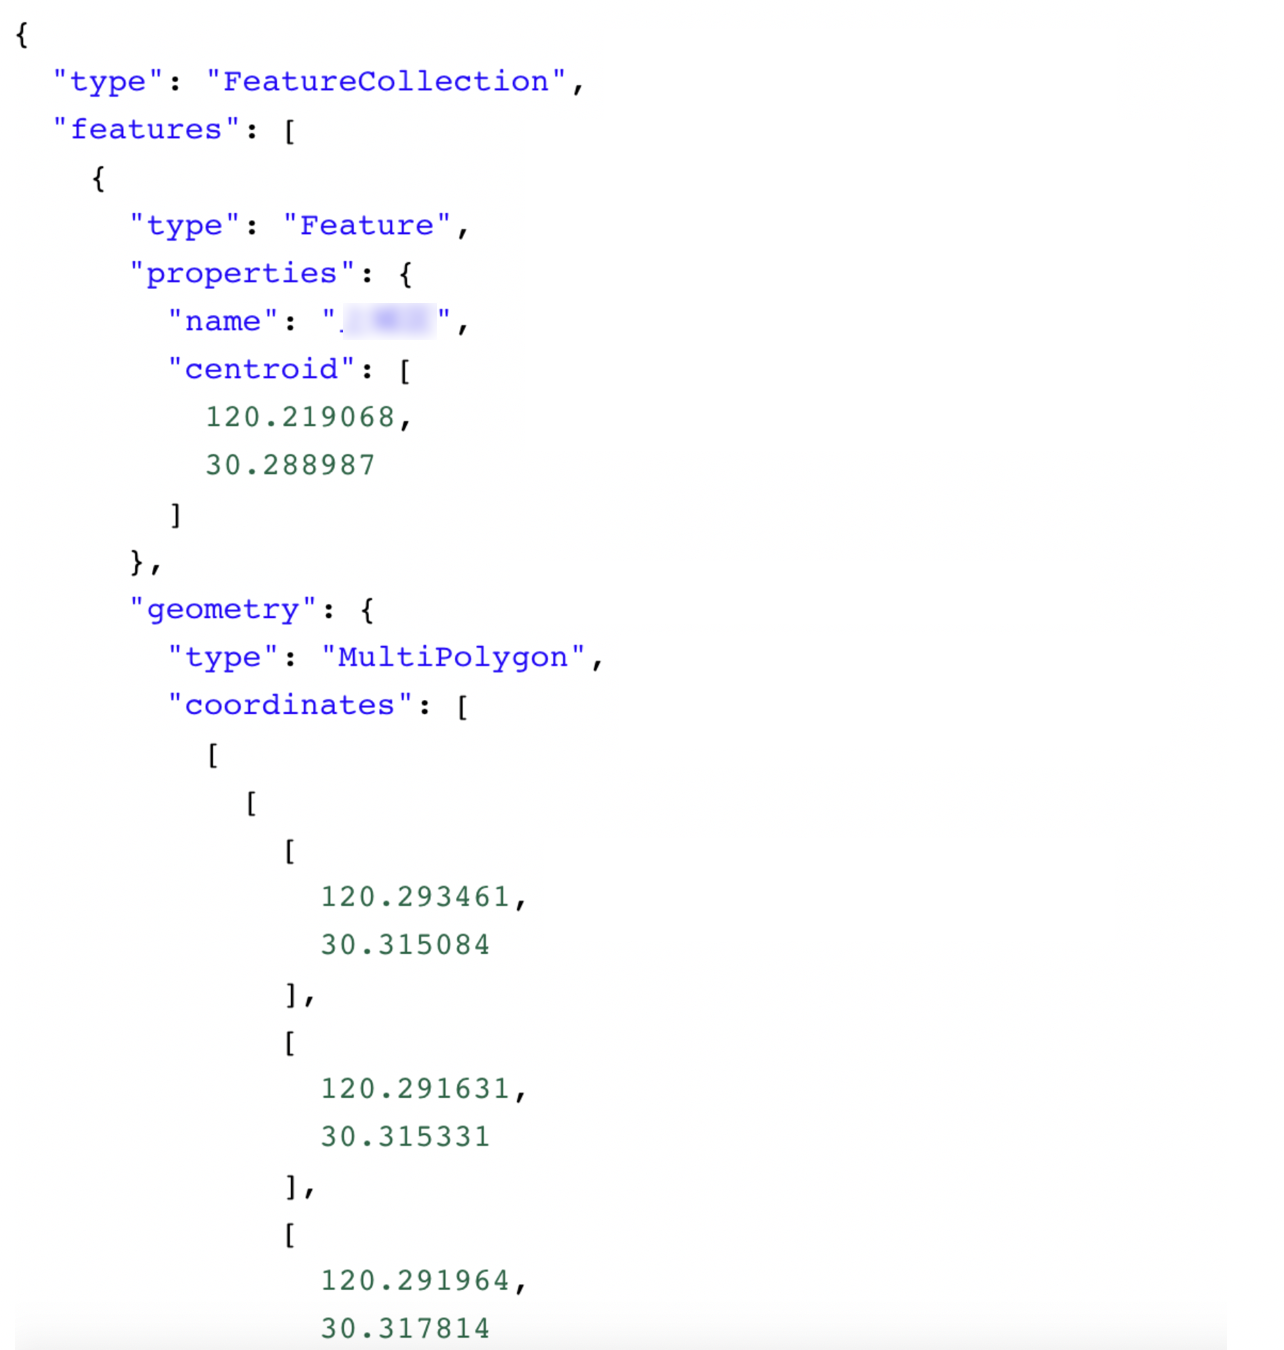
NoteThe GeoJSON file must use the format shown in the following figure:
You can also perform the following actions on the map configuration page:
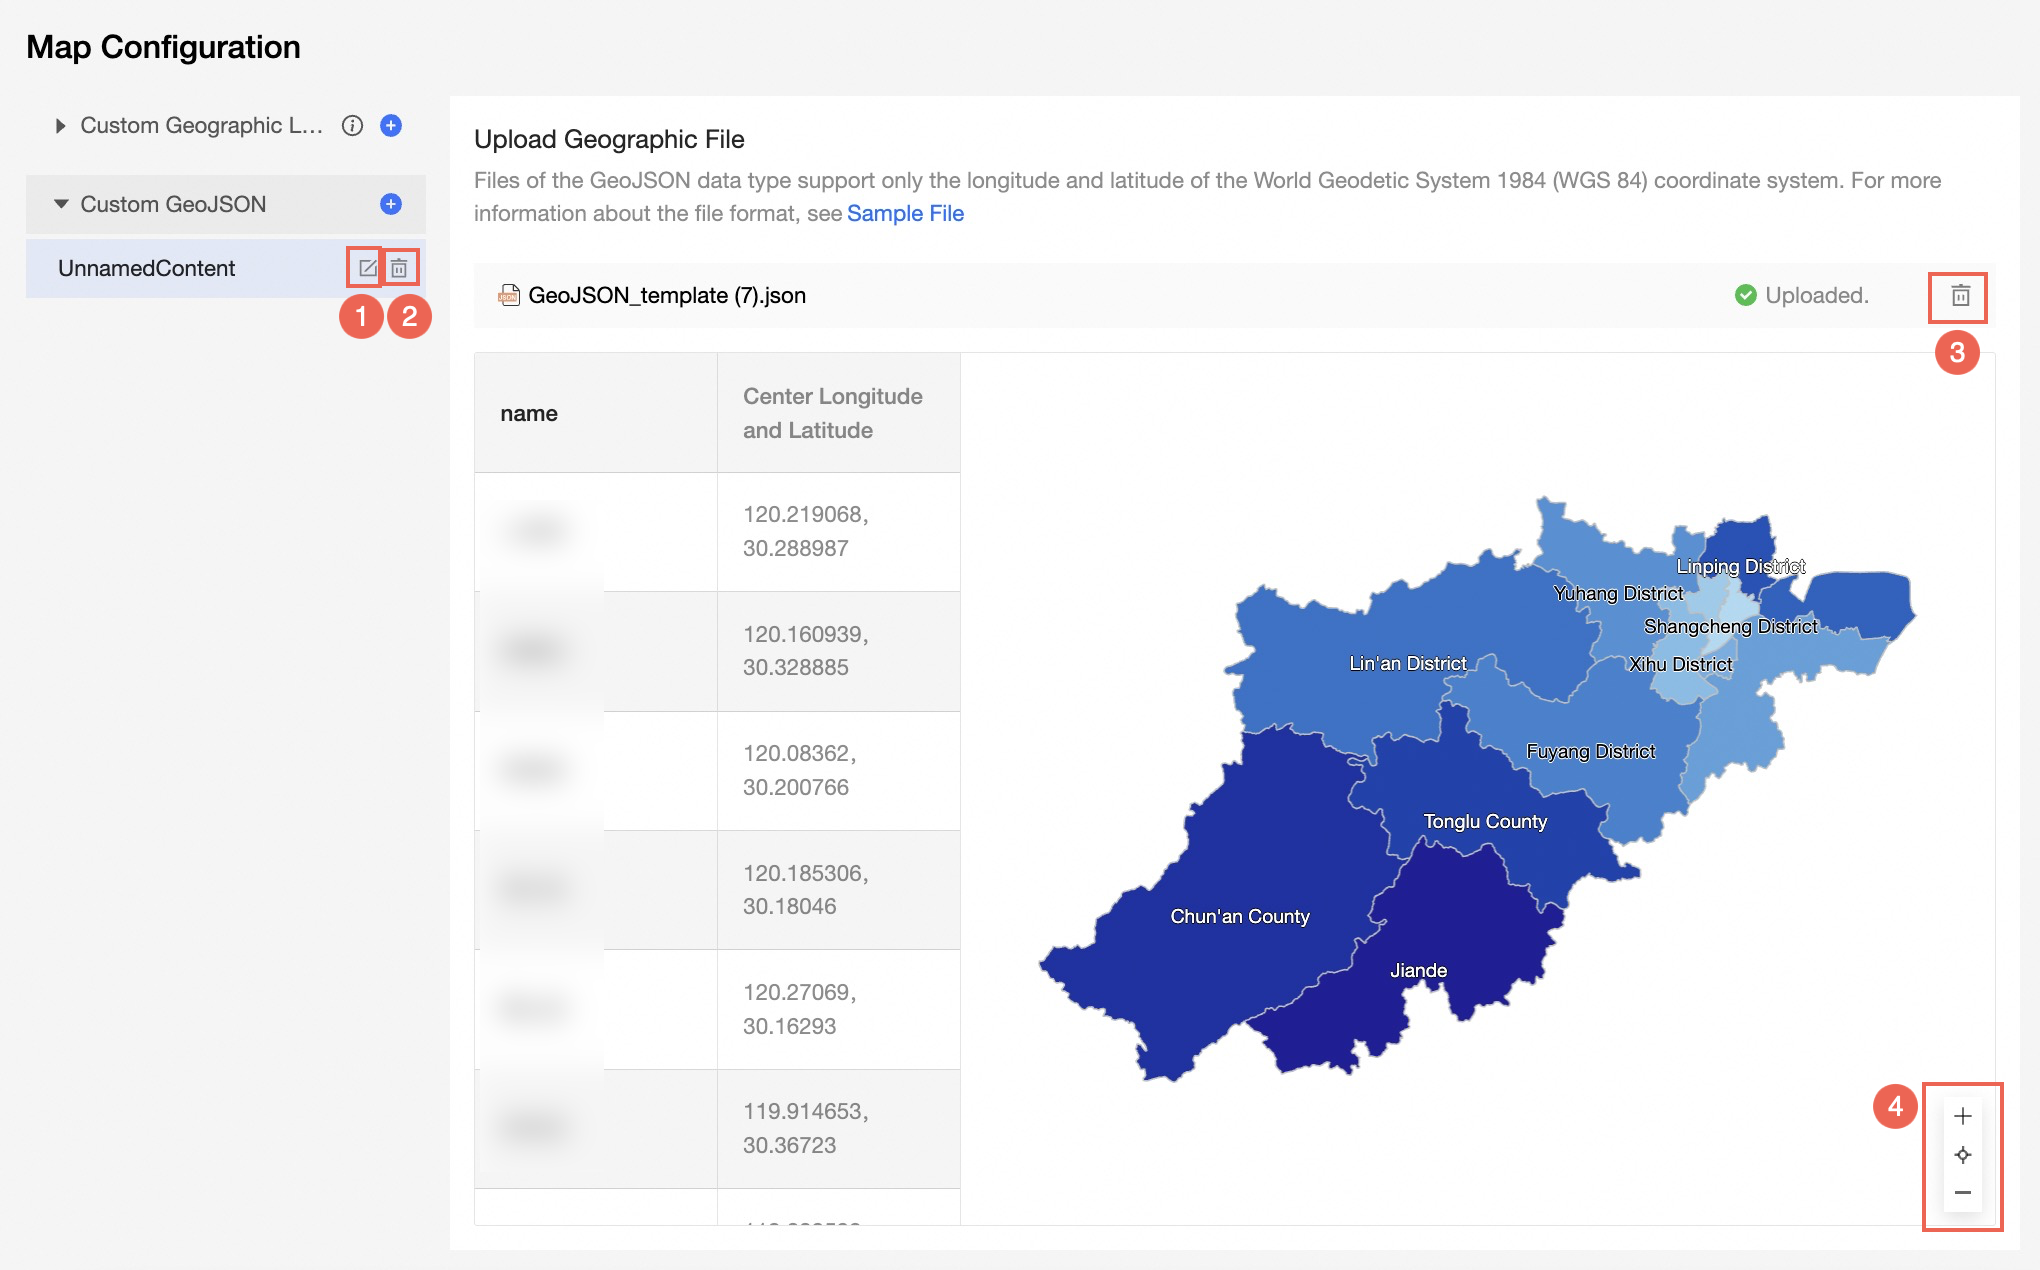
①: Rename the custom area.
②: Delete the custom area.
③: Delete the geographic information file.
④: Zoom in or out of the map sample.
Convert a geographic dimension field
Procedure
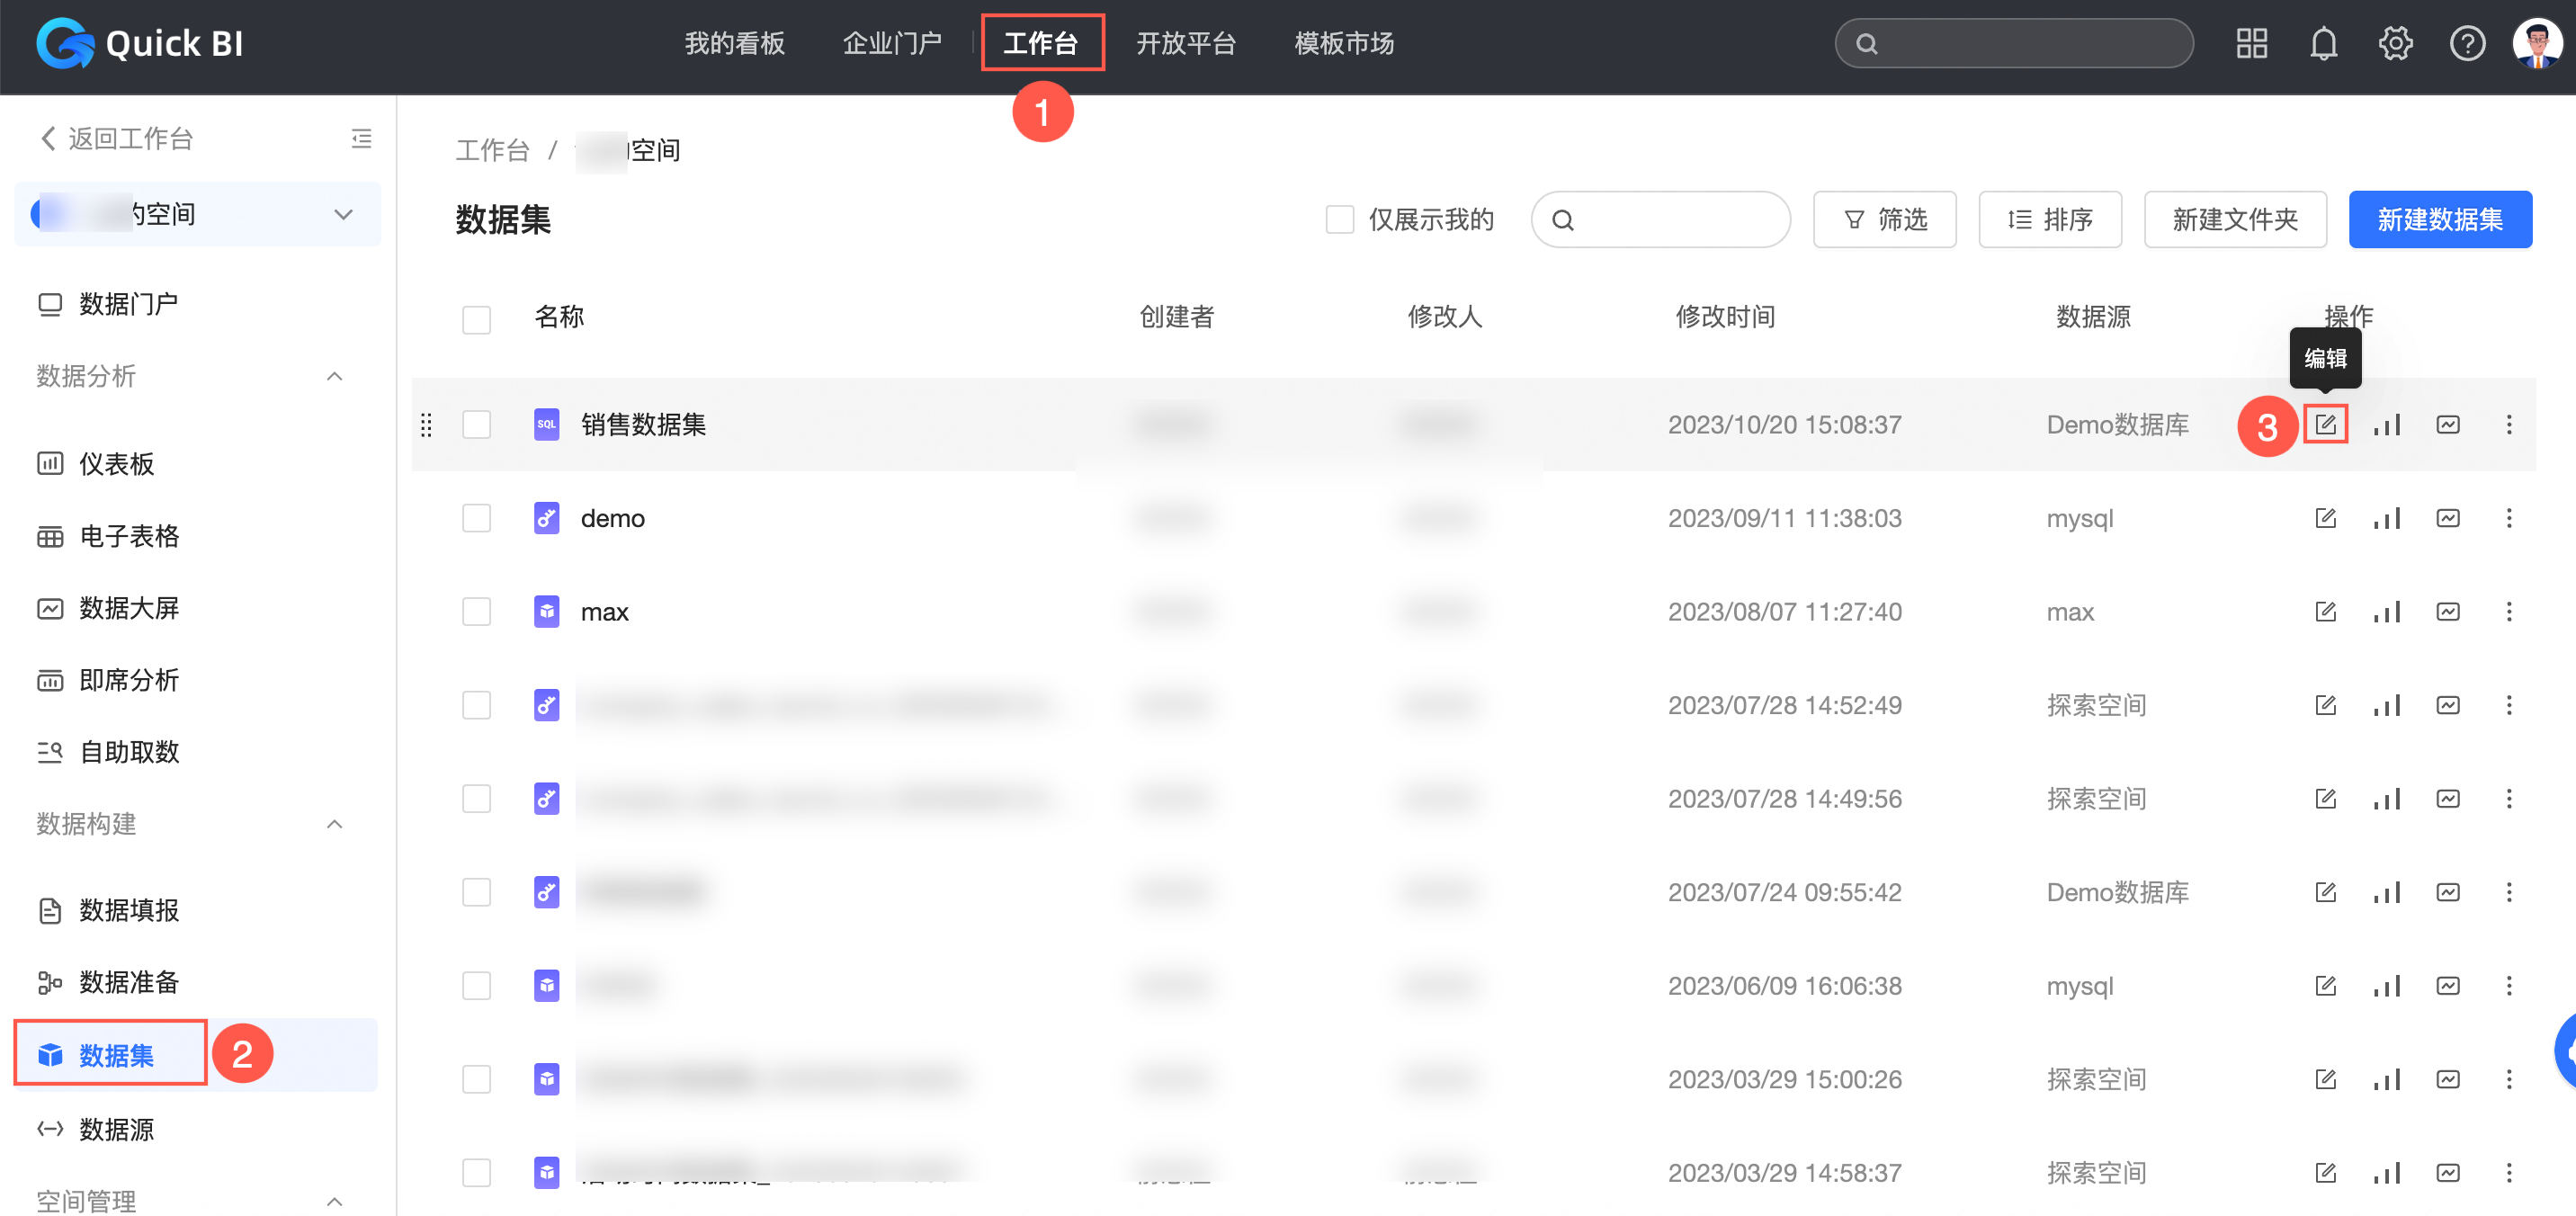
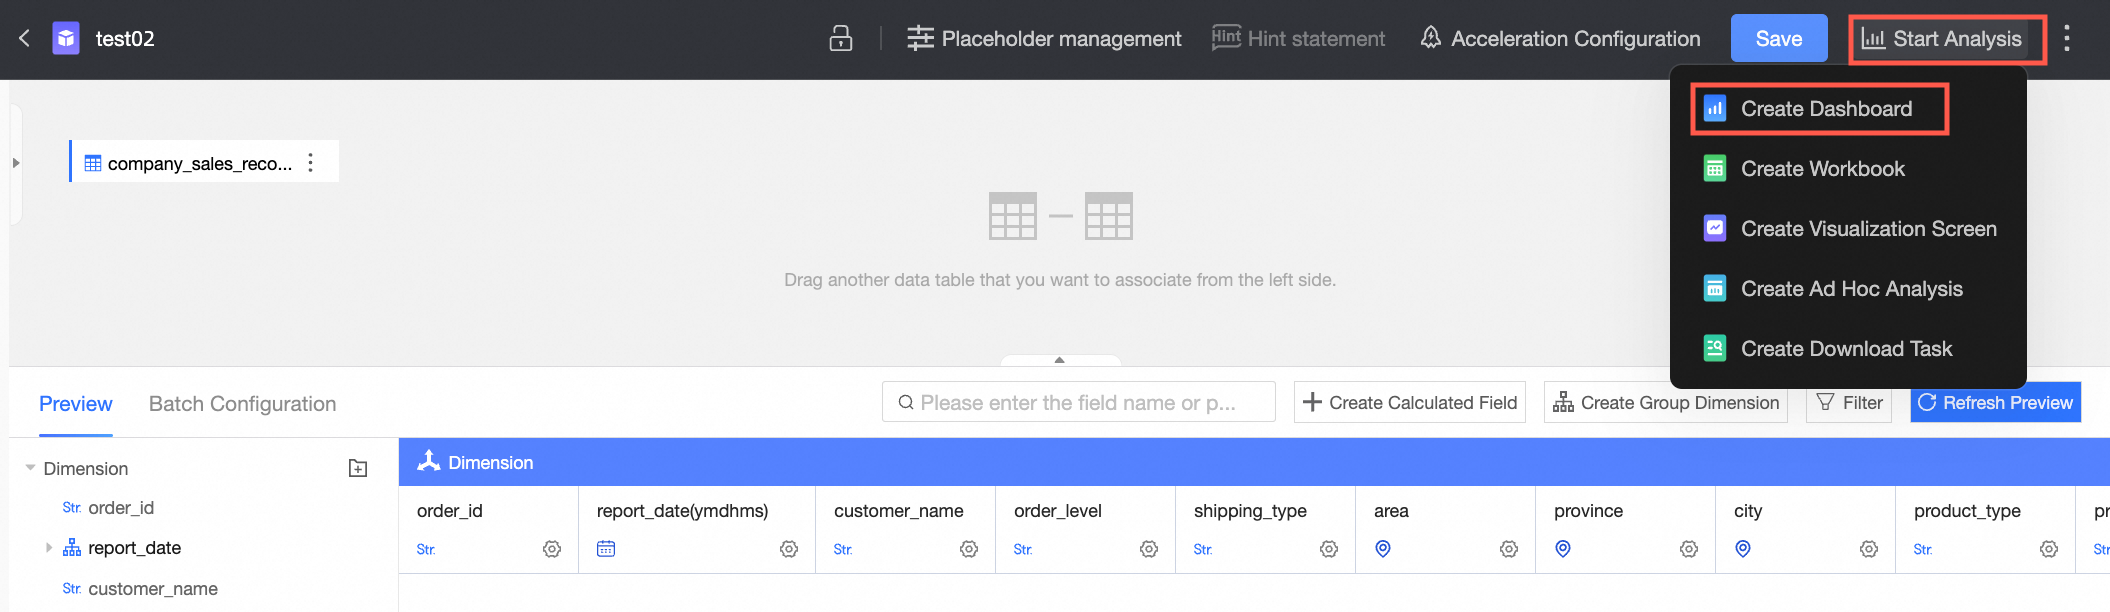
On the Quick BI homepage, navigate to the dataset edit page as shown in the figure.
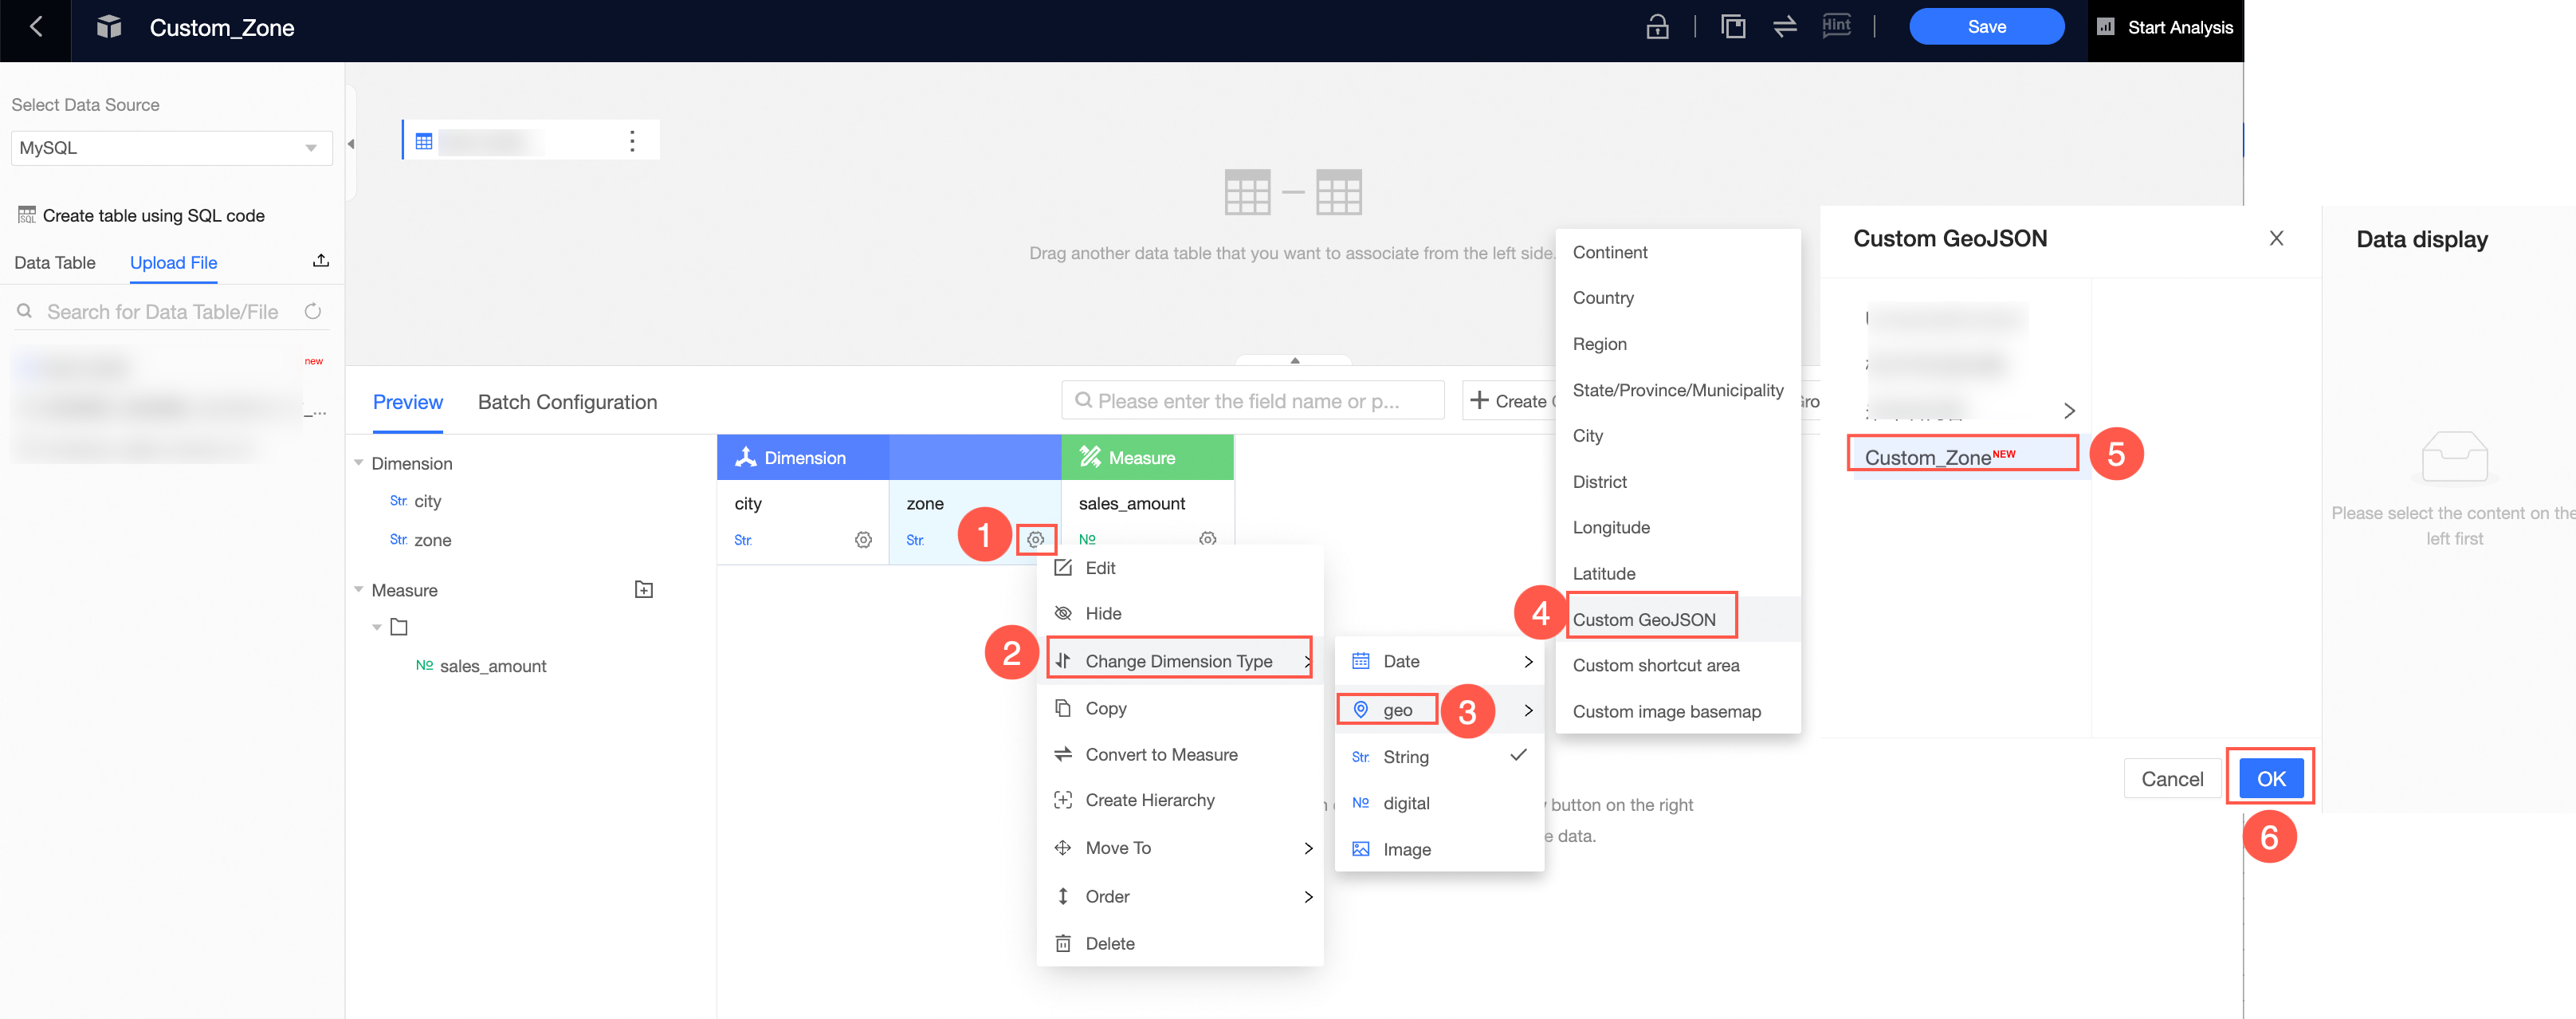
Change the Area Geographic Dimension field to custom GeoJSON. In the dialog box that opens, select Sales Data by Area.

When you finish editing, click Save in the upper-right corner.
Visualize the custom area on a map
The following example uses a choropleth map.
Procedure
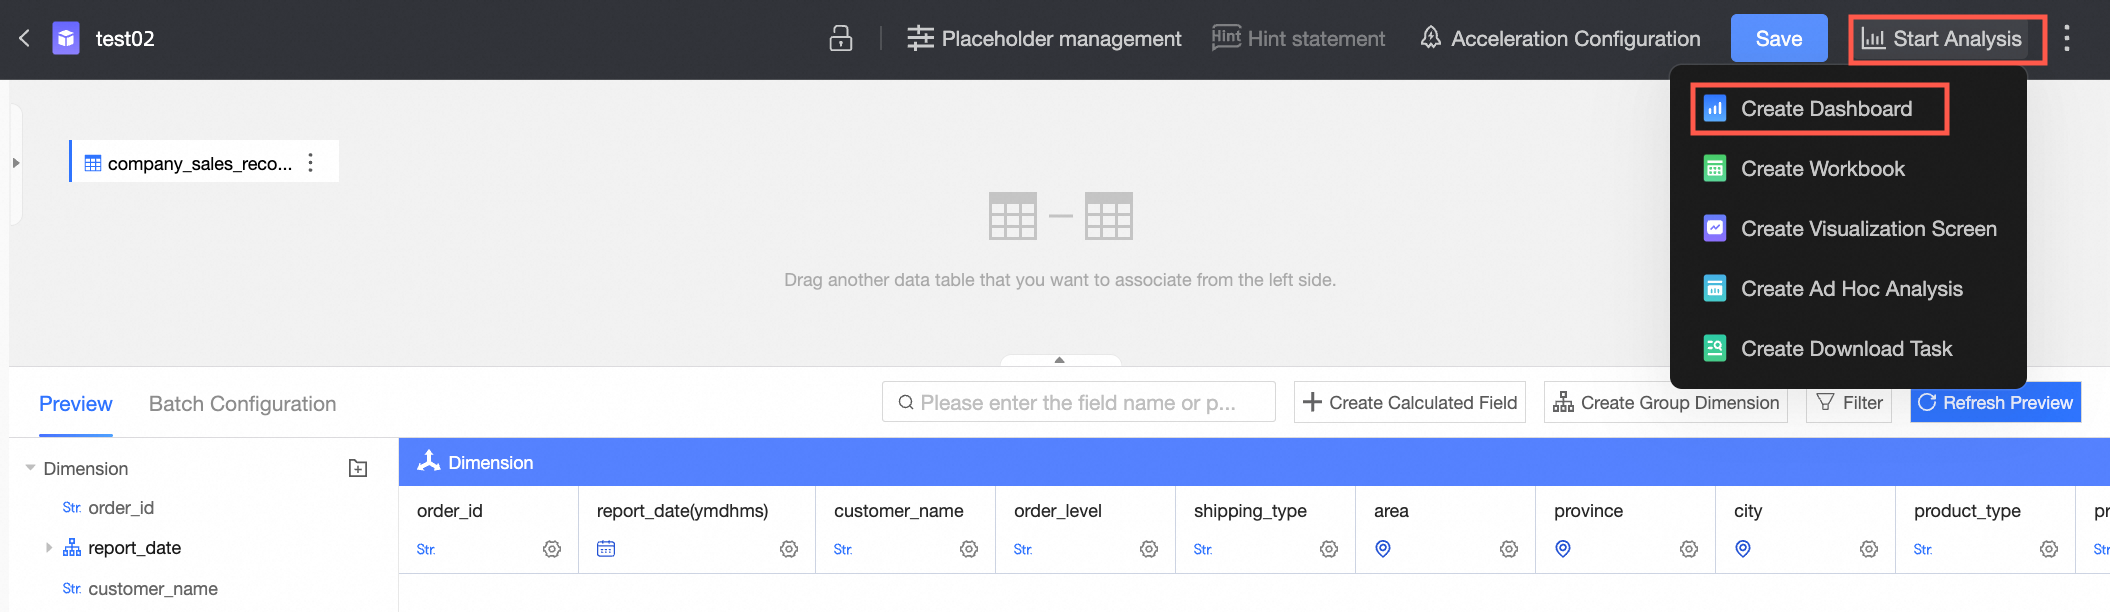
Create a dashboard
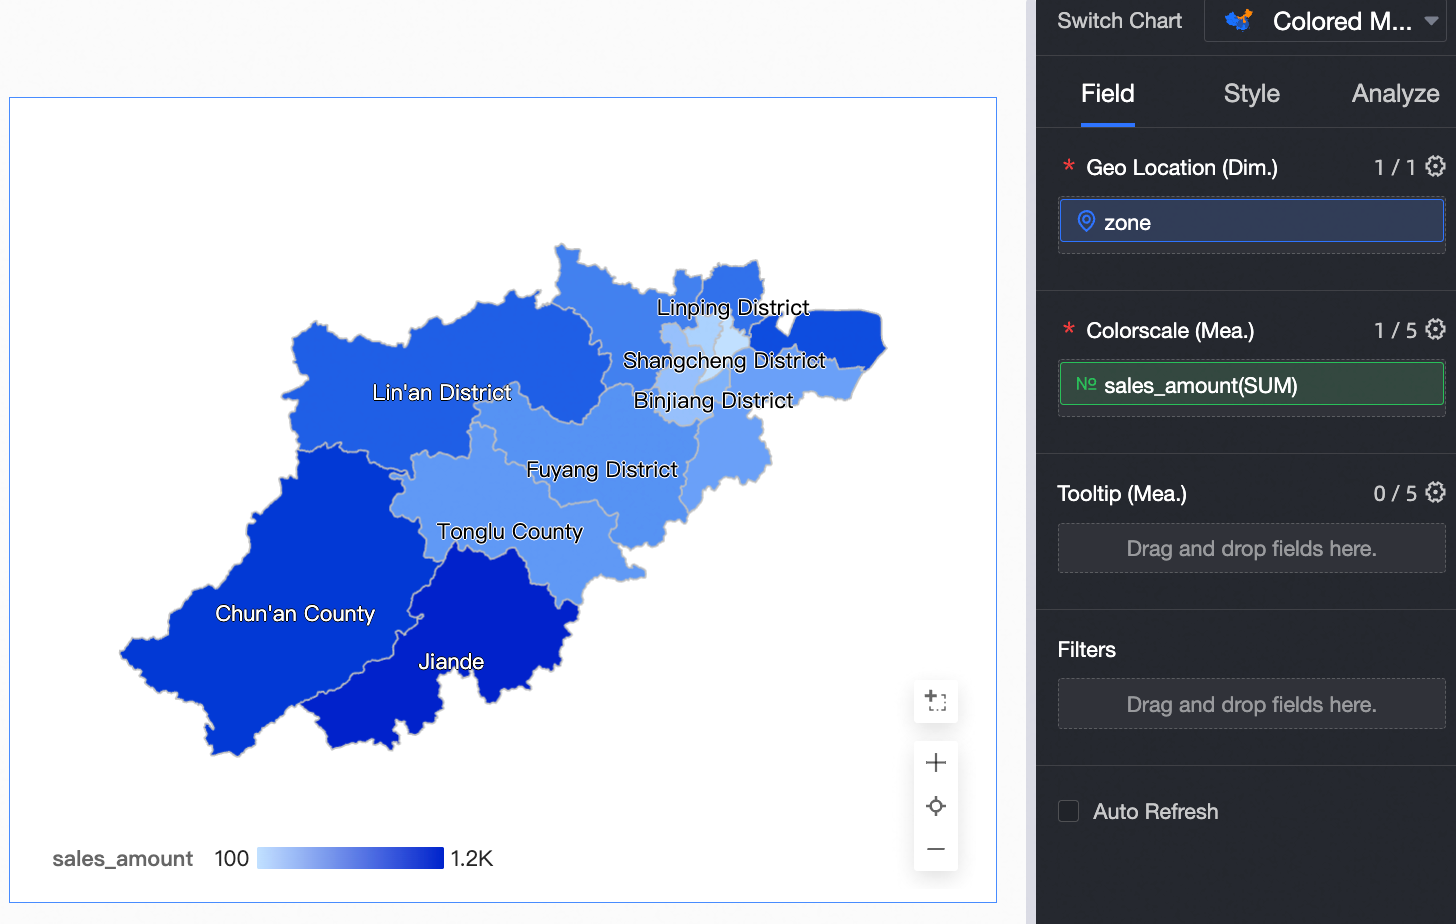
On the dashboard edit page, create a choropleth map. Drag the custom area field to Geographic Area/Dimension and the sales amount field to Color Saturation/Measure. The map now displays data for your custom area.
Multi-layer geographic information
Create a custom area
Log on to the Quick BI console.
As an organization administrator, click New (③), select multi-layer geographic information (④), and enter a custom name (⑤), as shown in the following figure.
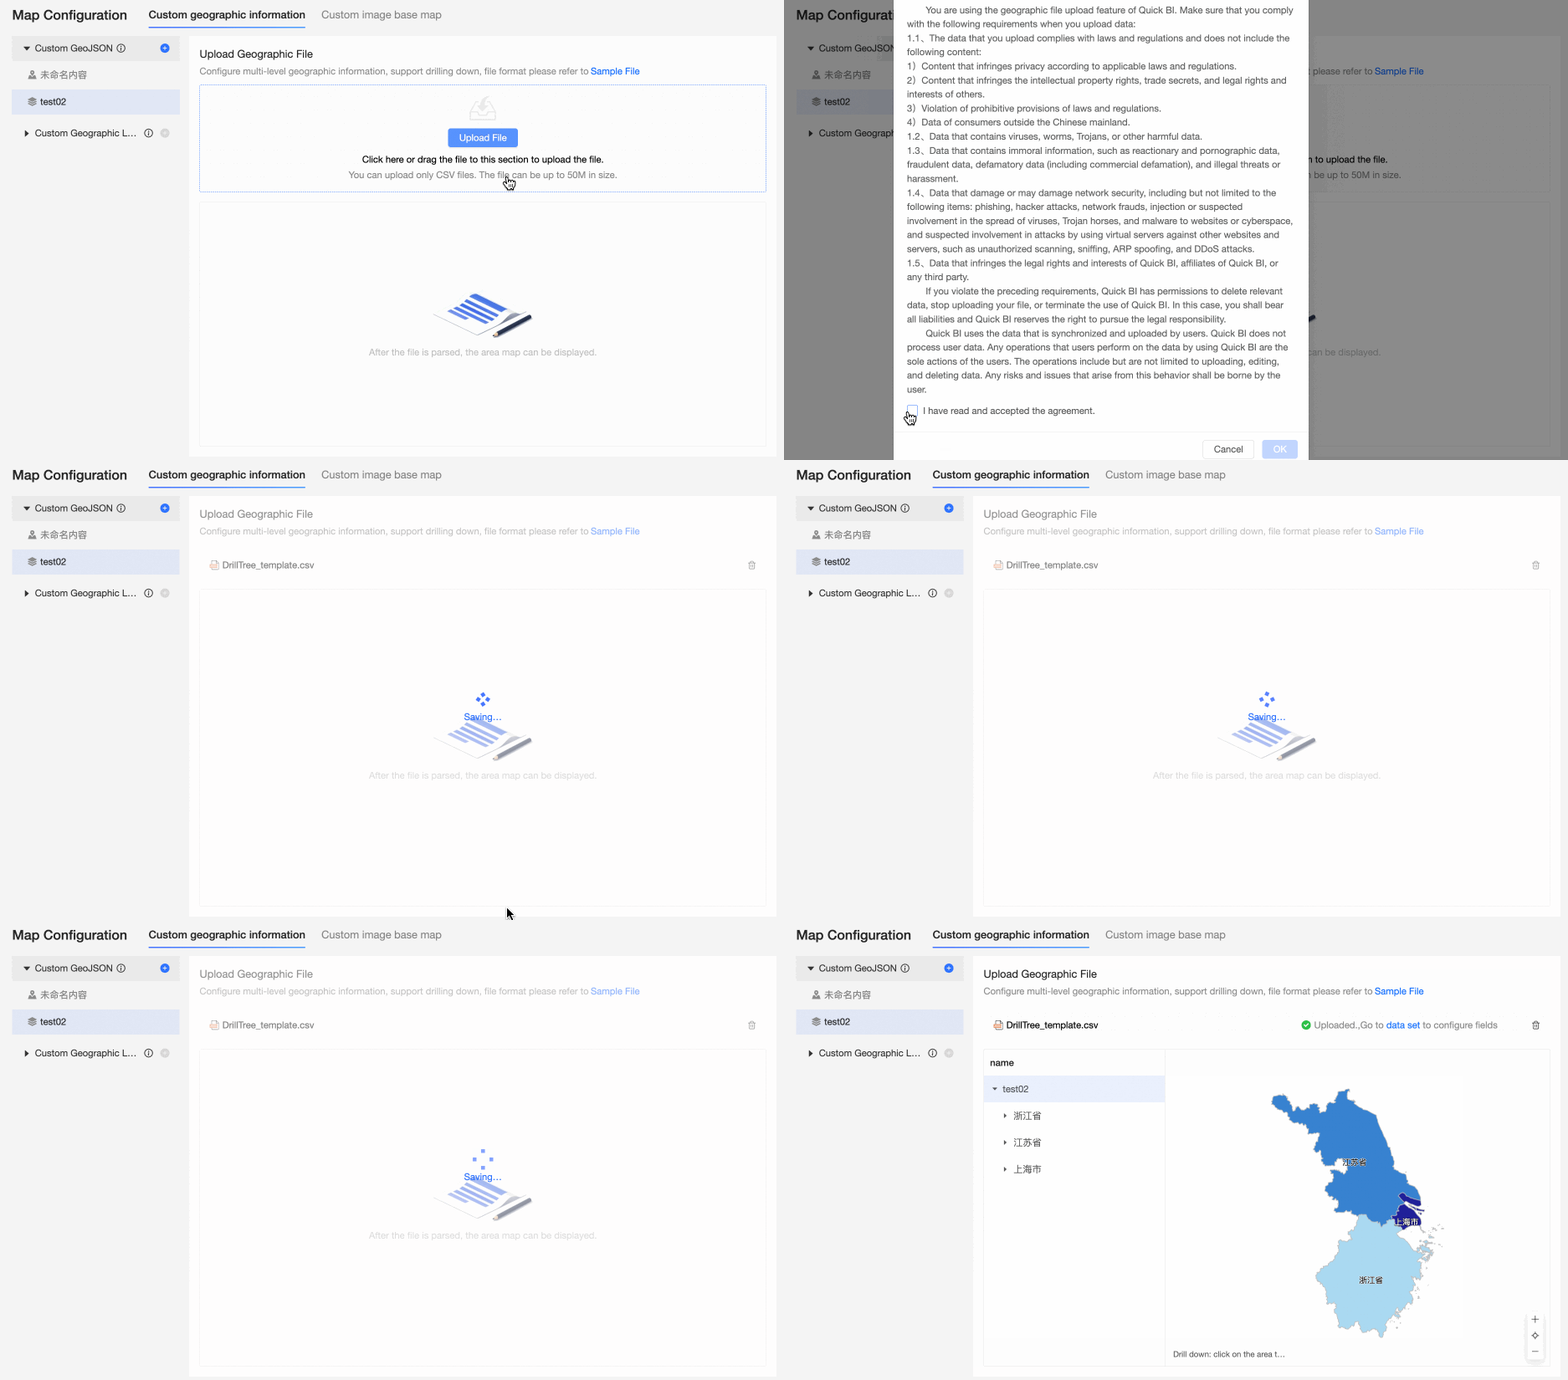
Select the target custom area and follow the steps in the figure to upload the geographic information.
Click or drag to upload a CSV file. See the sample file for the required format.
You must review and accept the agreement before the upload can begin.
After the file is uploaded and parsed, you can verify the result in the preview area.
NoteThe CSV file must use the following format:
area name: The name of the area, such as Jiangsu Province.
level: The level in the hierarchy, starting from 0 for the top level.
level index: A unique index for the area within the hierarchy. For example,
0-0represents the first area in the first level. Similarly,0-0-0represents the first sub-area within the0-0area (for example, Nanjing City within Jiangsu Province).area center point: The center point of the area, defined in GeoJSON format as a single point. The
coordinatesvalue represents the longitude and latitude of the center point. Example:{"type":"Point","coordinates":[119.486506,32.983991]}area boundary: The boundary of the area, defined in GeoJSON format as a
PolygonorMultiPolygon. Thecoordinatesvalue is an array of longitude and latitude points that define the boundary. Example:{"type":"MultiPolygon","coordinates":[[[[118.408205,34.435512]...[118.40495,34.42774],[118.395184,34.427053],[118.379974,34.415545],[118.353203,34.417435],[118.352248,34.422845],[118.320931,34.421342]]]]}
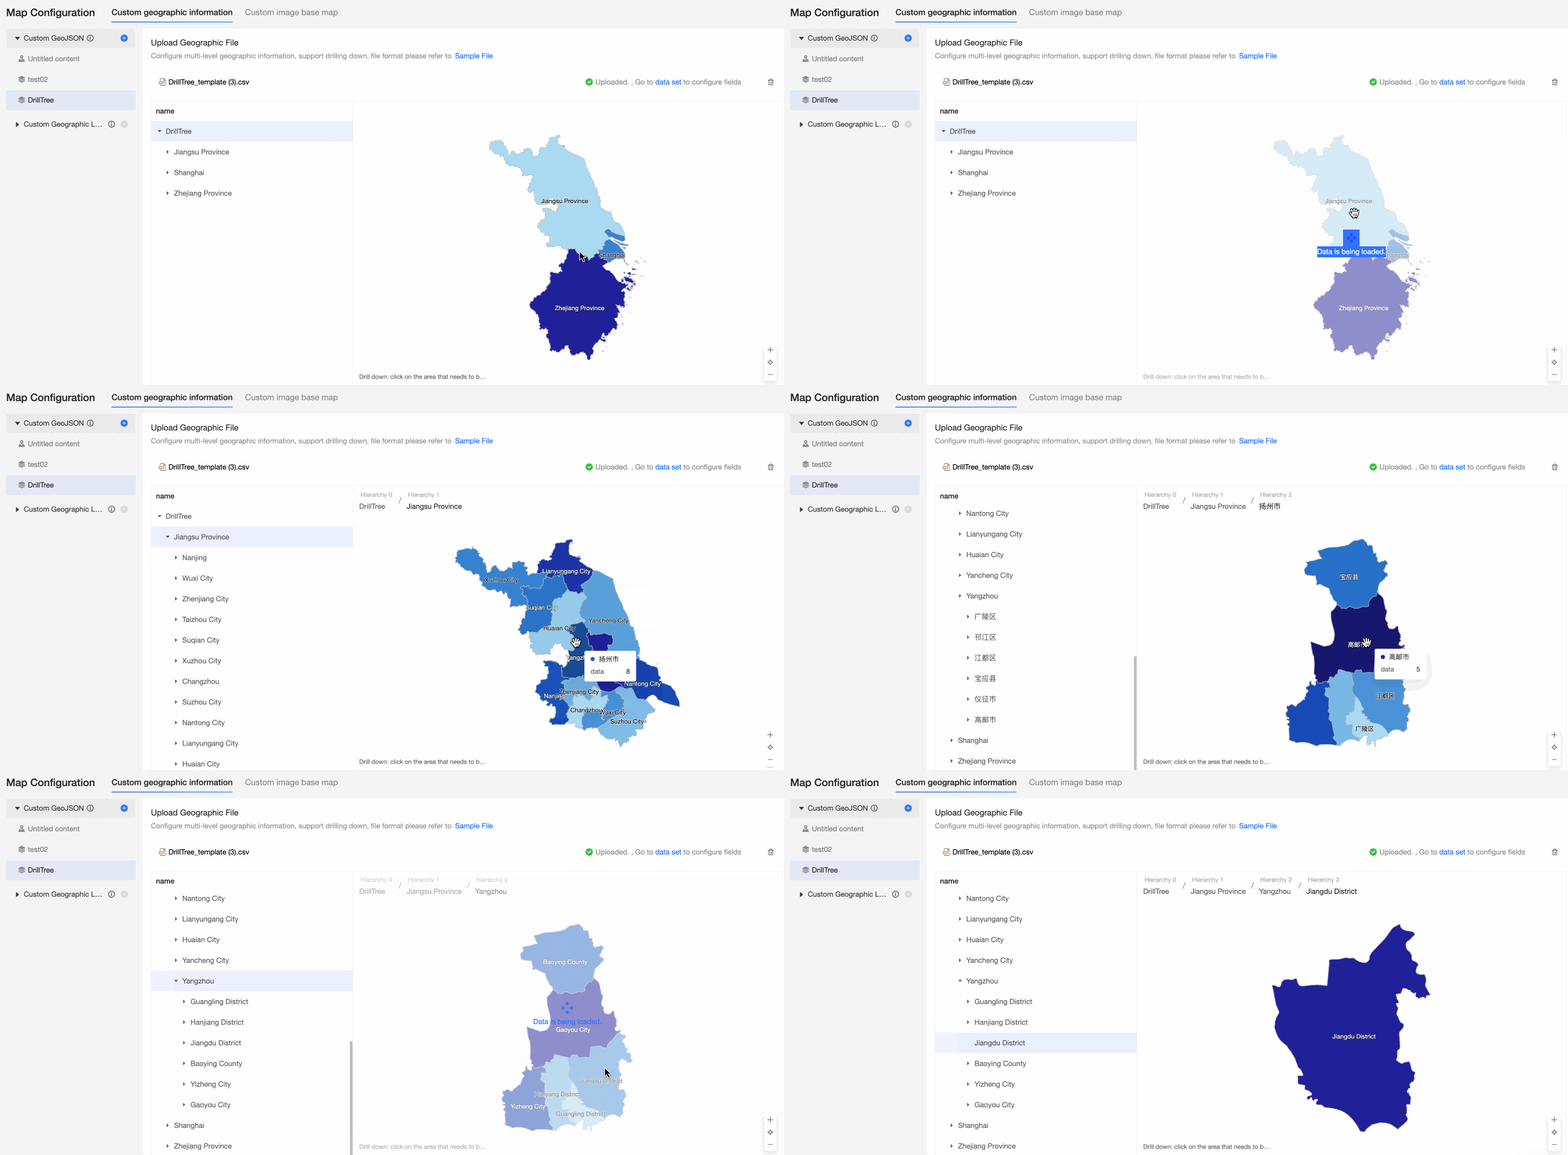
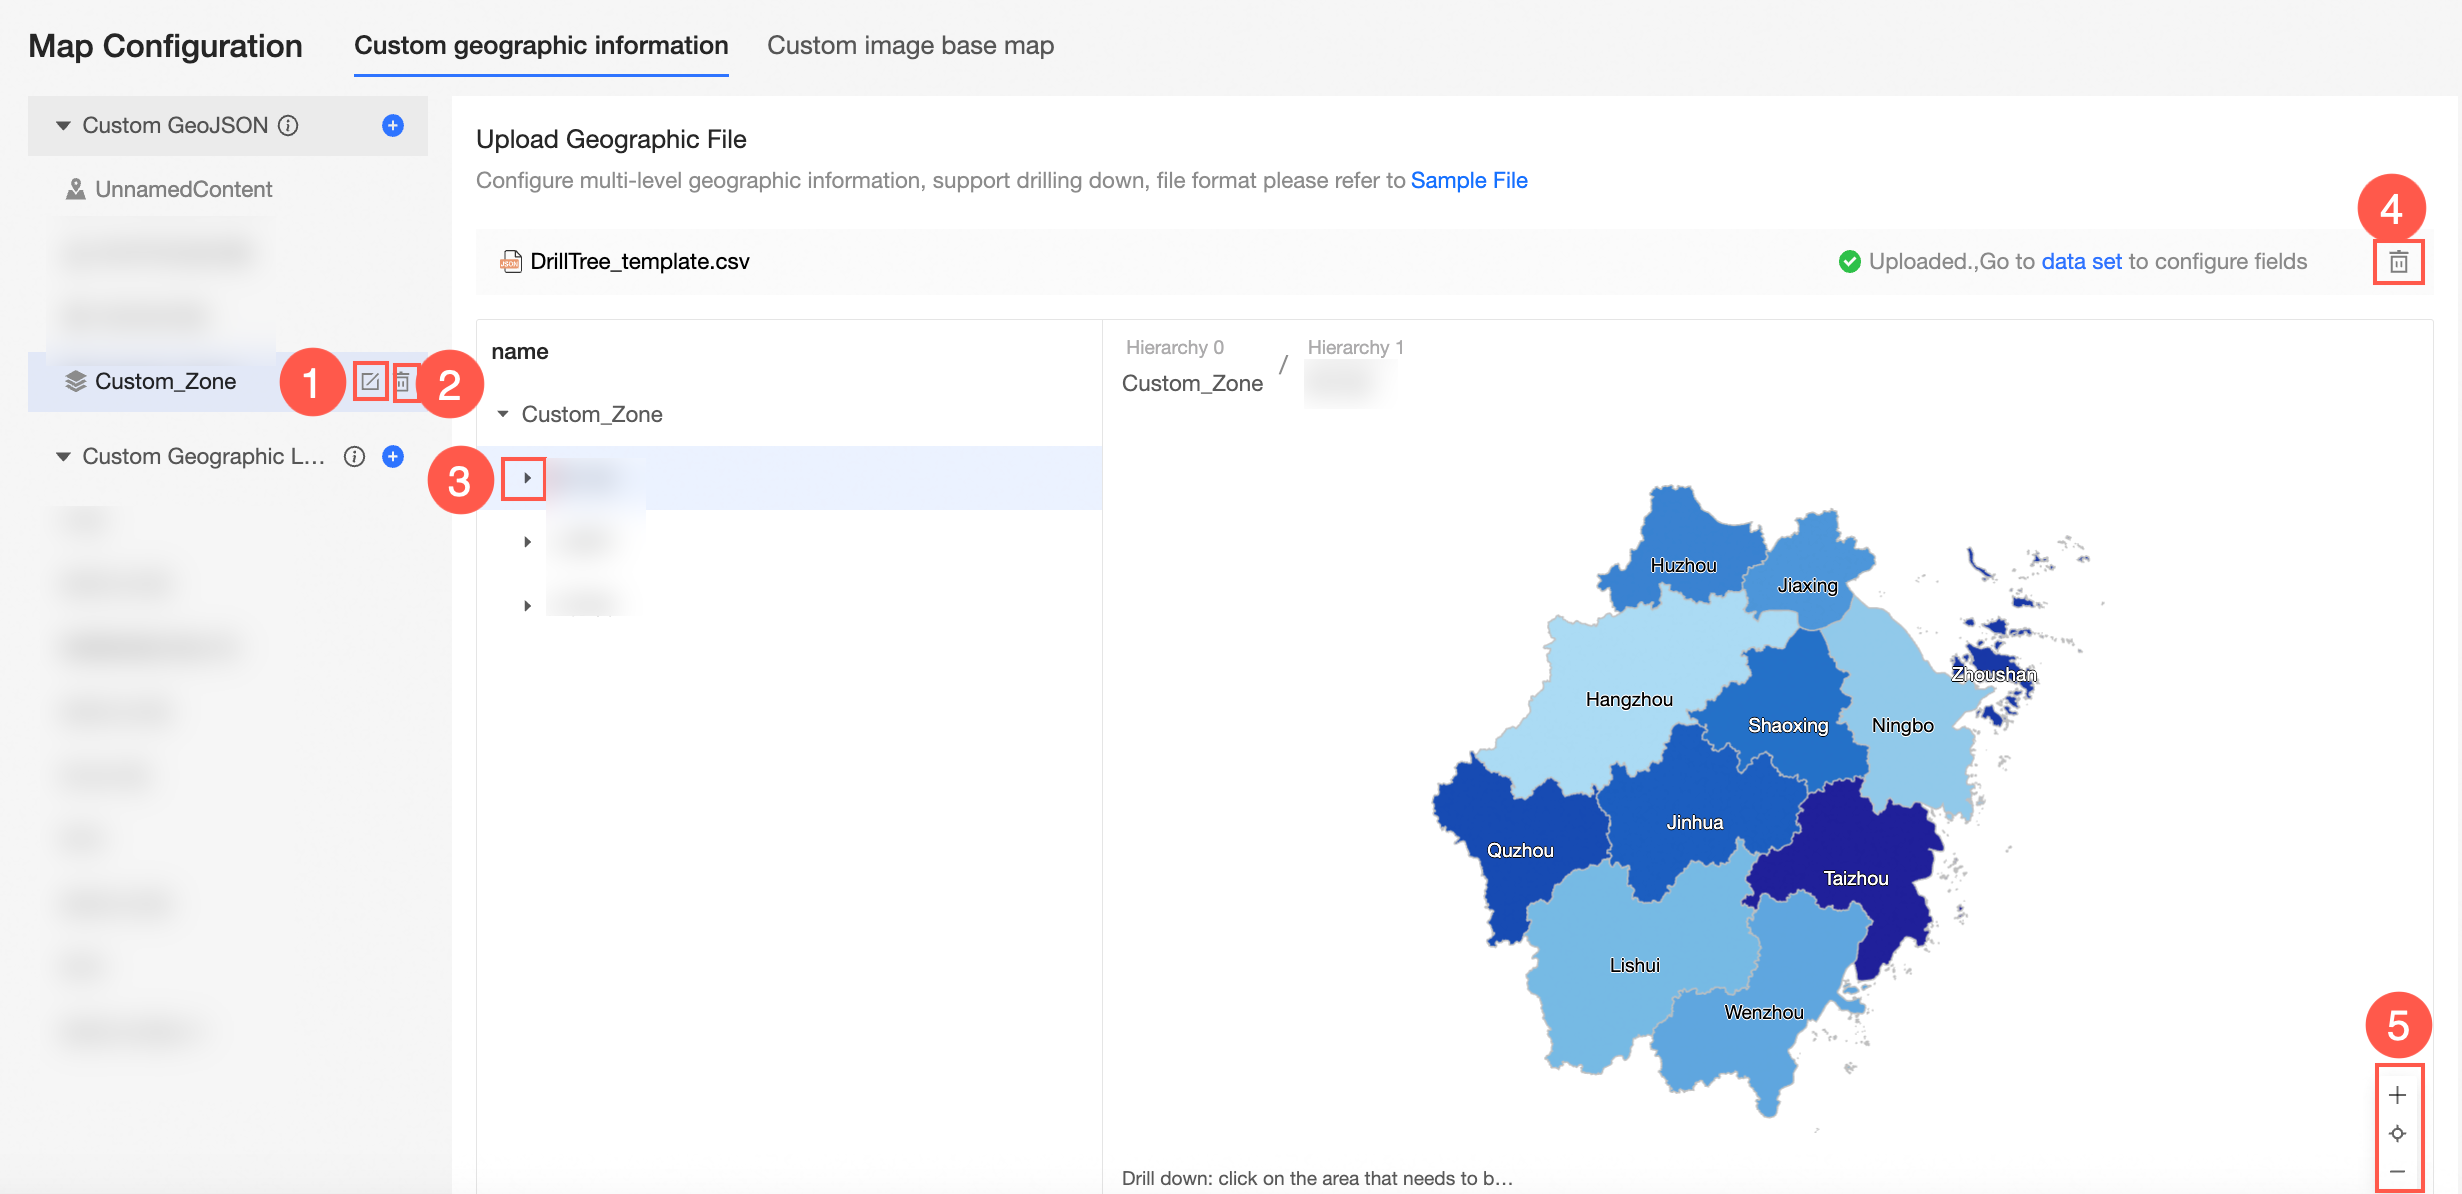
When configuring multi-layer geographic information, you can click an area in the preview to drill down and view its sub-levels.
You can also perform the following actions on the map configuration page:
①: Rename the custom area.
②: Delete the custom area.
③: Expand a node to view the information of the next level.
④: Delete the geographic information file.
⑤: Zoom in or out of the map sample.
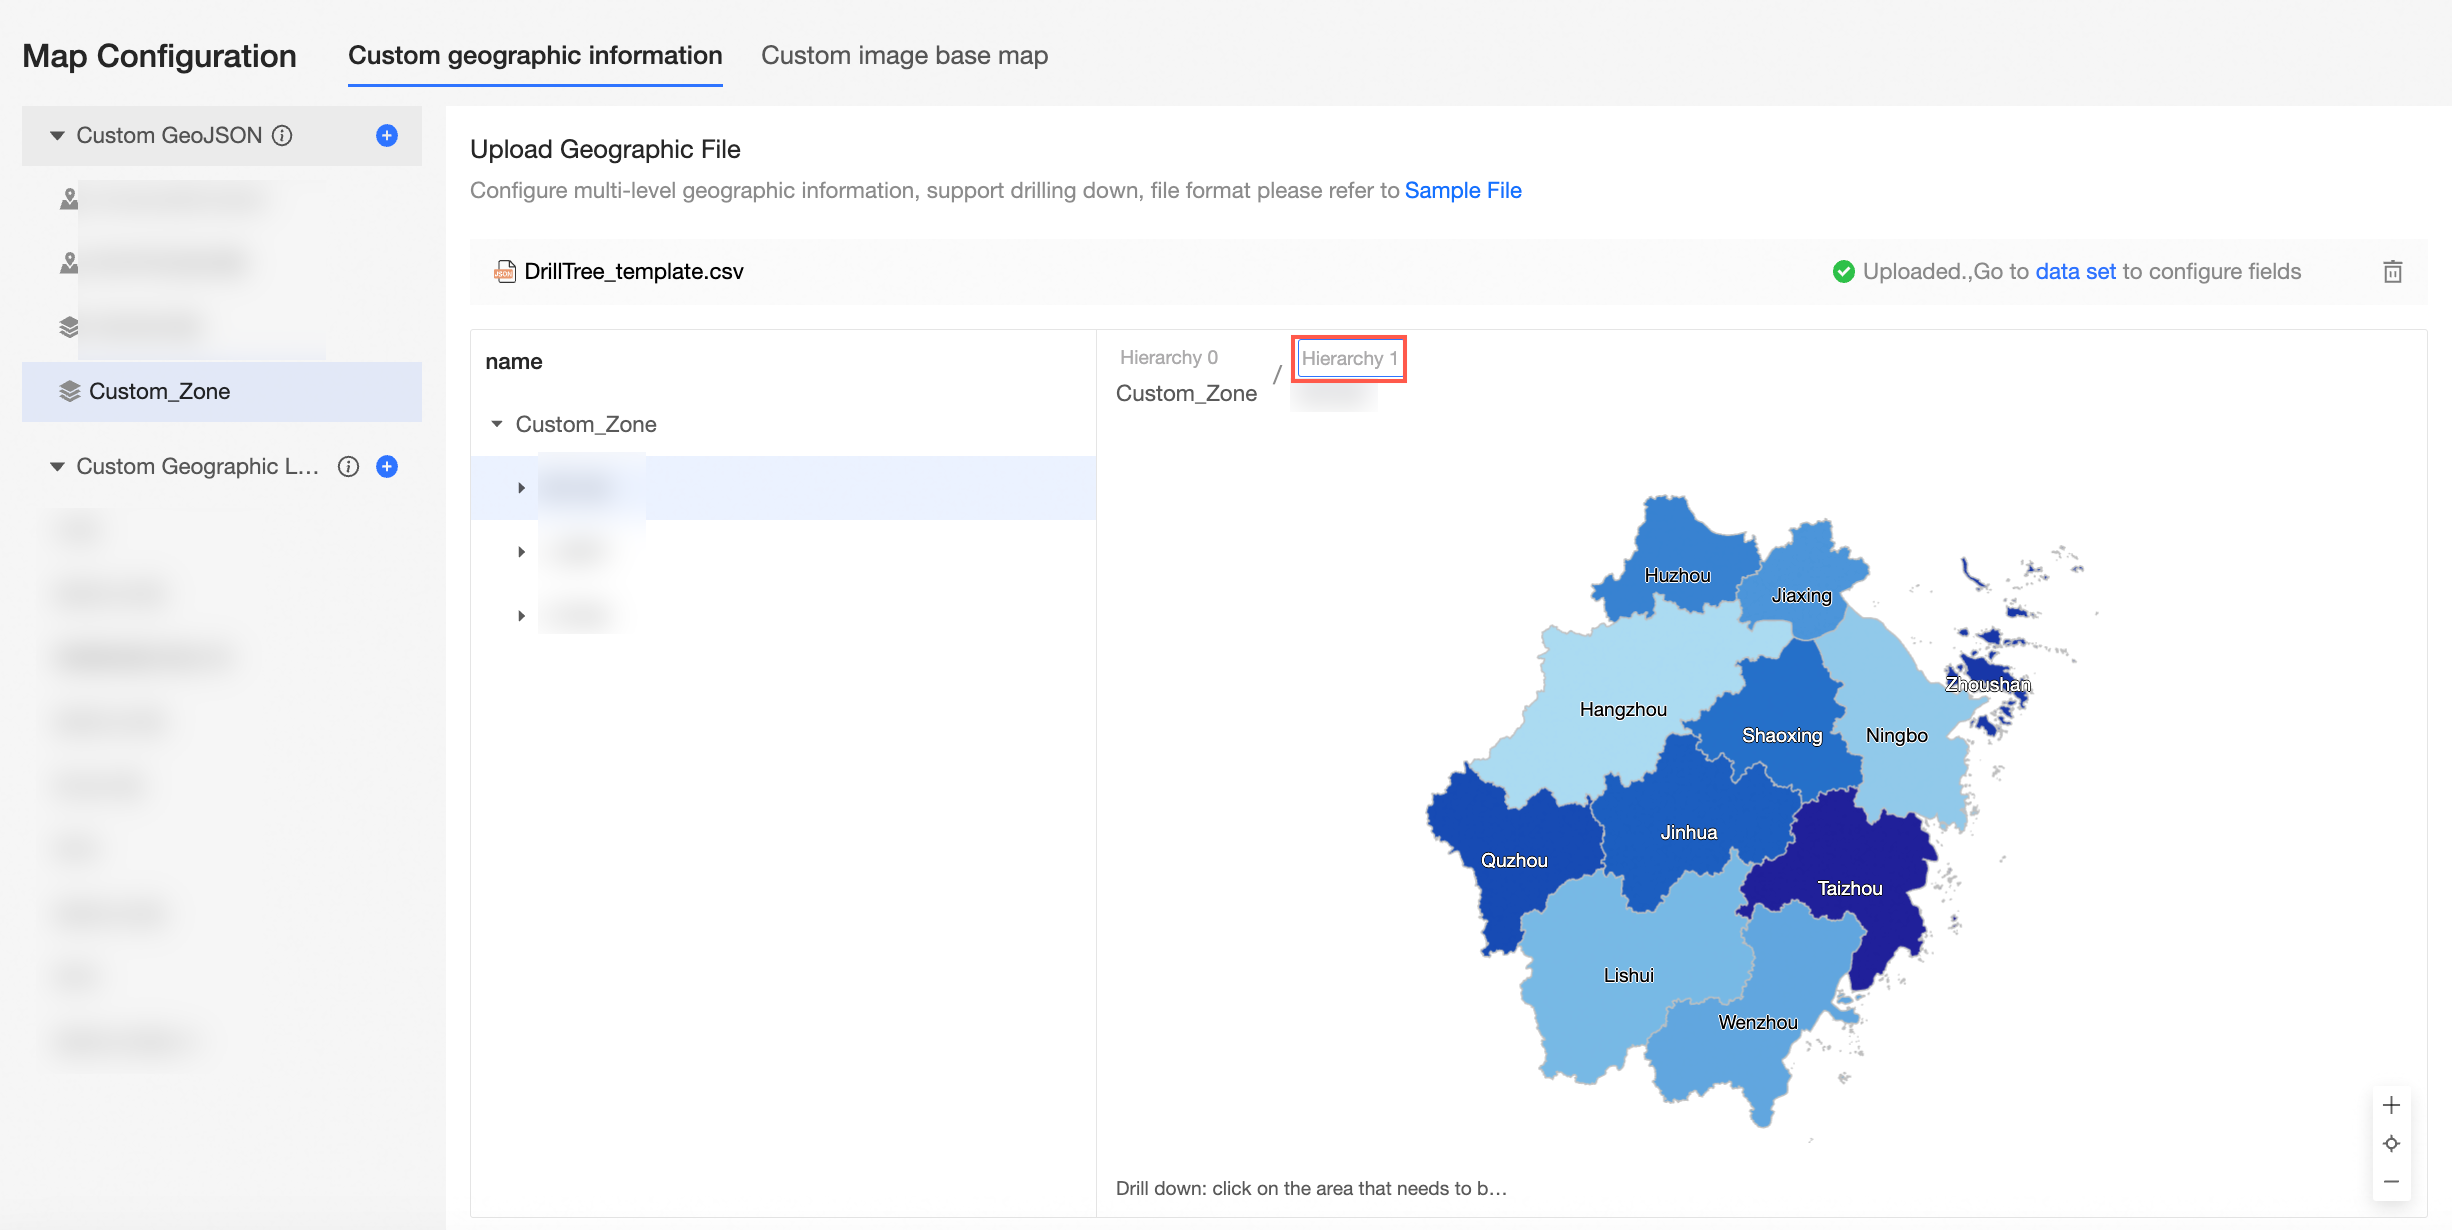
When viewing map information for different levels, you can double-click a level name to rename it.


Convert a geographic dimension field
Procedure
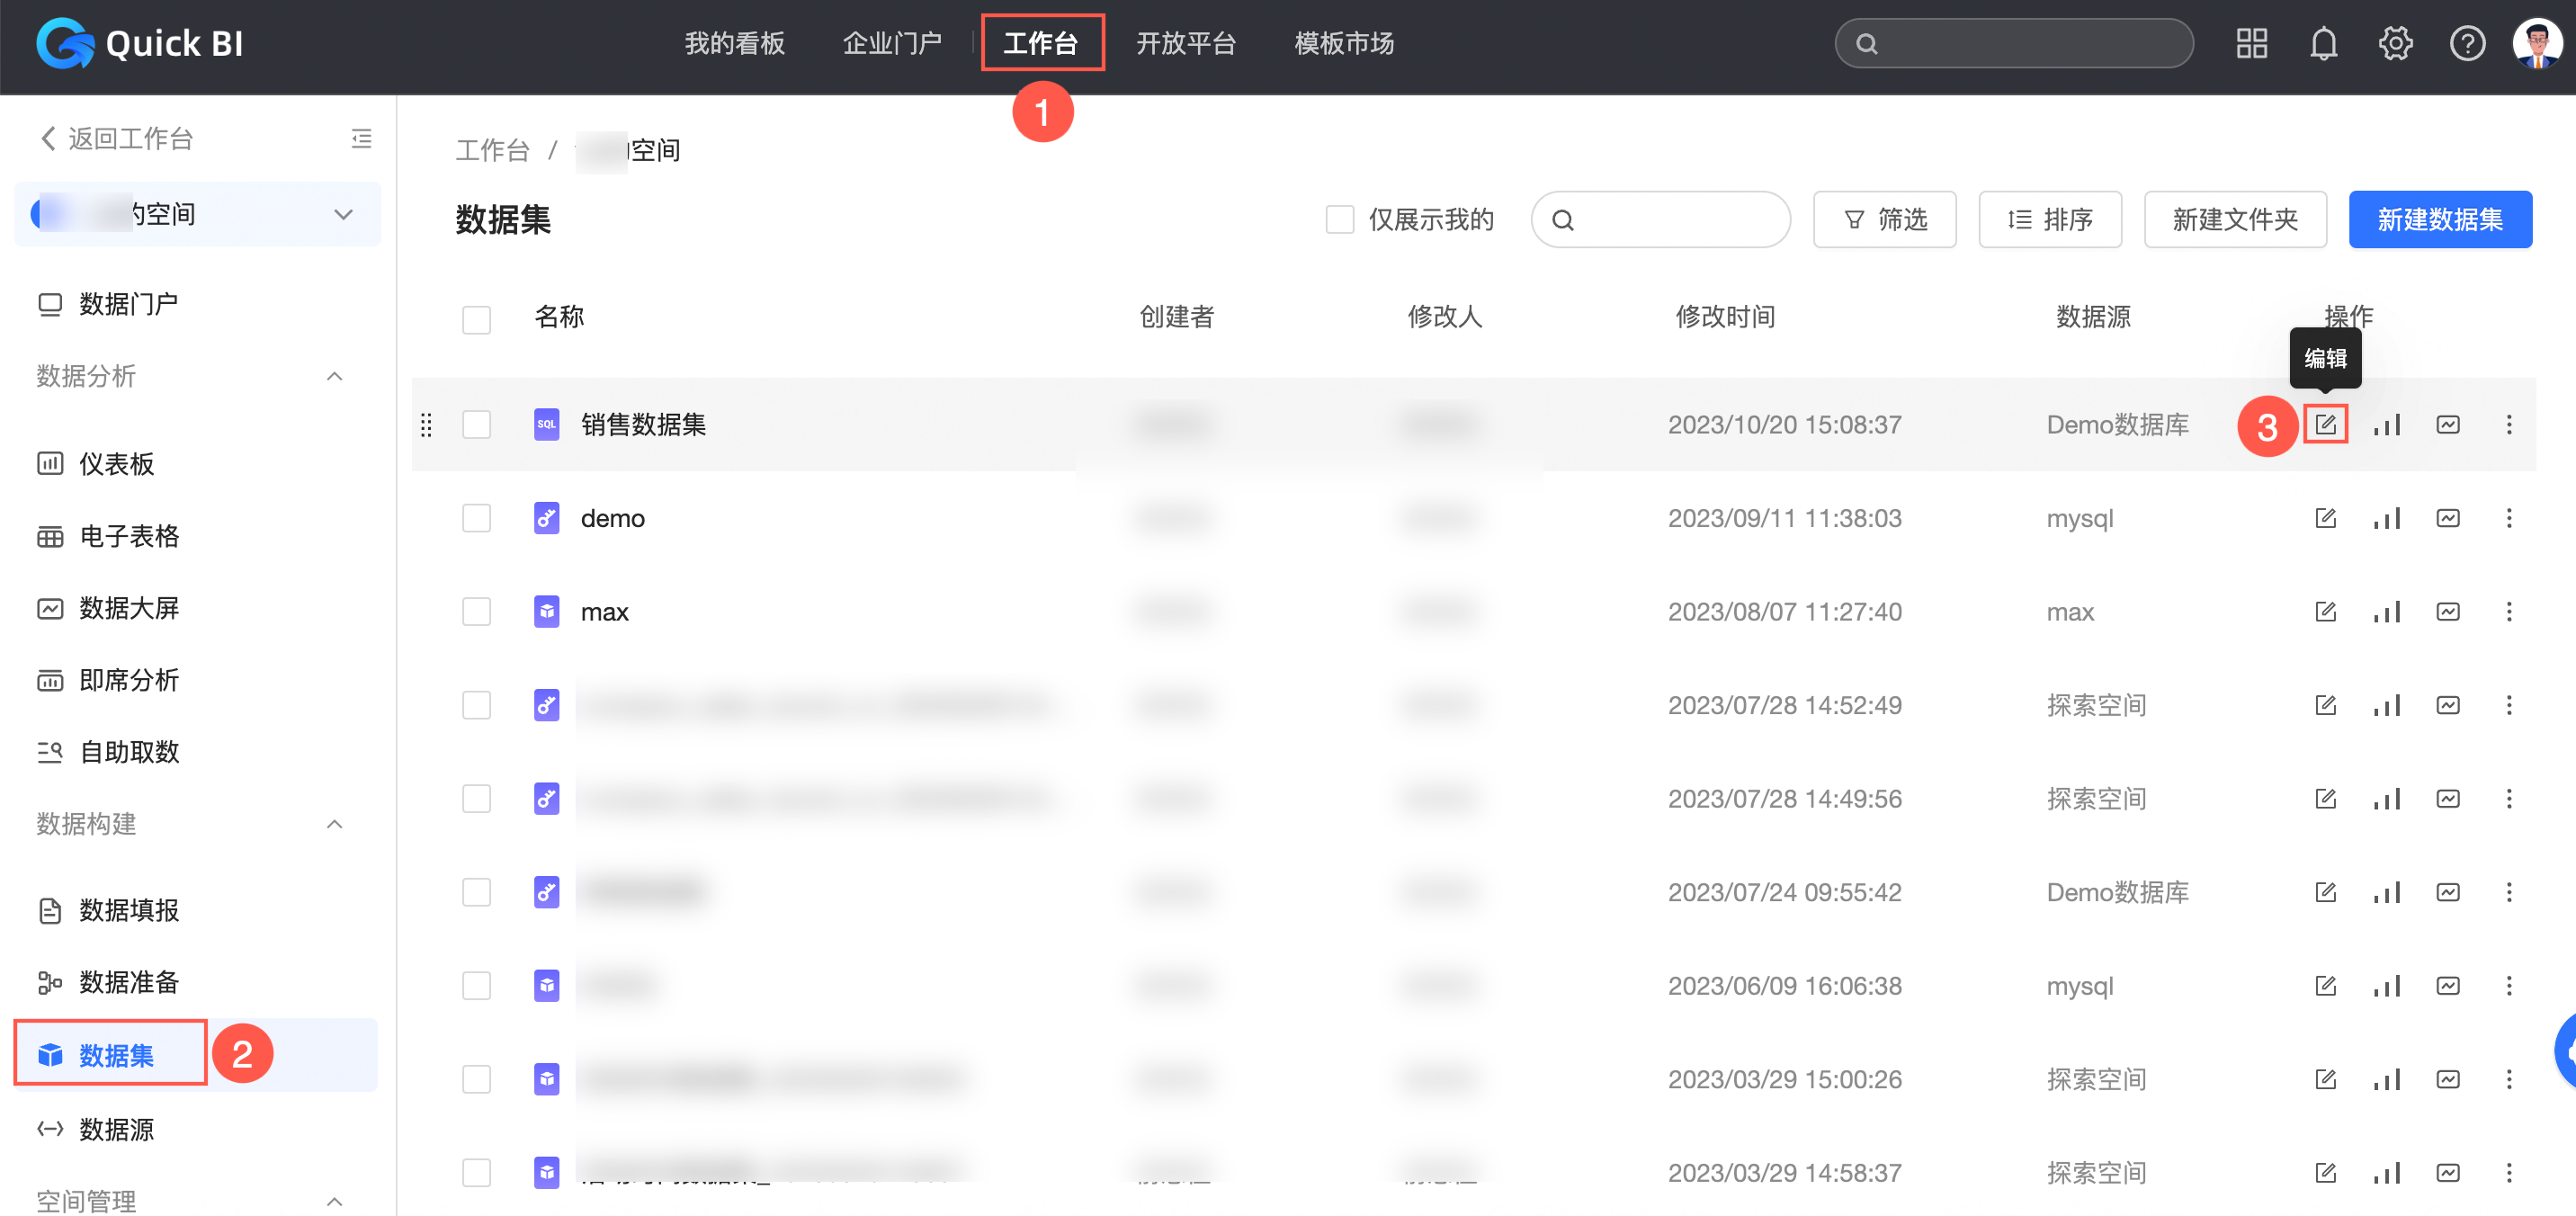
On the Quick BI homepage, navigate to the dataset edit page as shown in the figure.
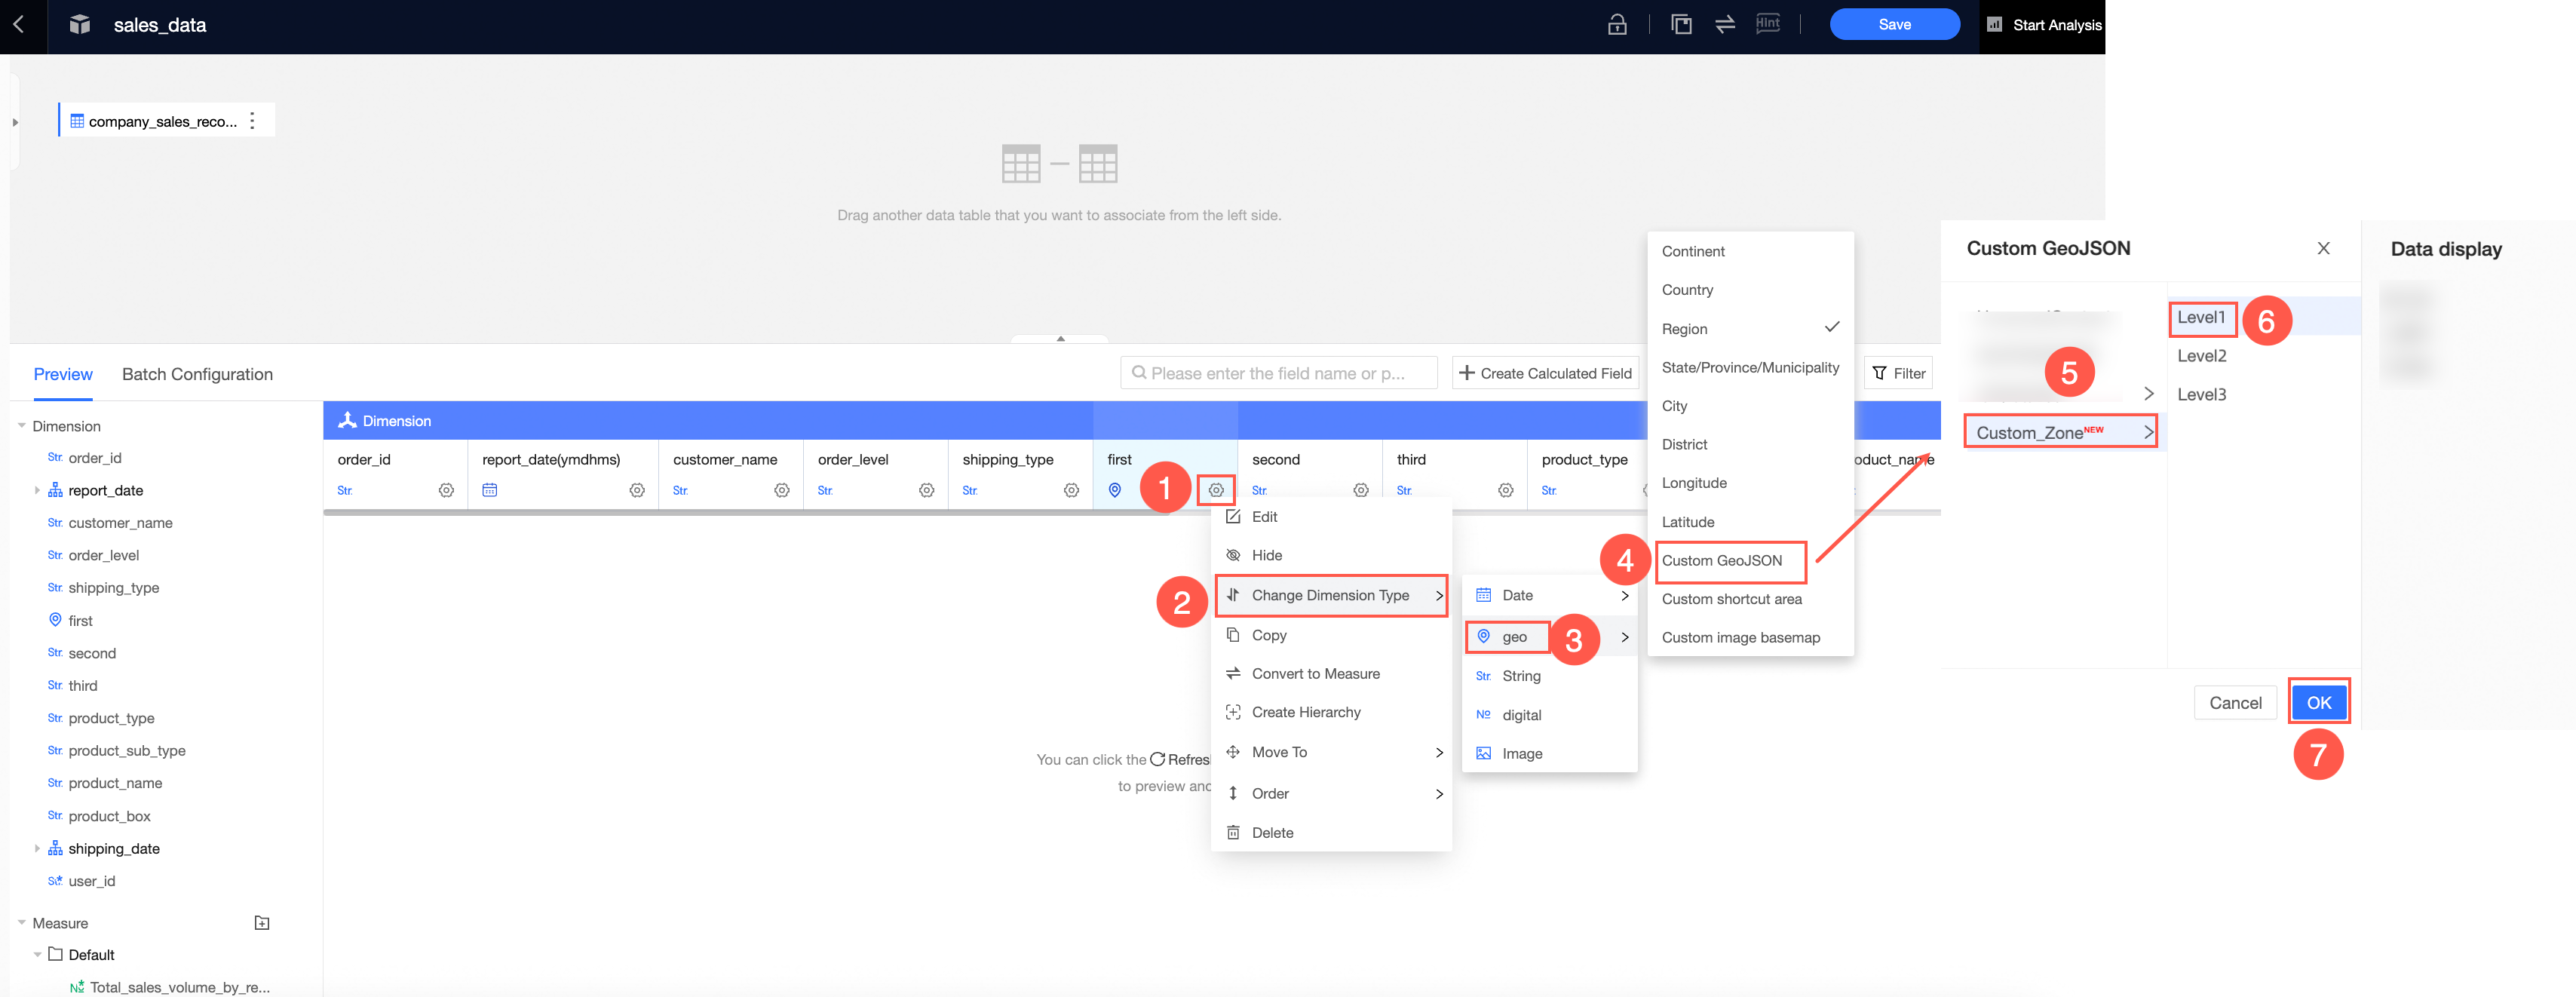
Change the Geographic Dimension field to multi-layer geographic information.
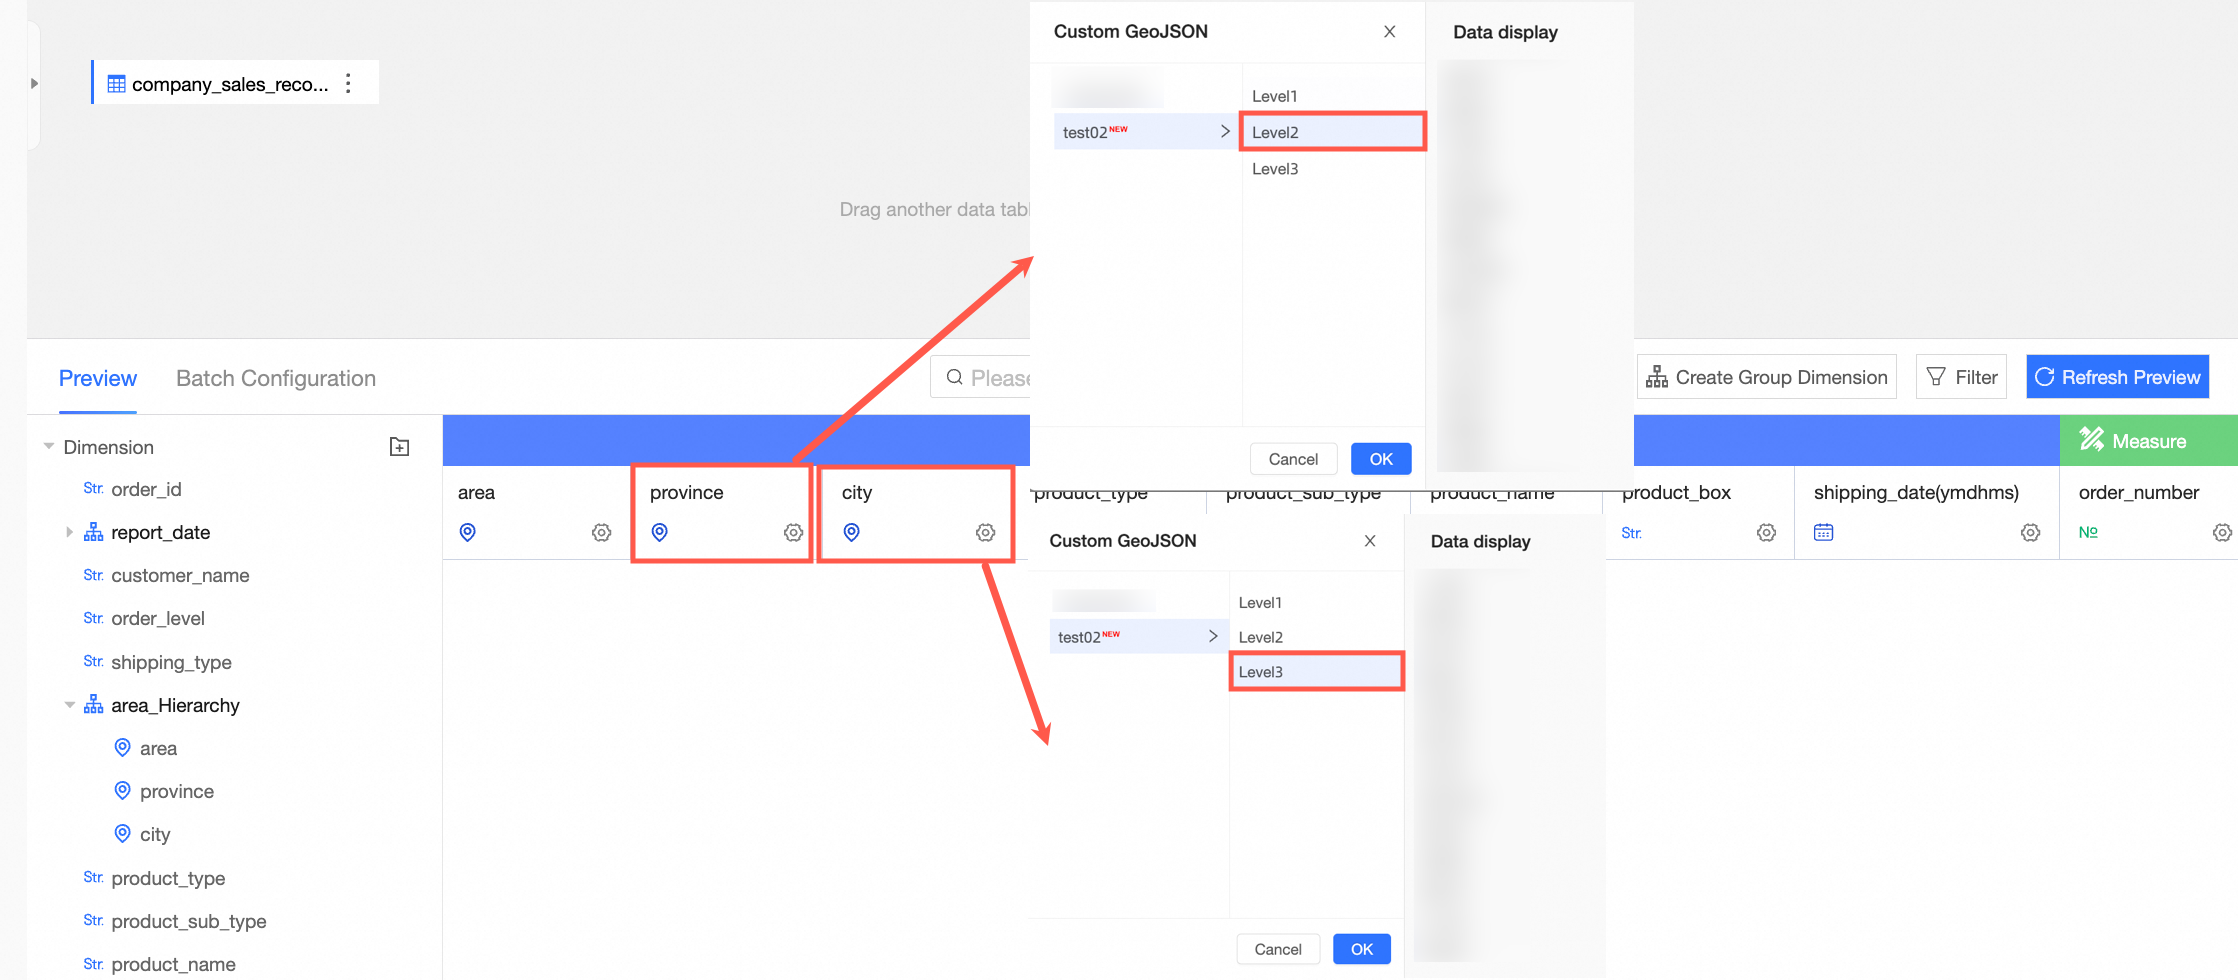
Map the First Level field to Level 1 of the multi-layer geographic information. The panel on the right displays the data for the selected level. Click Confirm.
Repeat the previous step to map the Second Level geographic dimension field to Level 2 and the Third Level geographic dimension field to Level 3.
When you finish editing, click Save in the upper-right corner.
Visualize the custom area on a map
The following example uses a choropleth map.
Procedure
Create a dashboard
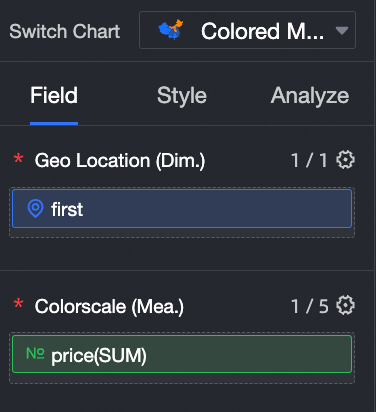
On the dashboard edit page, create a choropleth map. Drag the First Level field to Geographic Area/Dimension and the amount field to Color Saturation/Measure. The map now displays data for the first level of your custom multi-layer geographic information.
In the Geographic Area/Dimension field, click the
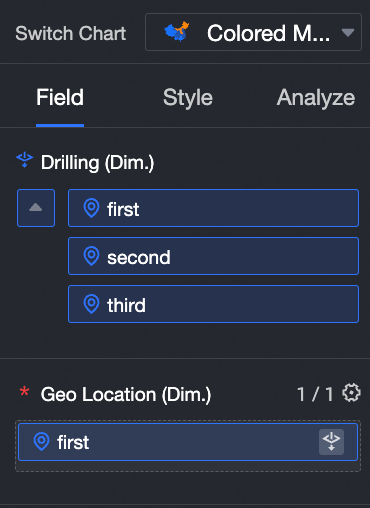
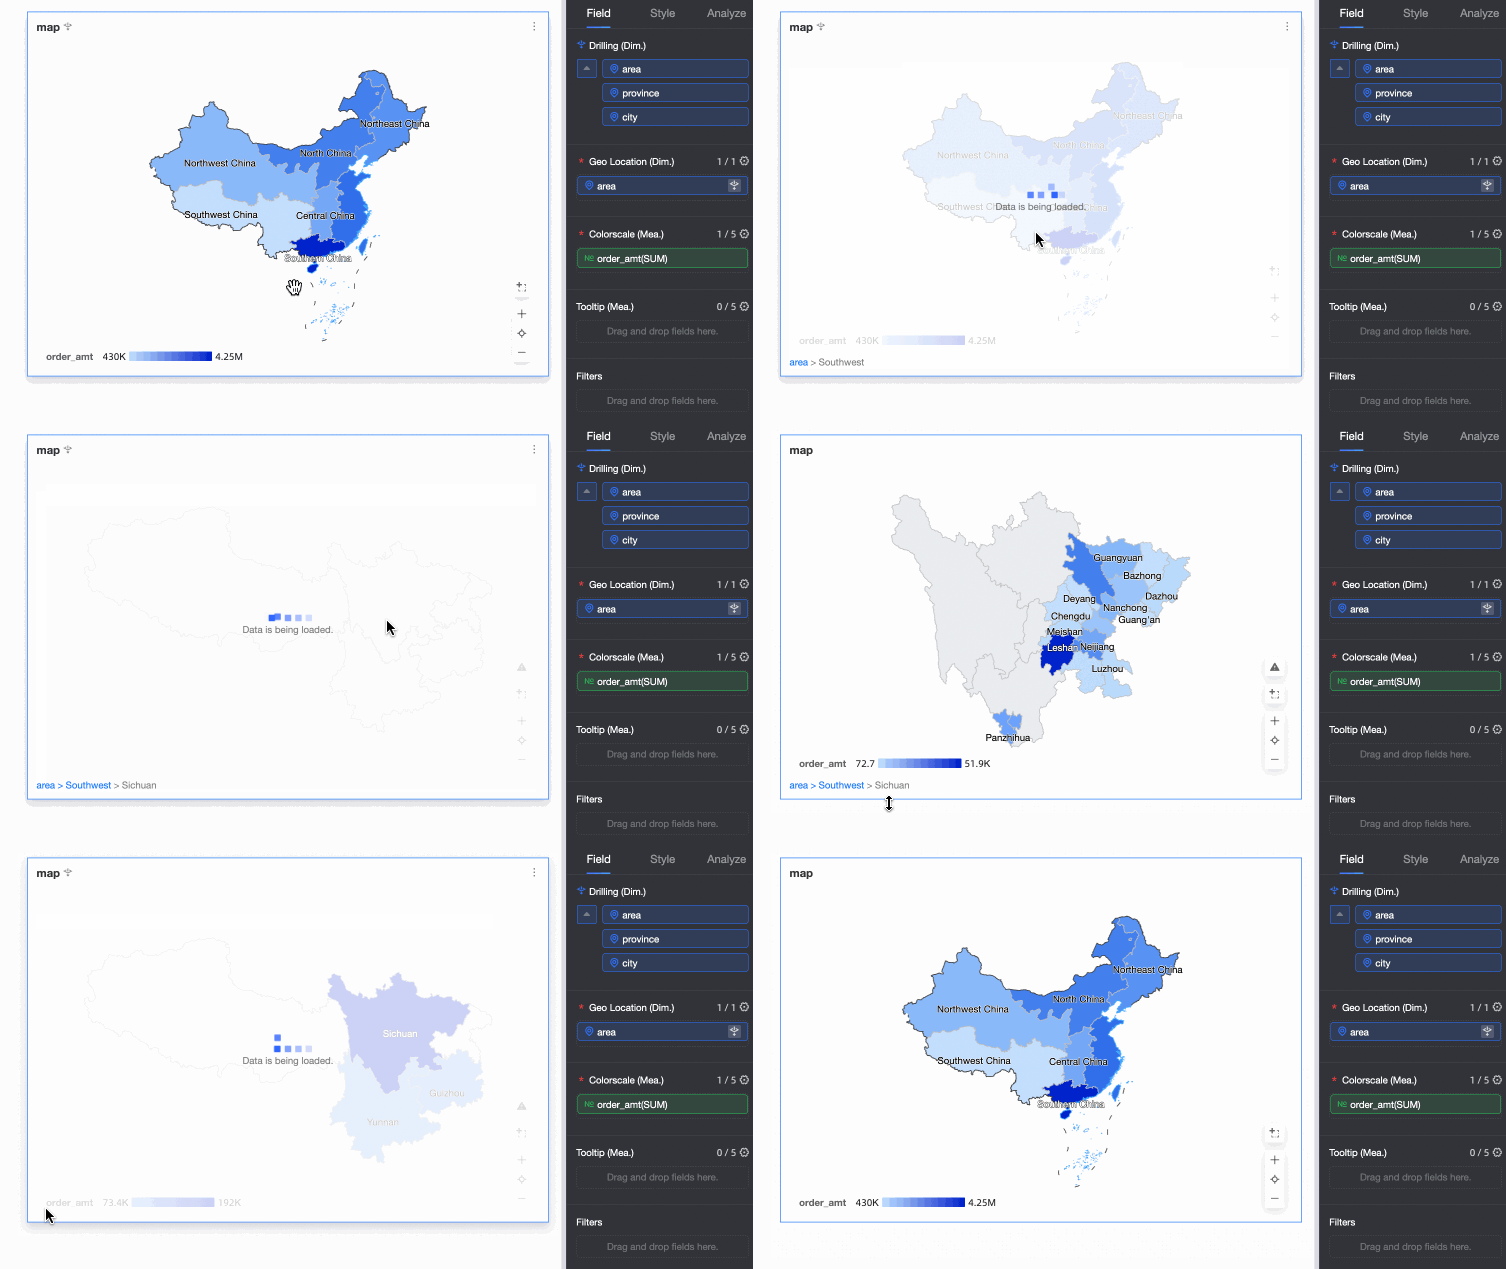
icon next to First Level to enable the drill-down feature. Then, drag the Second Level and Third Level dimension fields under Drill-down/Dimension.You can now drill down through the levels in the choropleth map to view data for each level of your custom multi-layer geographic information.
 icon next to First Level to enable the drill-down feature. Then, drag the Second Level and Third Level dimension fields under Drill-down/Dimension.