This article answers frequently asked questions about creating datasets.
-
Dataset errors
-
Dataset creation
-
Processing dataset fields
How do I convert a Unix timestamp field to a standard date/time field?
How do I configure the display of null or empty values on a dashboard?
How can I use parameterized SQL for flexible ratio calculations?
How can I use parameterized SQL for cumulative calculations?
How can I use parameterized SQL to query the last N days of data with a single date input?
-
Dataset permissions
-
Dataset display
-
Dataset associations
-
Dataset performance
Custom SQL errors
If your custom SQL fails when you run or save it, check the following common causes.
1. Incorrect custom SQL syntax
Quick BI pre-processes custom SQL before sending it to the database — it parses placeholders, appends a limit clause, and adds SQL comments. A syntax error causes the database to return an error at that stage.
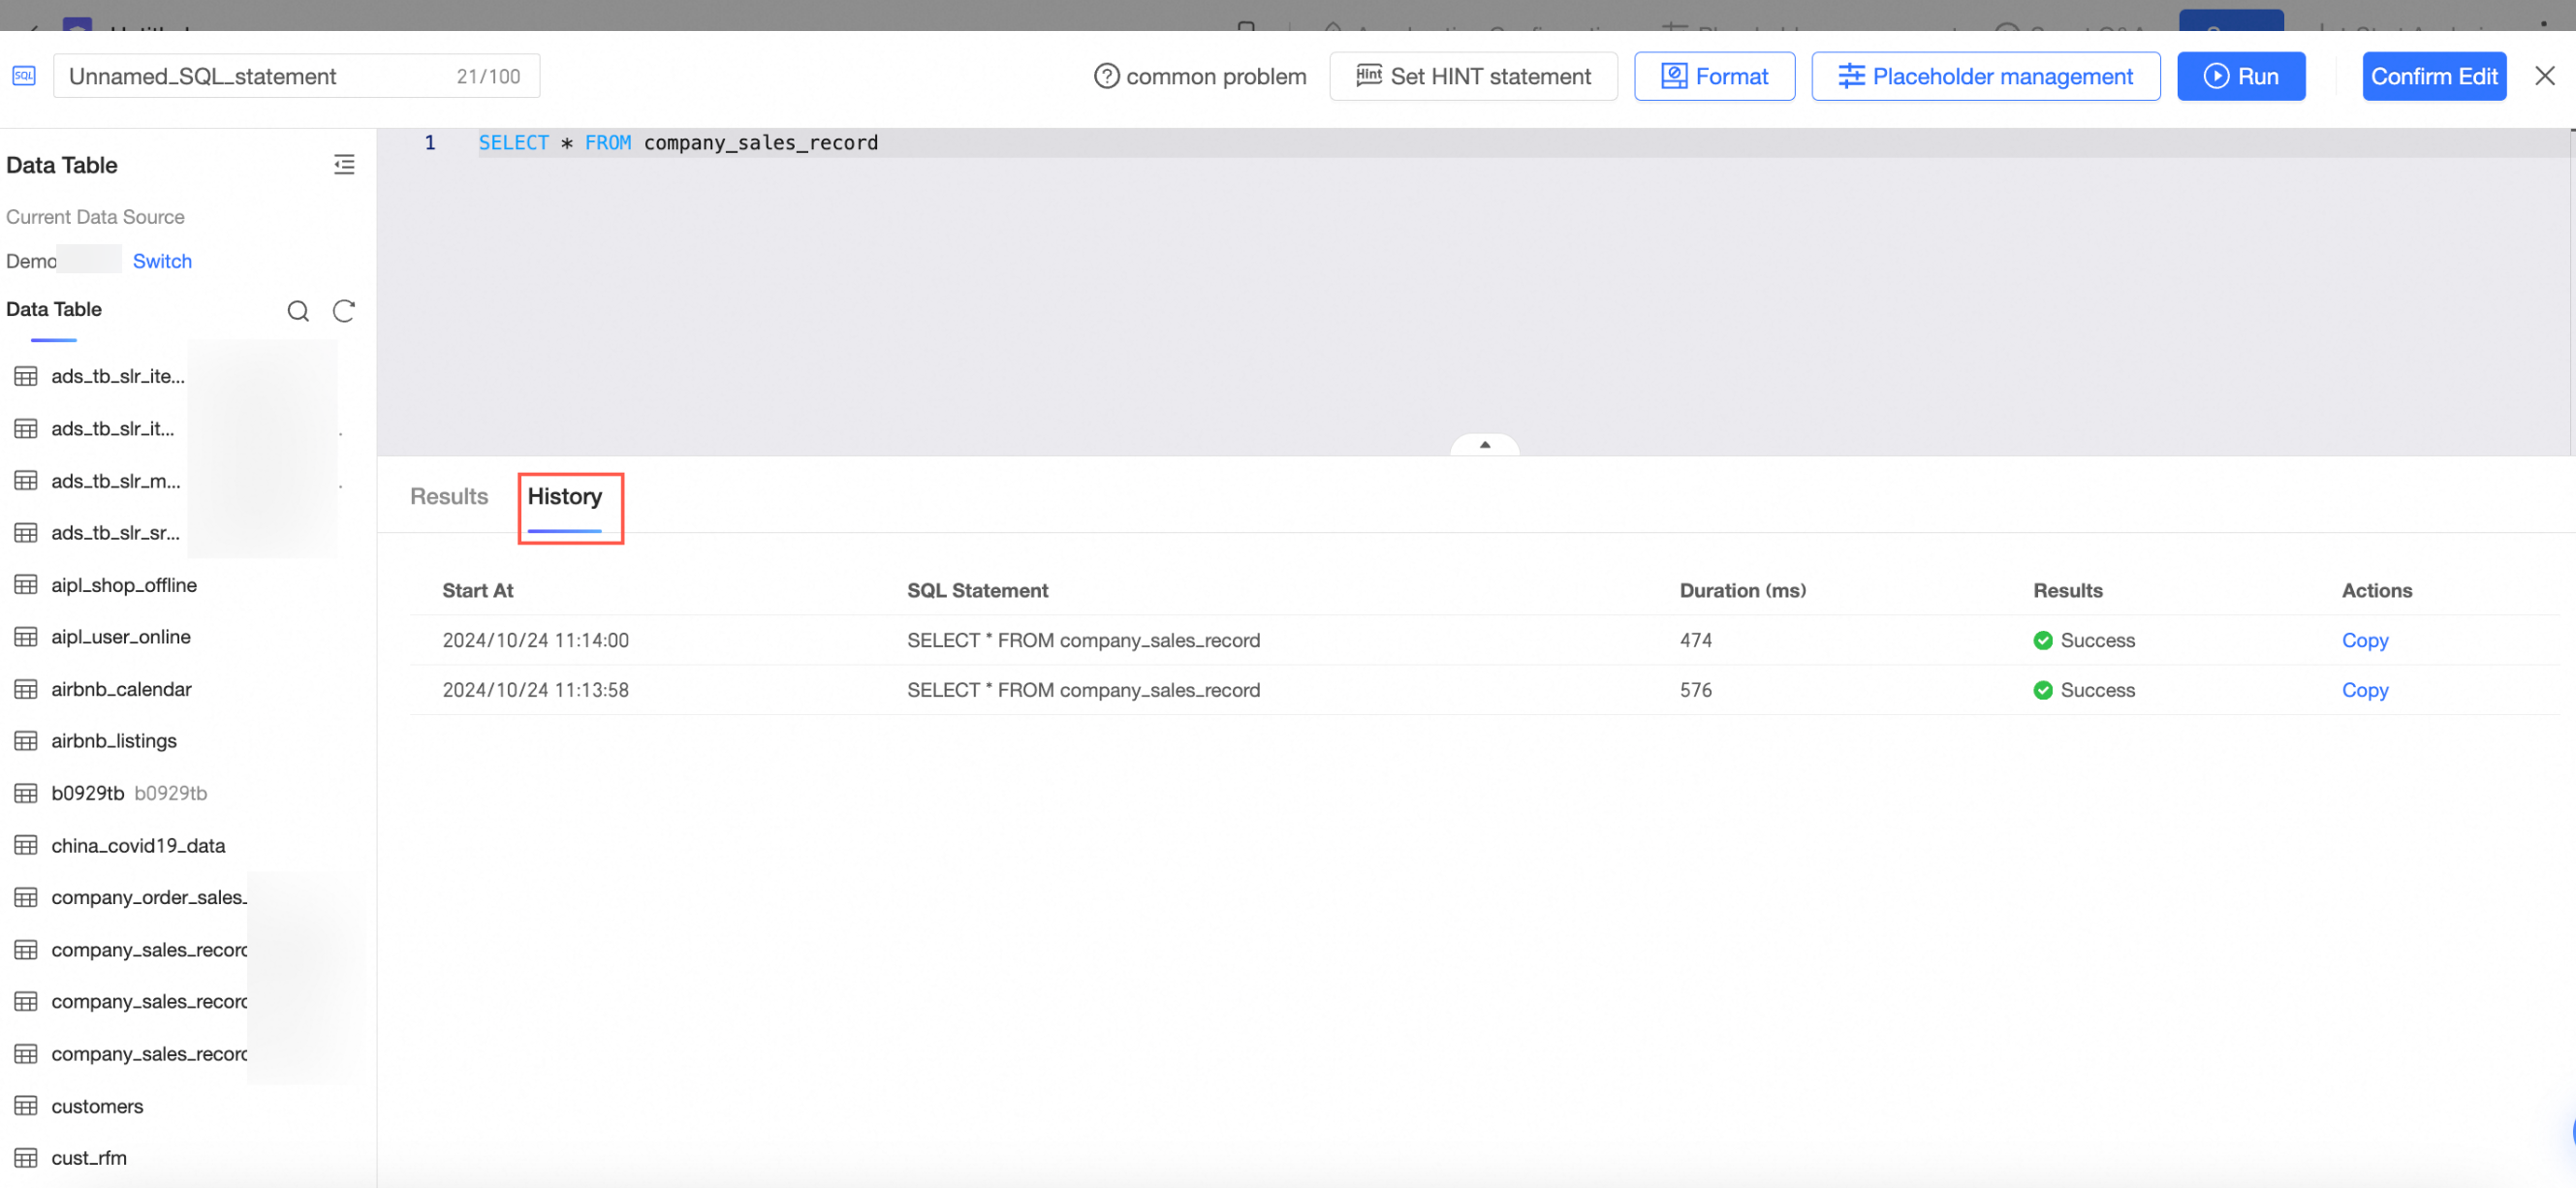
Run the statement directly in your database to verify the syntax. You can view previously executed statements in History.
2. Statements before the SELECT statement
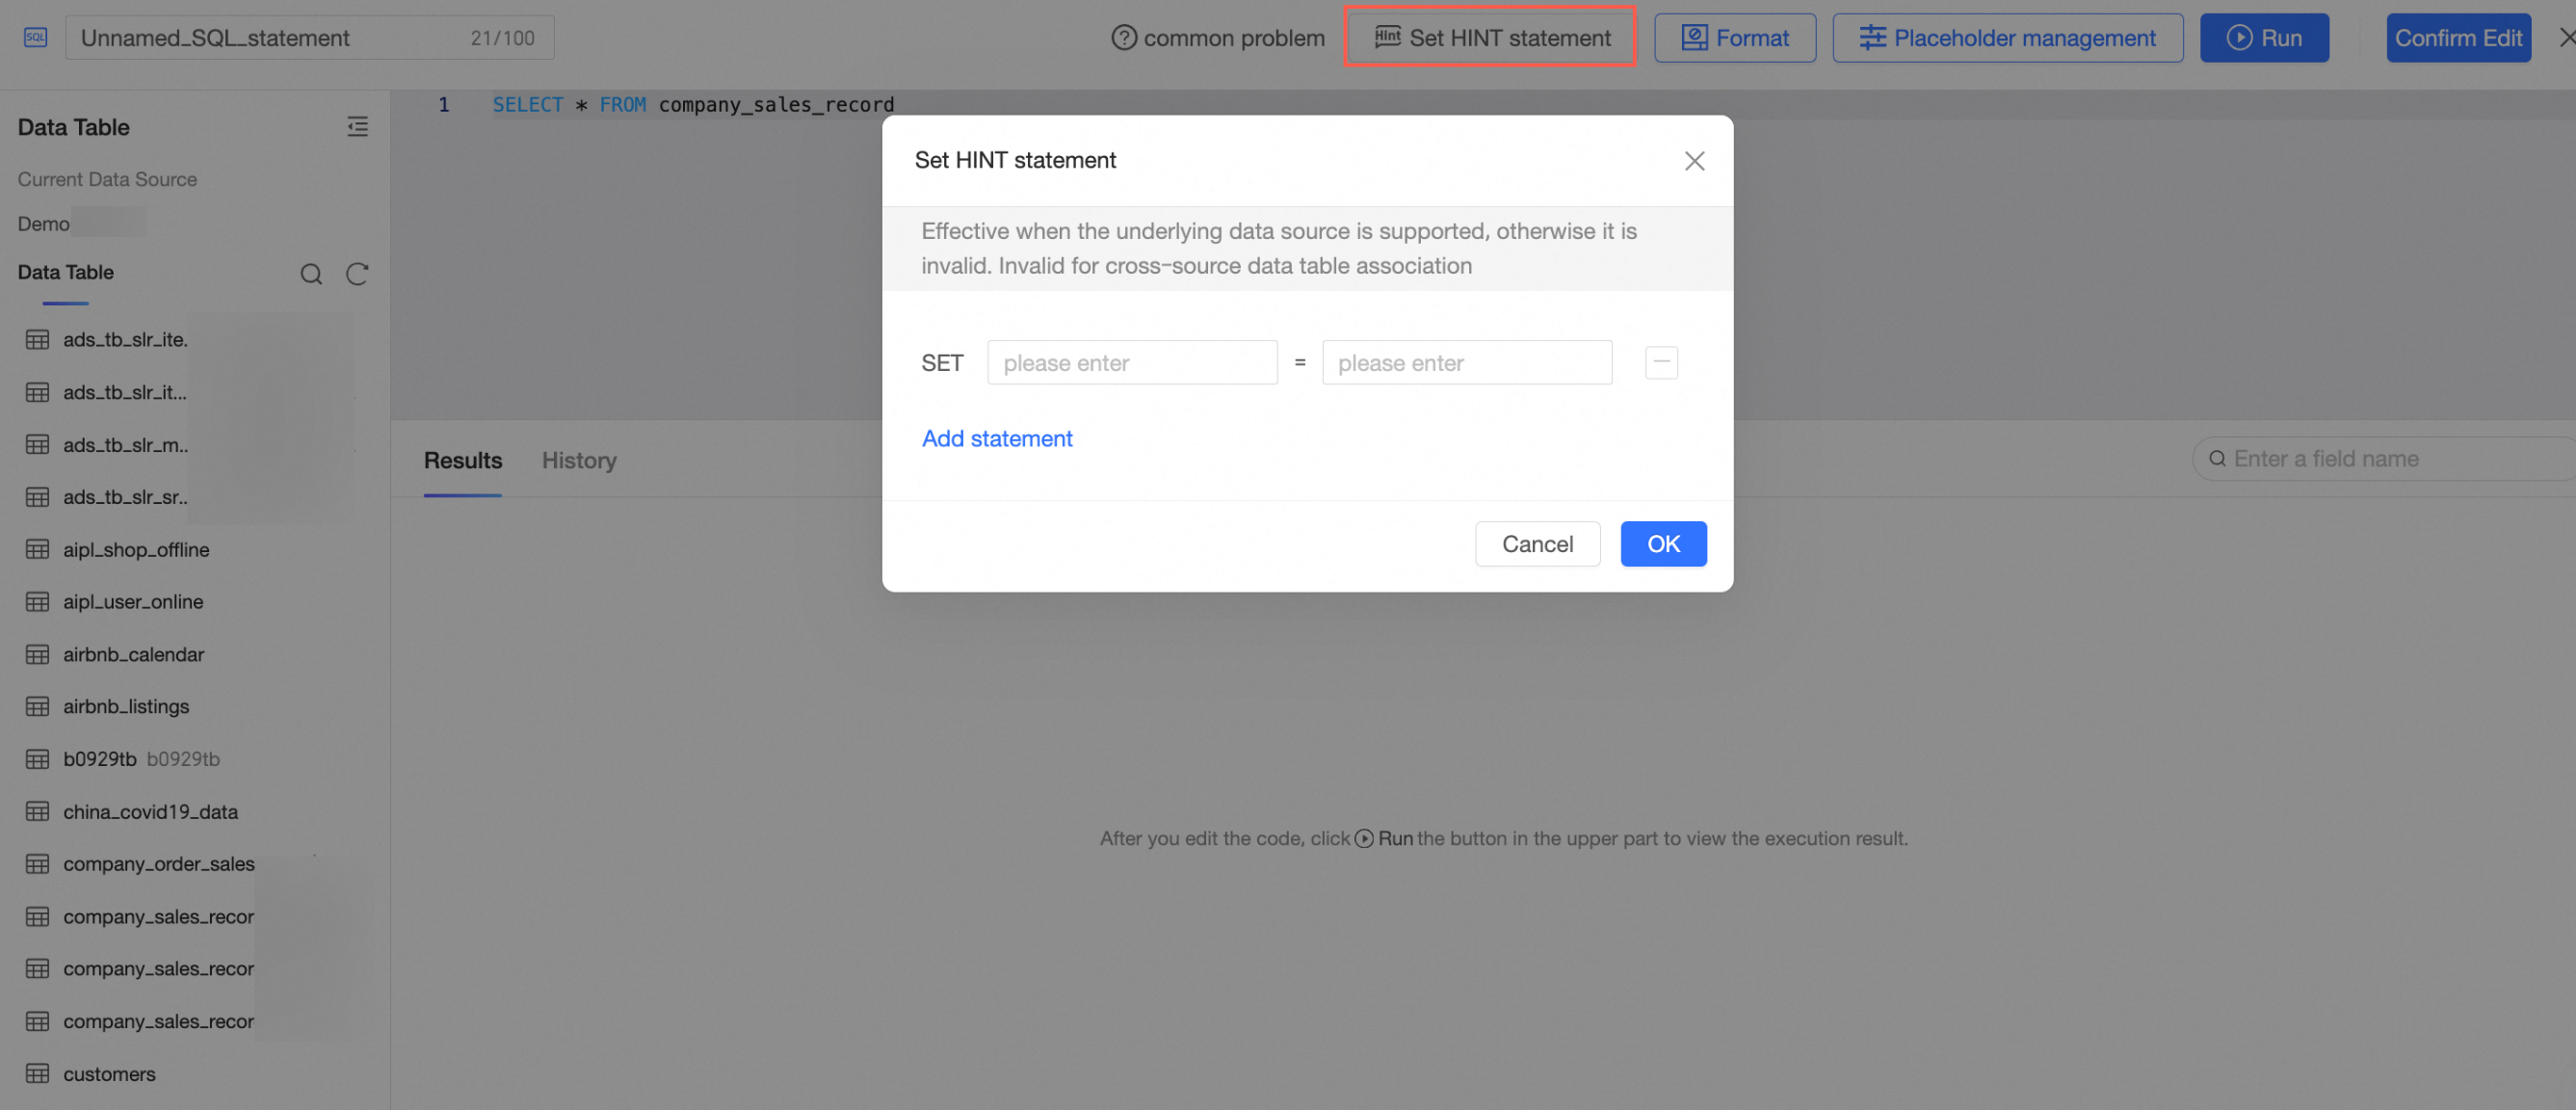
Quick BI appends a limit 200 clause when you run or save custom SQL, so the query must start with a SELECT statement. Placing any statements — including HINT statements — before SELECT causes the query to fail.
To use a HINT statement, select the Set HINT Statement option instead of writing it inline.
For data sources that support HINT statements, see Data source feature list.
3. Placeholders used without default values
Custom SQL supports parameter passing through placeholders. When viewing a report, query controls pass placeholder values into the underlying SQL for flexible filtering. For placeholder use cases and syntax, see Placeholders.
Any placeholder used inside a SELECT statement must have a default value. Without one, the SQL is incomplete at runtime and returns an error.
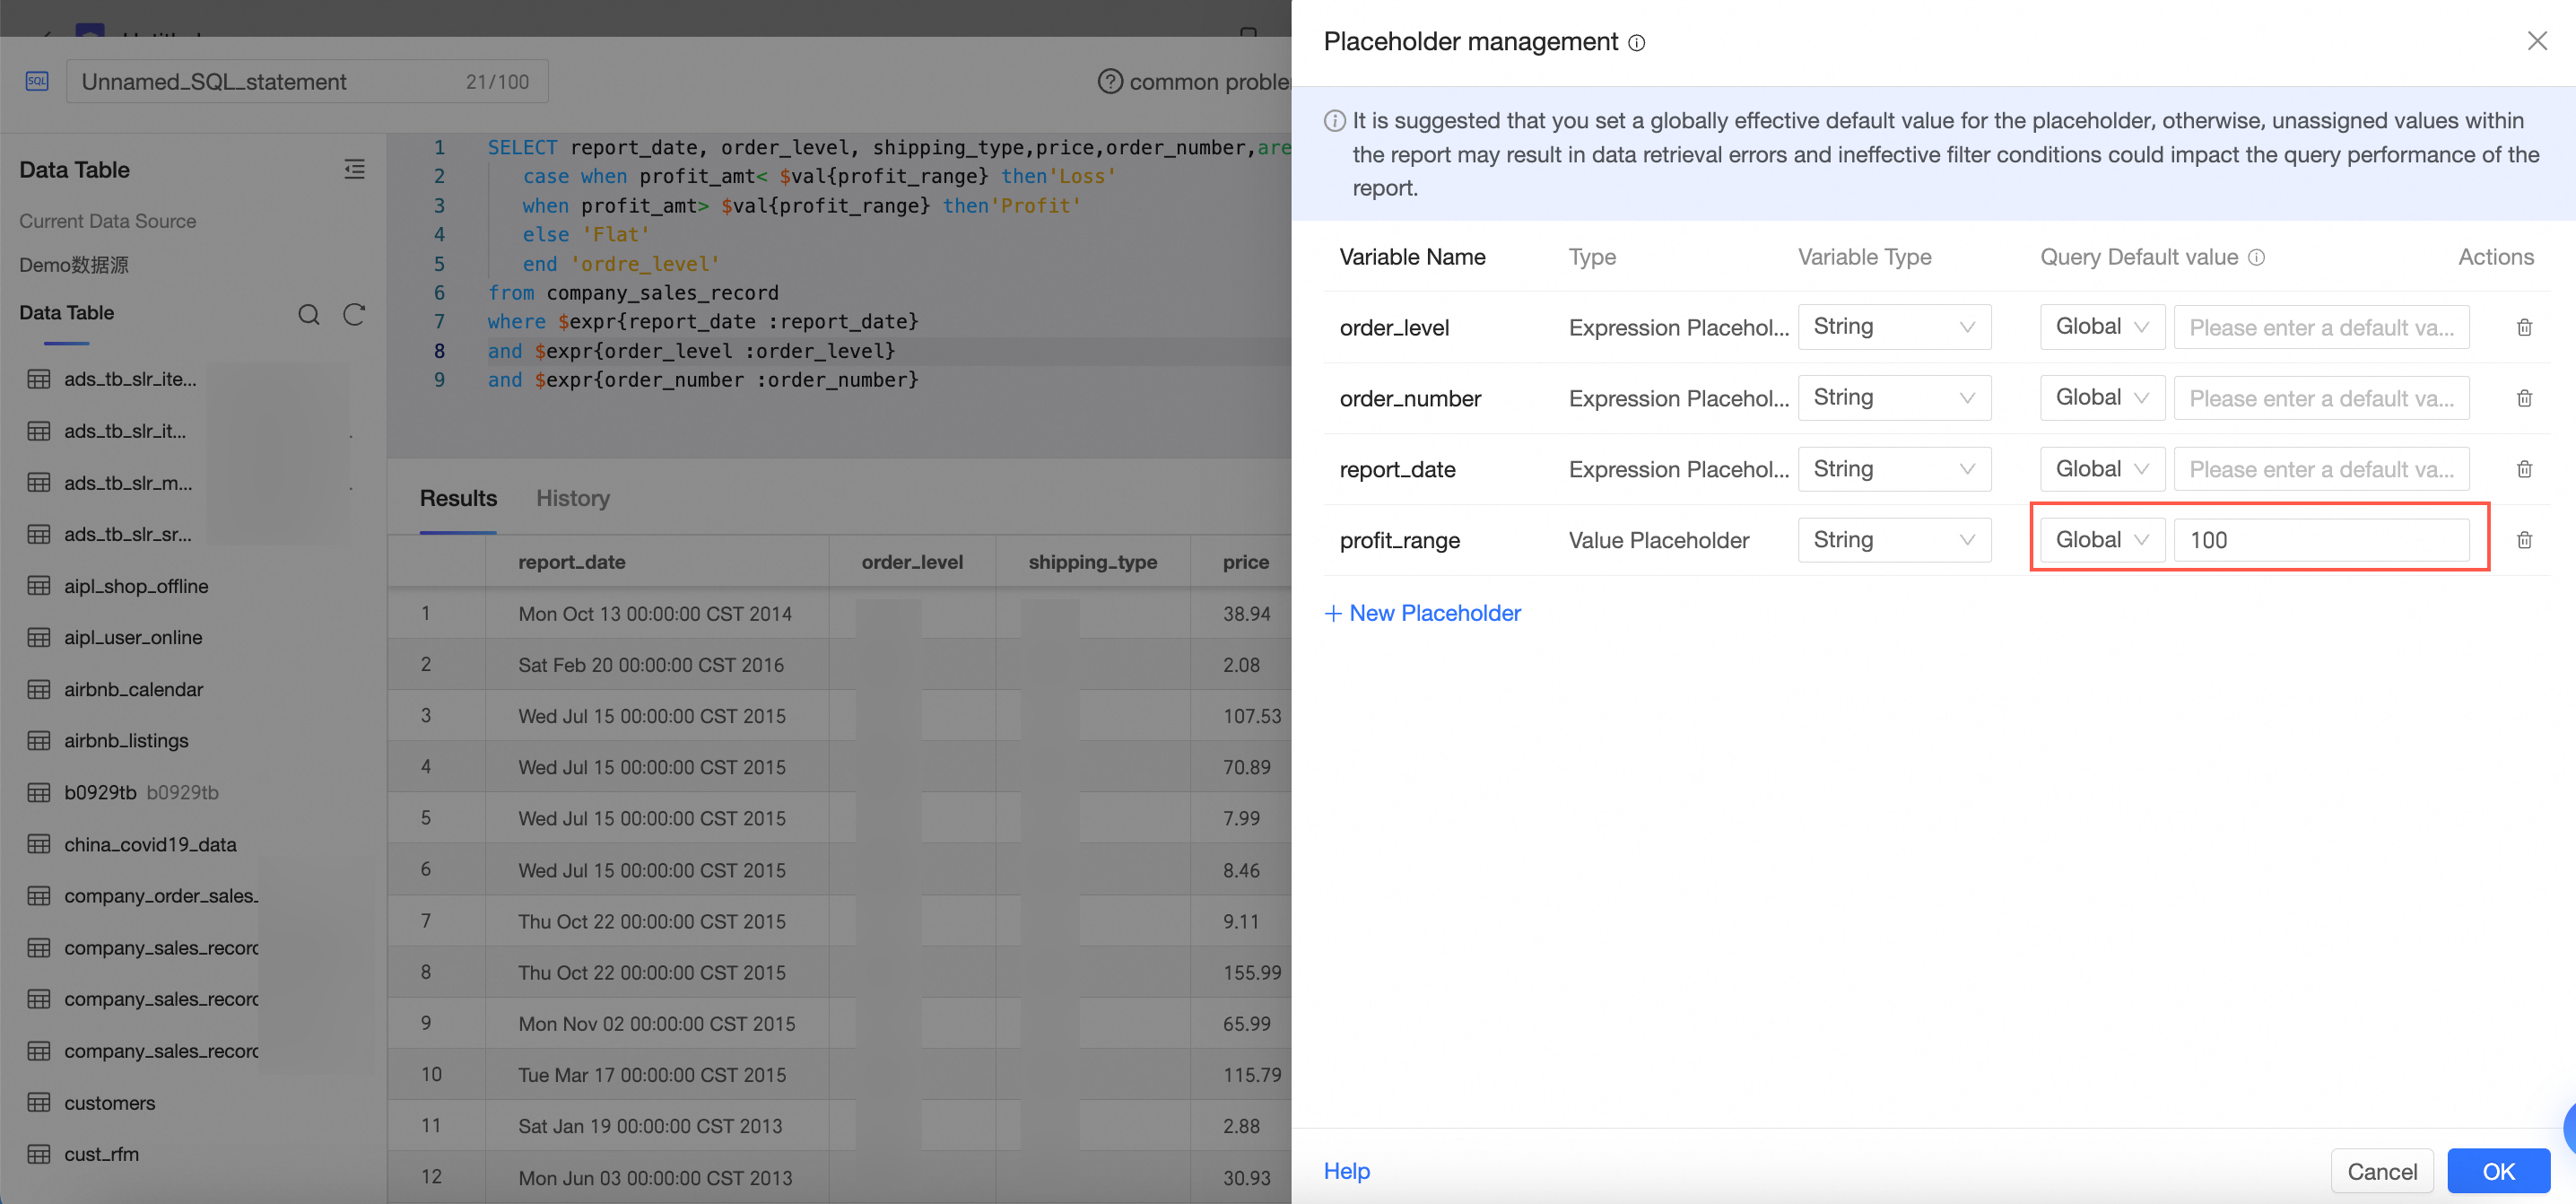
In the example below, the Order Level field fails because the value placeholder $val{profit_range} has no default value. Assigning a default value of 100 and rerunning the SQL resolves the issue.
Set a global default value for placeholders in SELECT statements — not just a dataset-level default — to prevent errors when users open the dashboard without setting a filter value.
SELECT report_date, order_level, shipping_type,price,order_number,area,
   case when profit_amt< $val{profit_range} then'Loss'
   when profit_amt> $val{profit_range} then'Profit'
   else 'Break-even'
   end 'Order Level'
from company_sales_record
where $expr{report_date :report_date}
and $expr{order_level :order_level}
and $expr{order_number :order_number}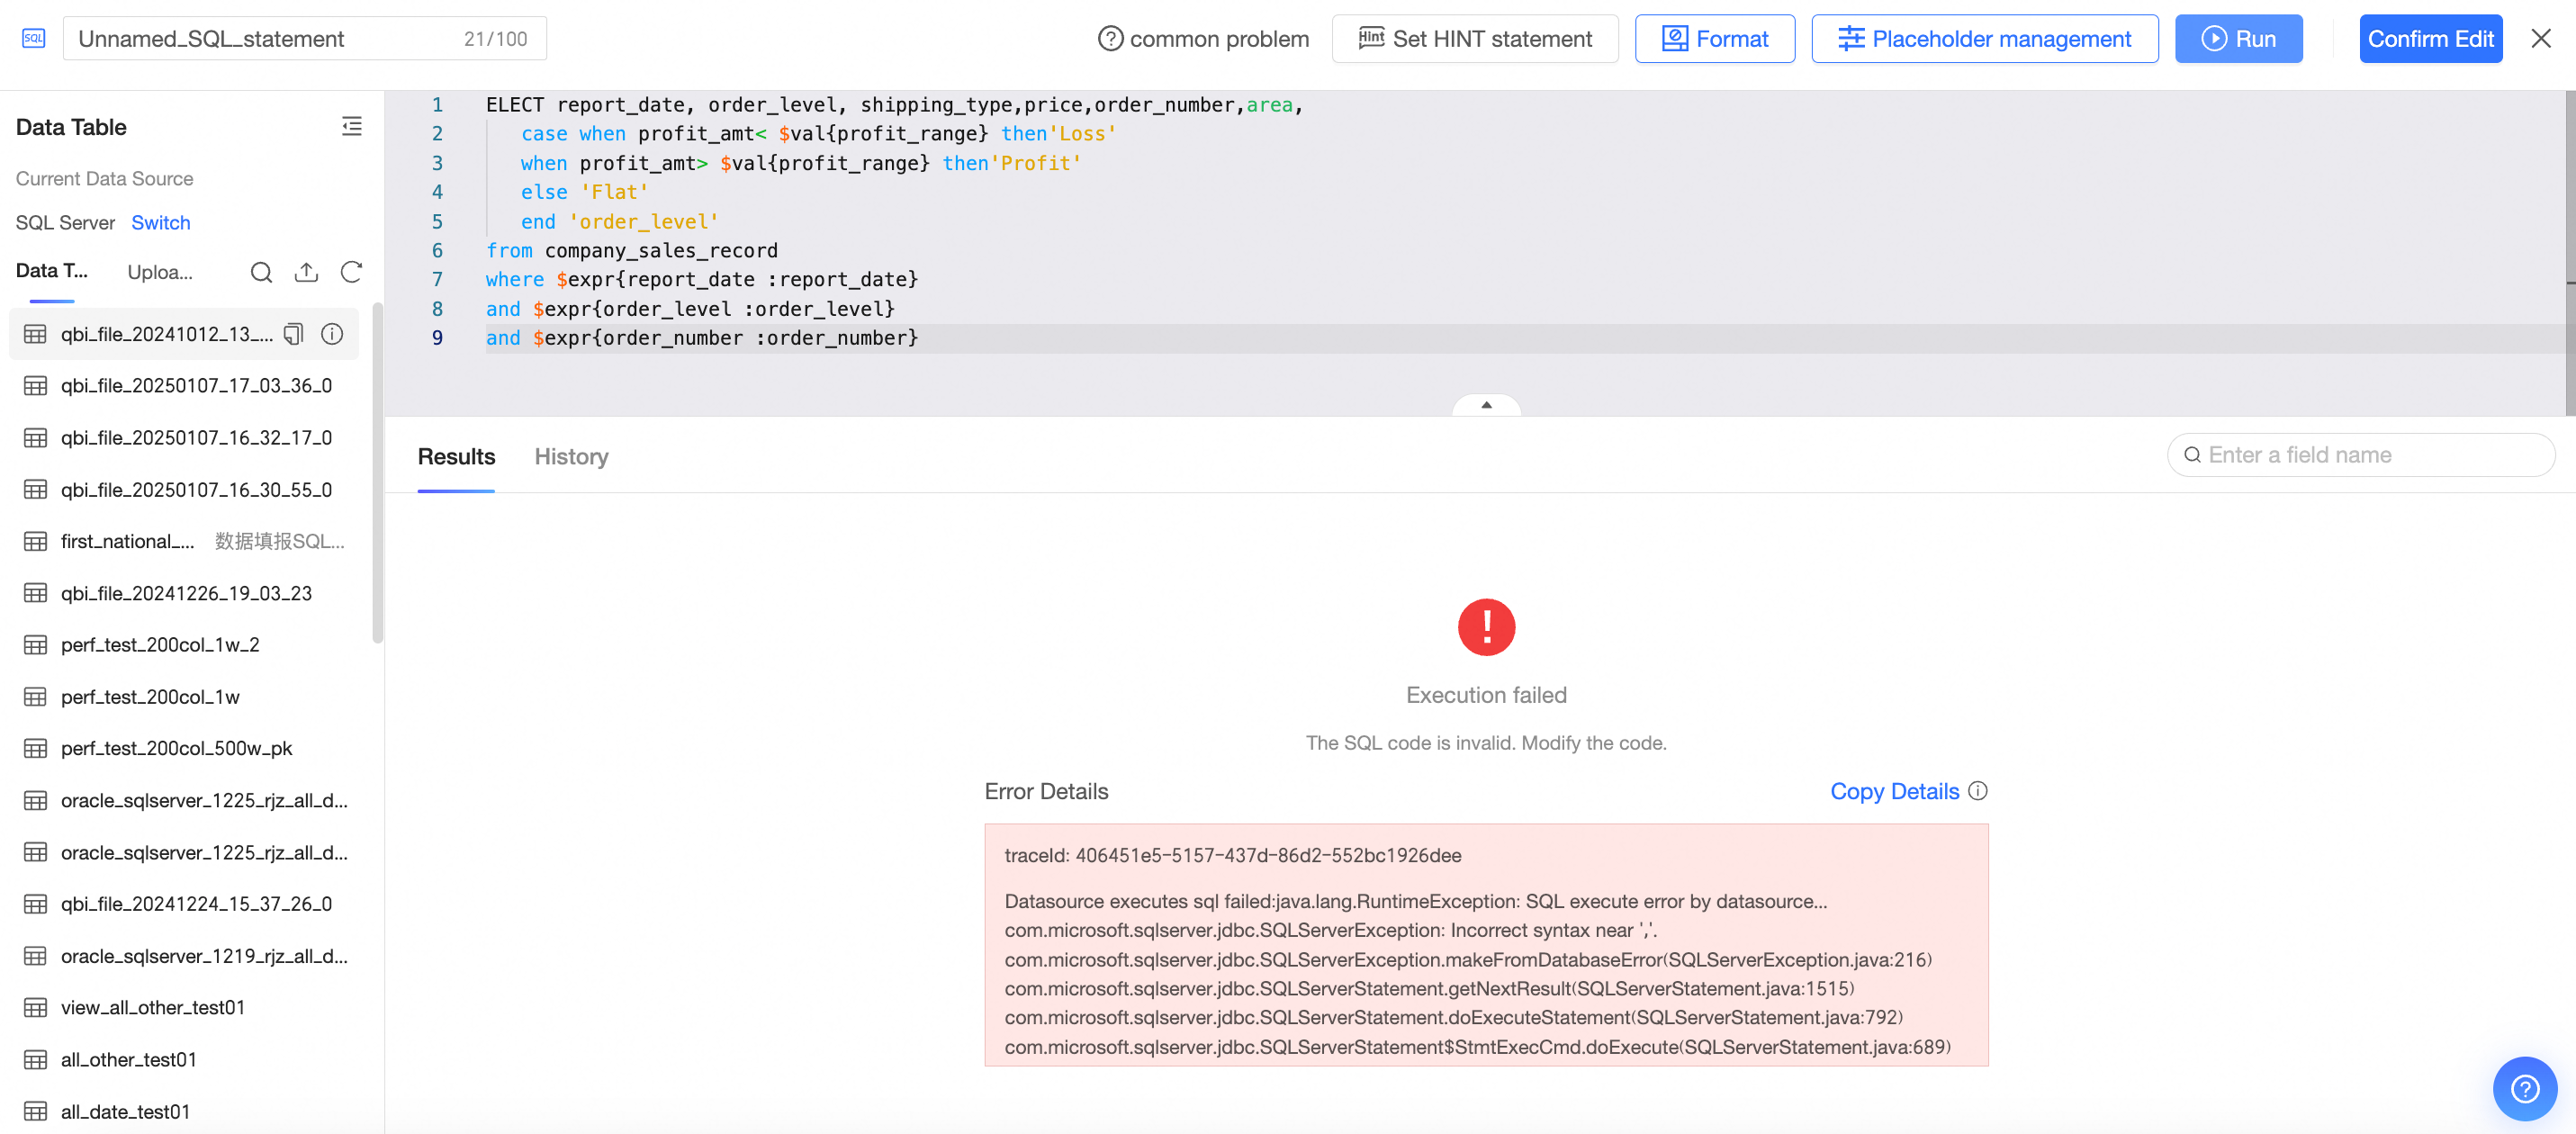
4. Other issues
Use standard conventions for comments and aliases in custom SQL. Non-standard usage can cause the database to return unexpected field names, trigger placeholder parsing failures, or produce other errors.
Do not add a semicolon (;) at the end of your custom SQL.
Calculated field errors
Calculated fields reference columns from the physical table. To convert a field's data type, use the appropriate conversion function — changing the type in the UI does not alter the underlying physical field's type and may cause an error.
Dimension calculated fields cannot contain aggregate functions such as SUM or AVG. To perform an aggregation, save the field as a measure instead.
Text fields support only COUNT and COUNTD aggregations. SUM, MAX, and similar functions are not available for text fields. Convert the field to a numeric type before performing those calculations.
Creating datasets from local files
When you create a dataset from an uploaded local file, use the SQL syntax of the destination data source. For example, uploading a file to an exploration space requires ClickHouse syntax when creating and querying the dataset.
Uploading a file to an exploration space has two limitations: custom SQL is not supported, and cross-source joins are not available. To use these features, upload the file to a data source in a group space that supports cross-source joins.
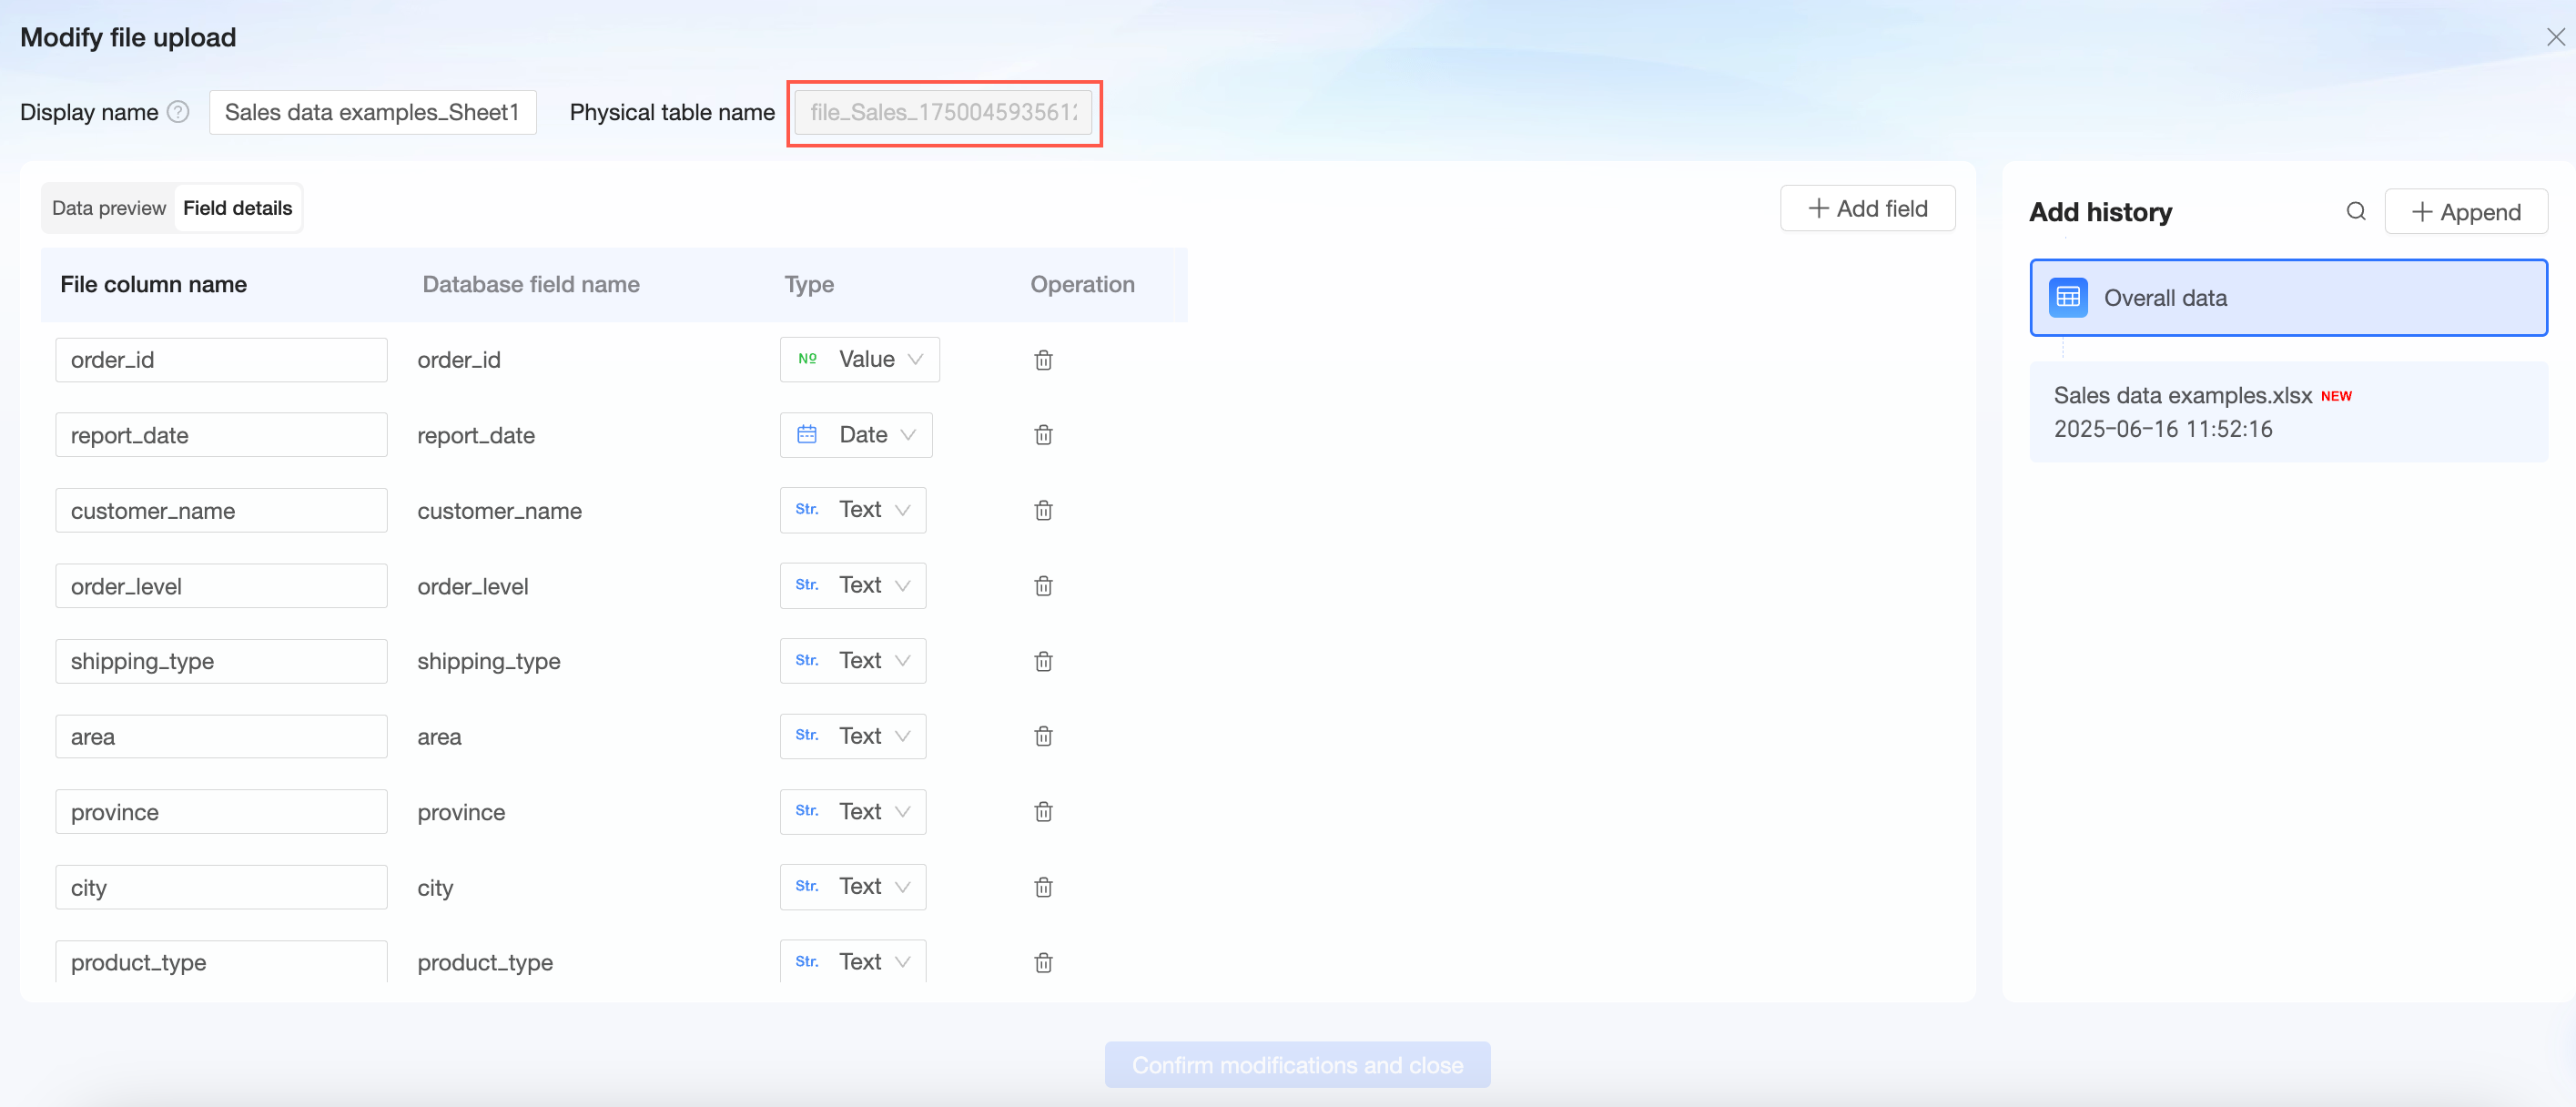
If you upload a file to a database data source and use custom SQL, reference the physical table name automatically generated in the database — not the original filename. To find the physical table name, open the data source file list, click the settings icon for the file, and look for the name on the edit page.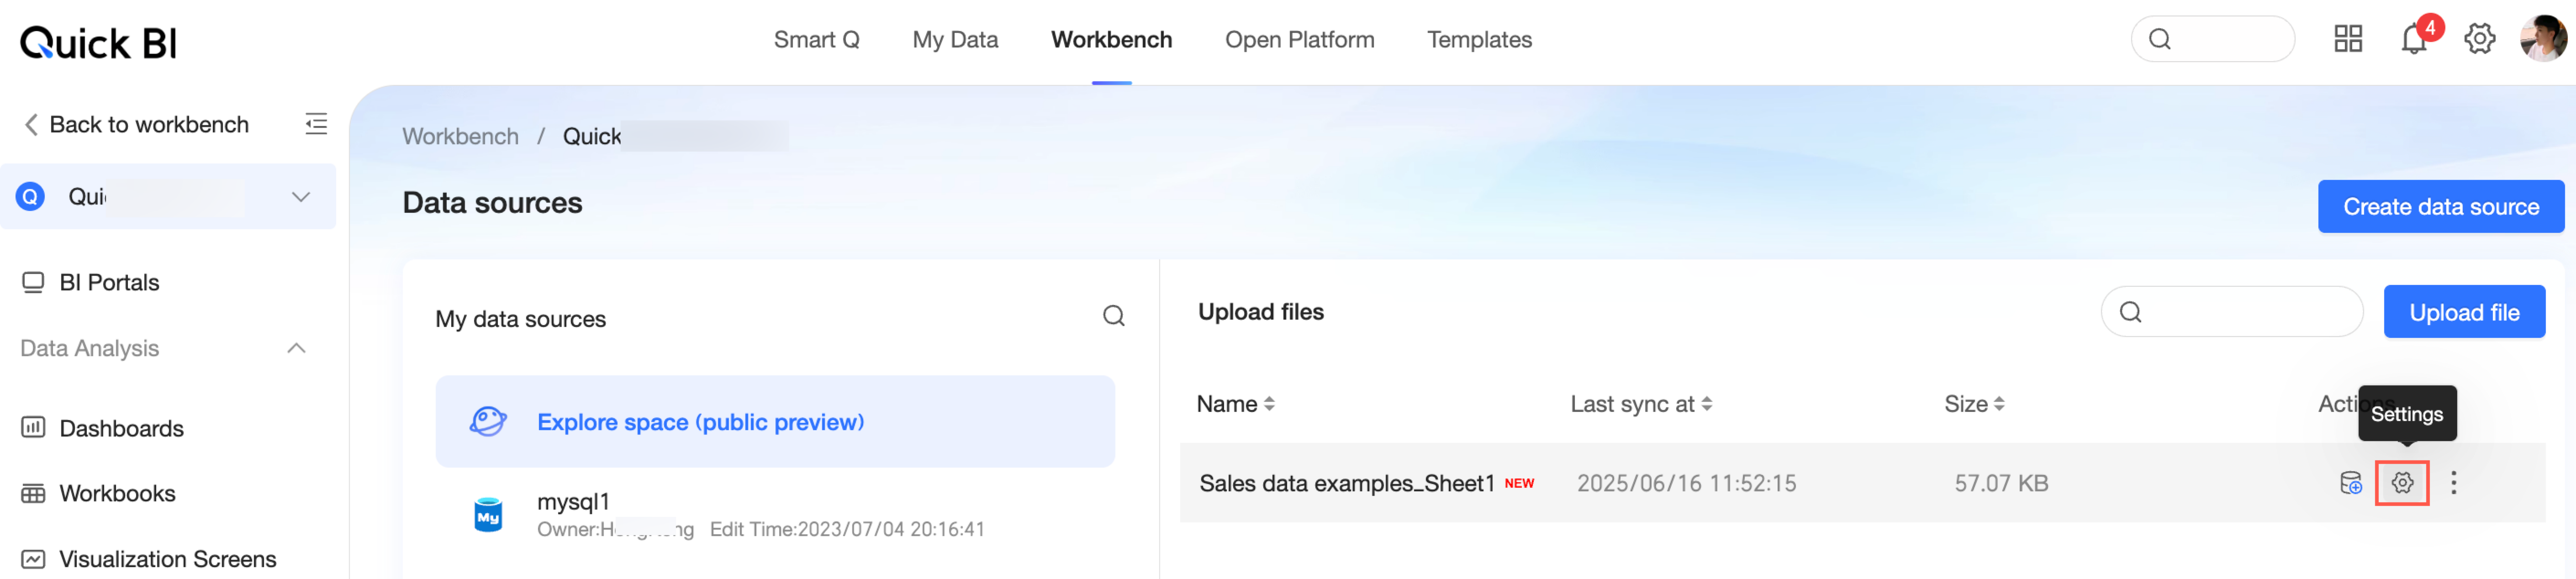
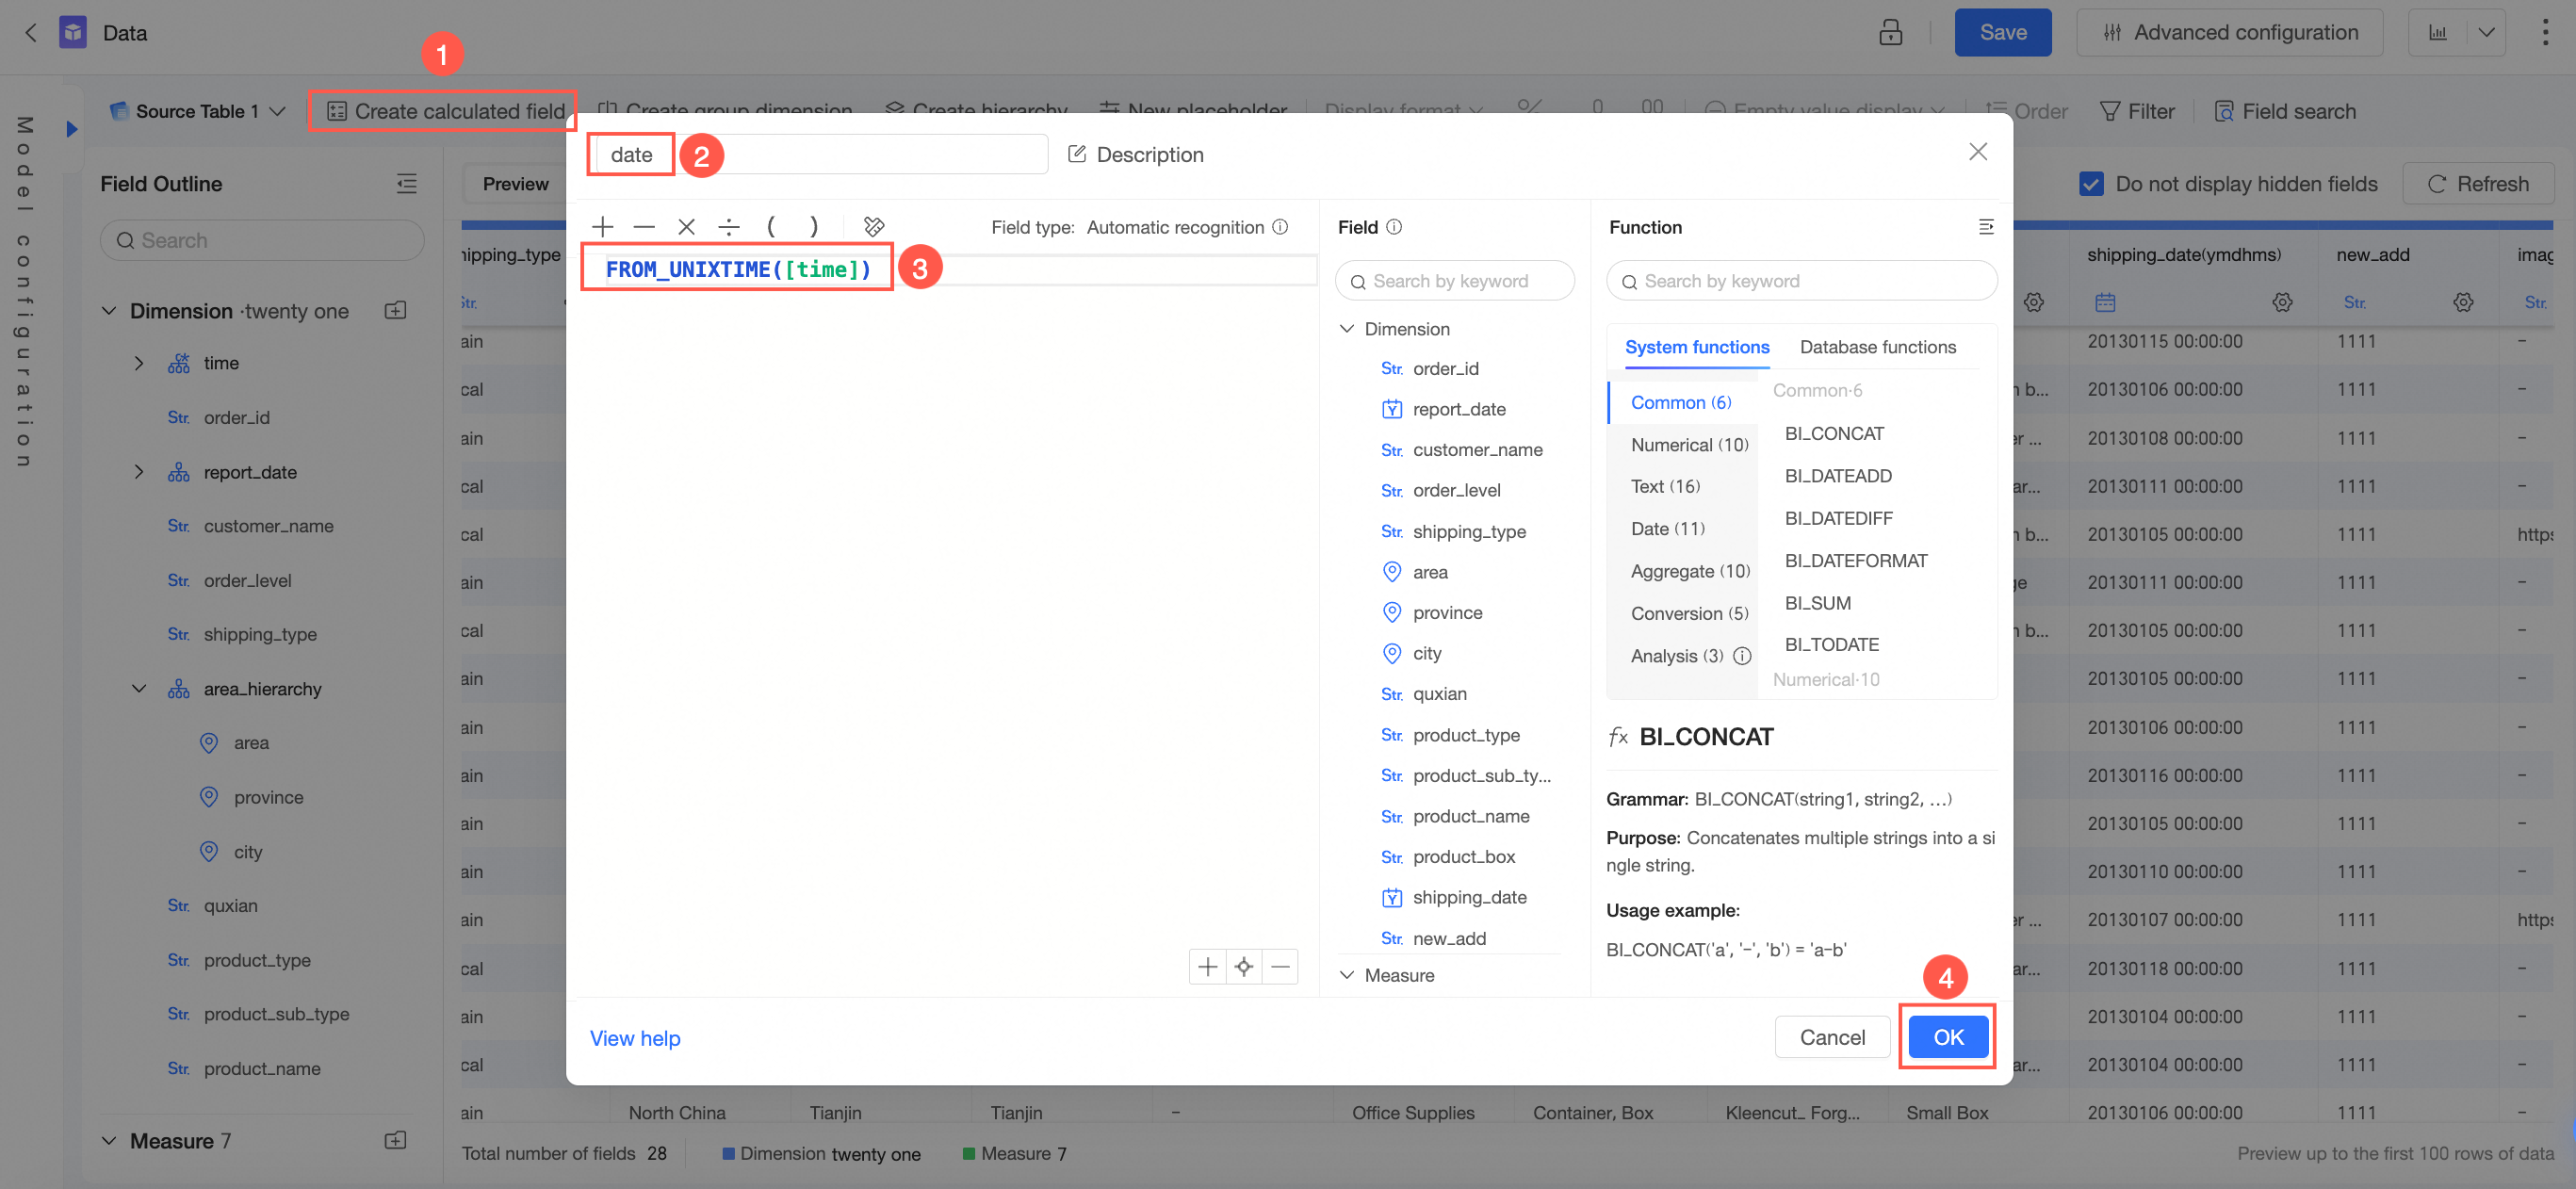
Convert Unix timestamps to date/time
If a time field is stored as a Unix timestamp with a data type of Text or Number, use the from_unixtime function to convert it to a standard date/time field.
On the dataset edit page, create a calculated field as shown below.

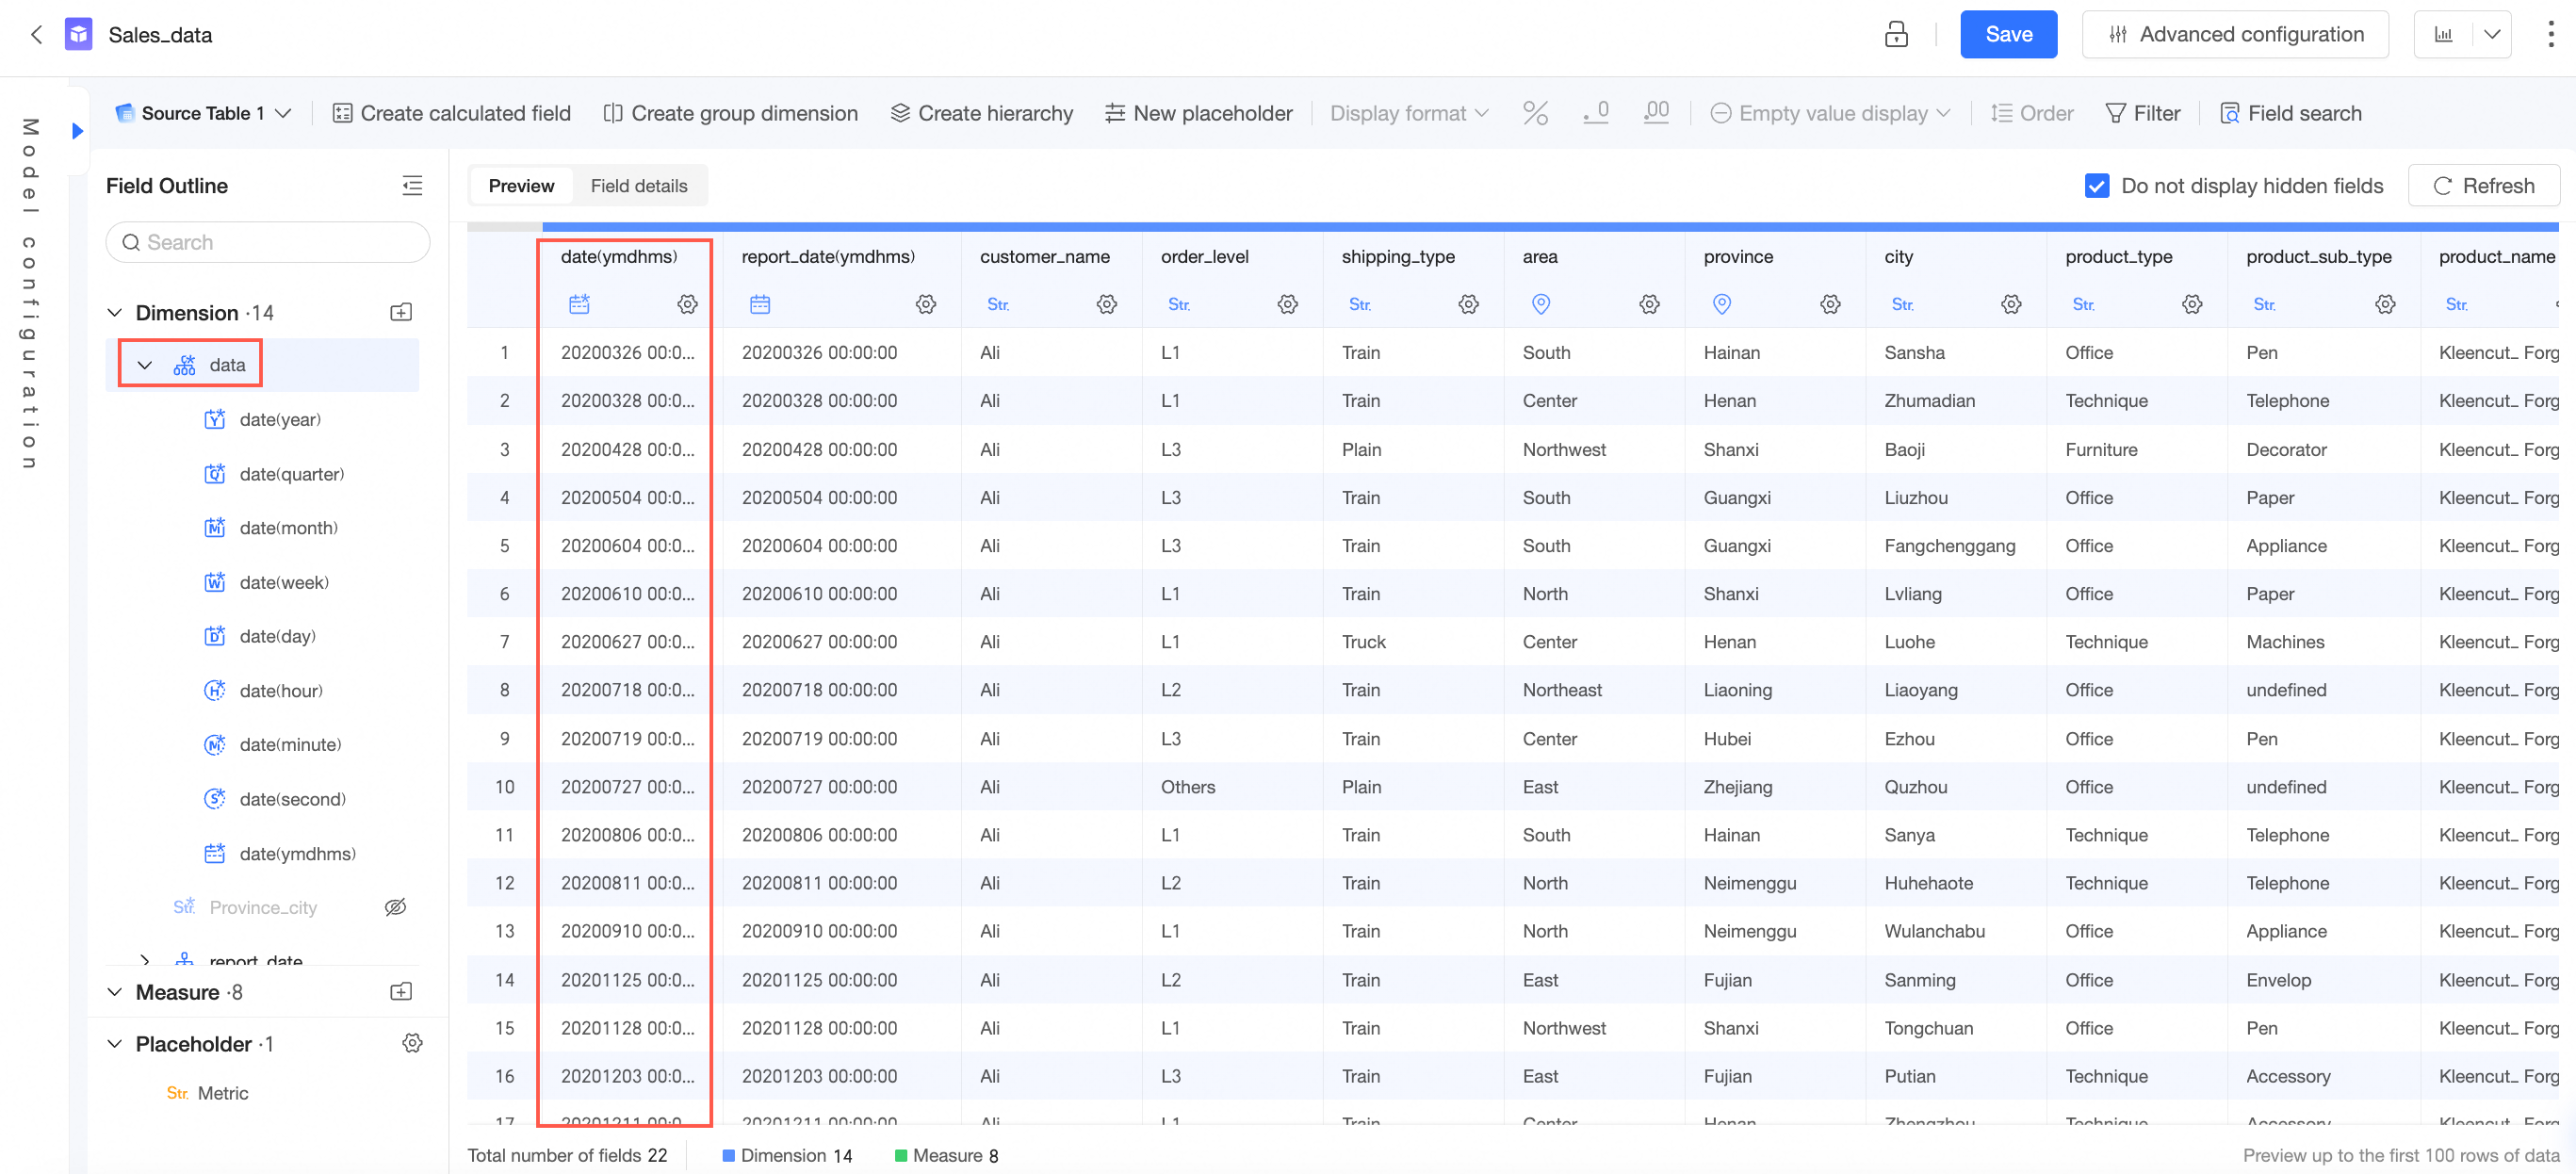
Save and refresh the dataset.
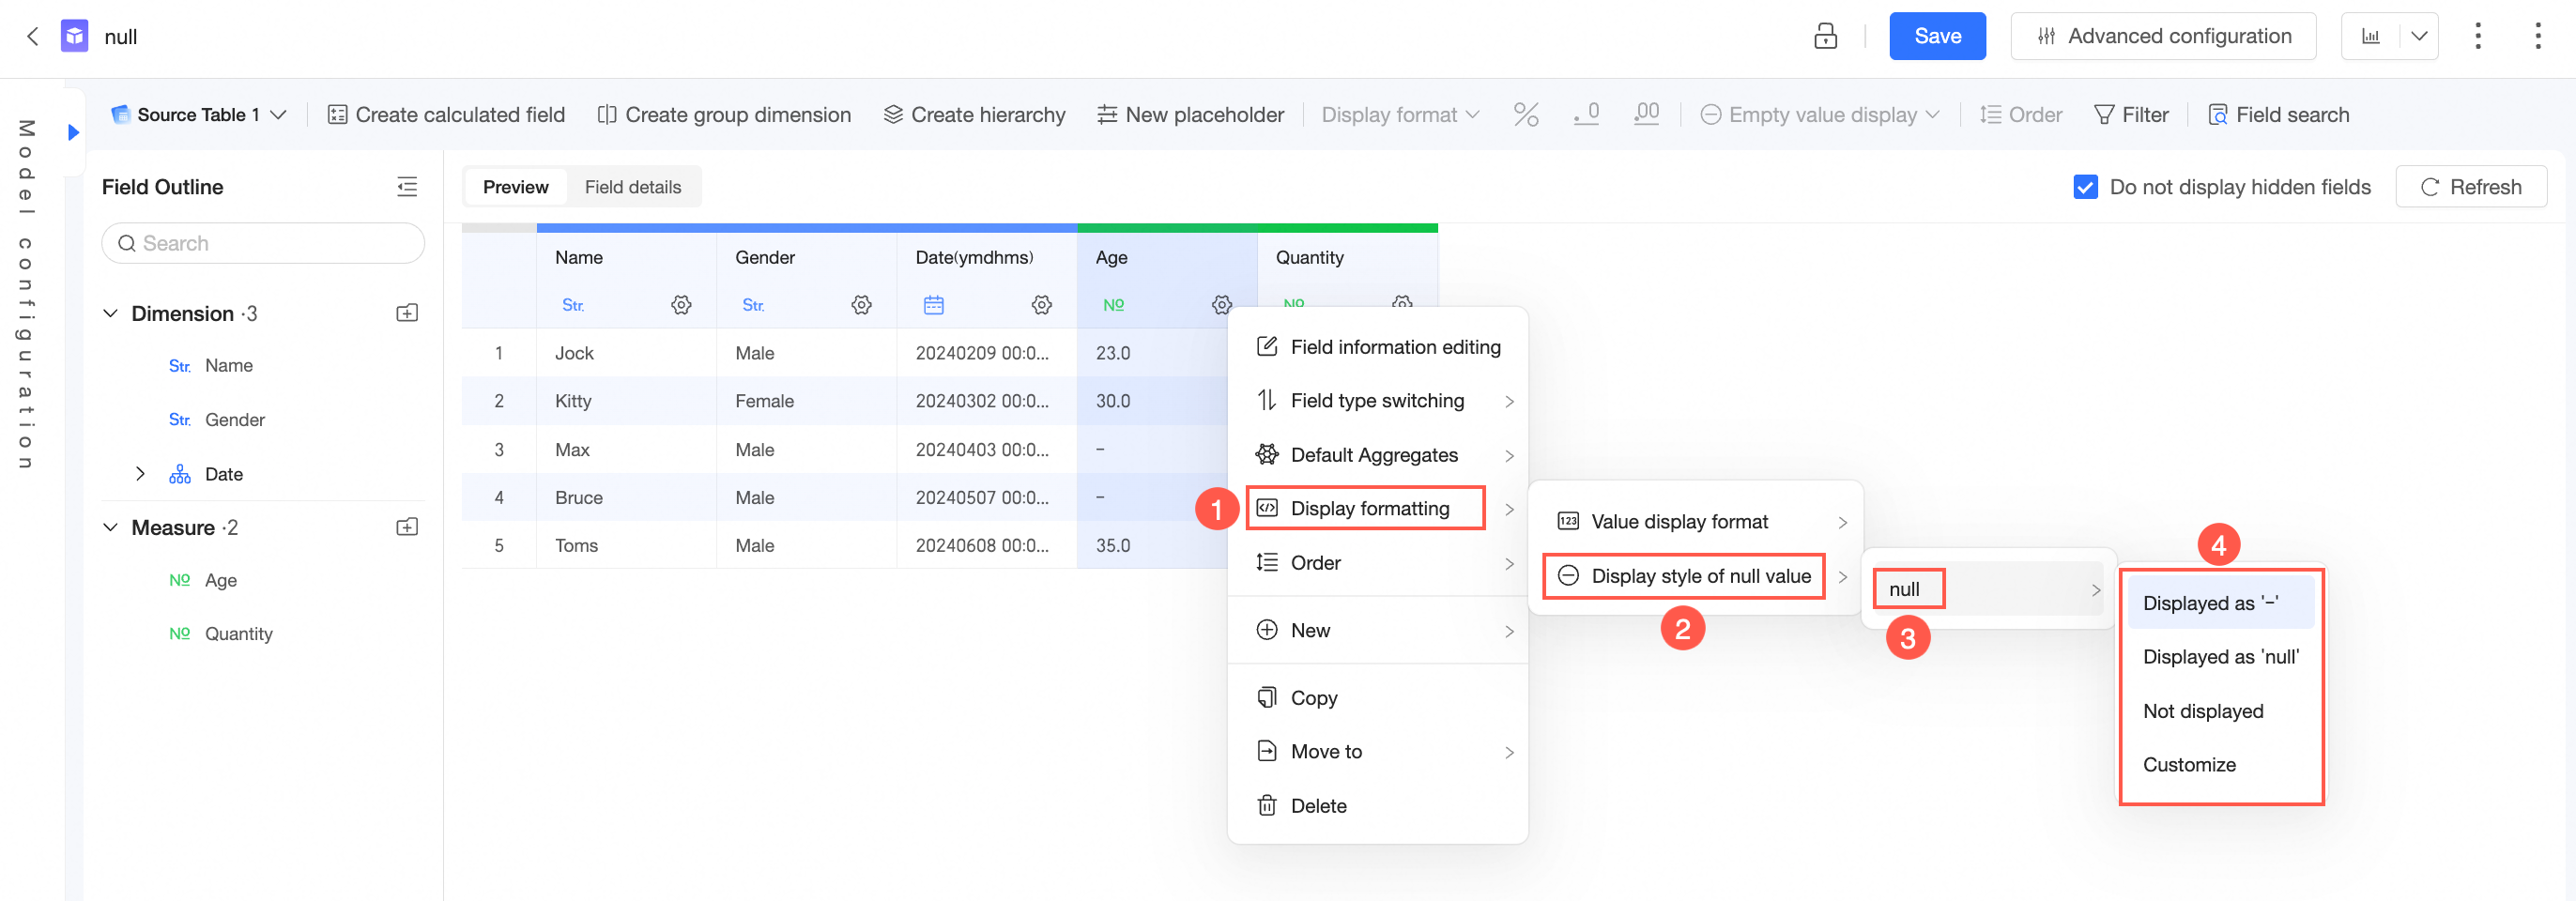
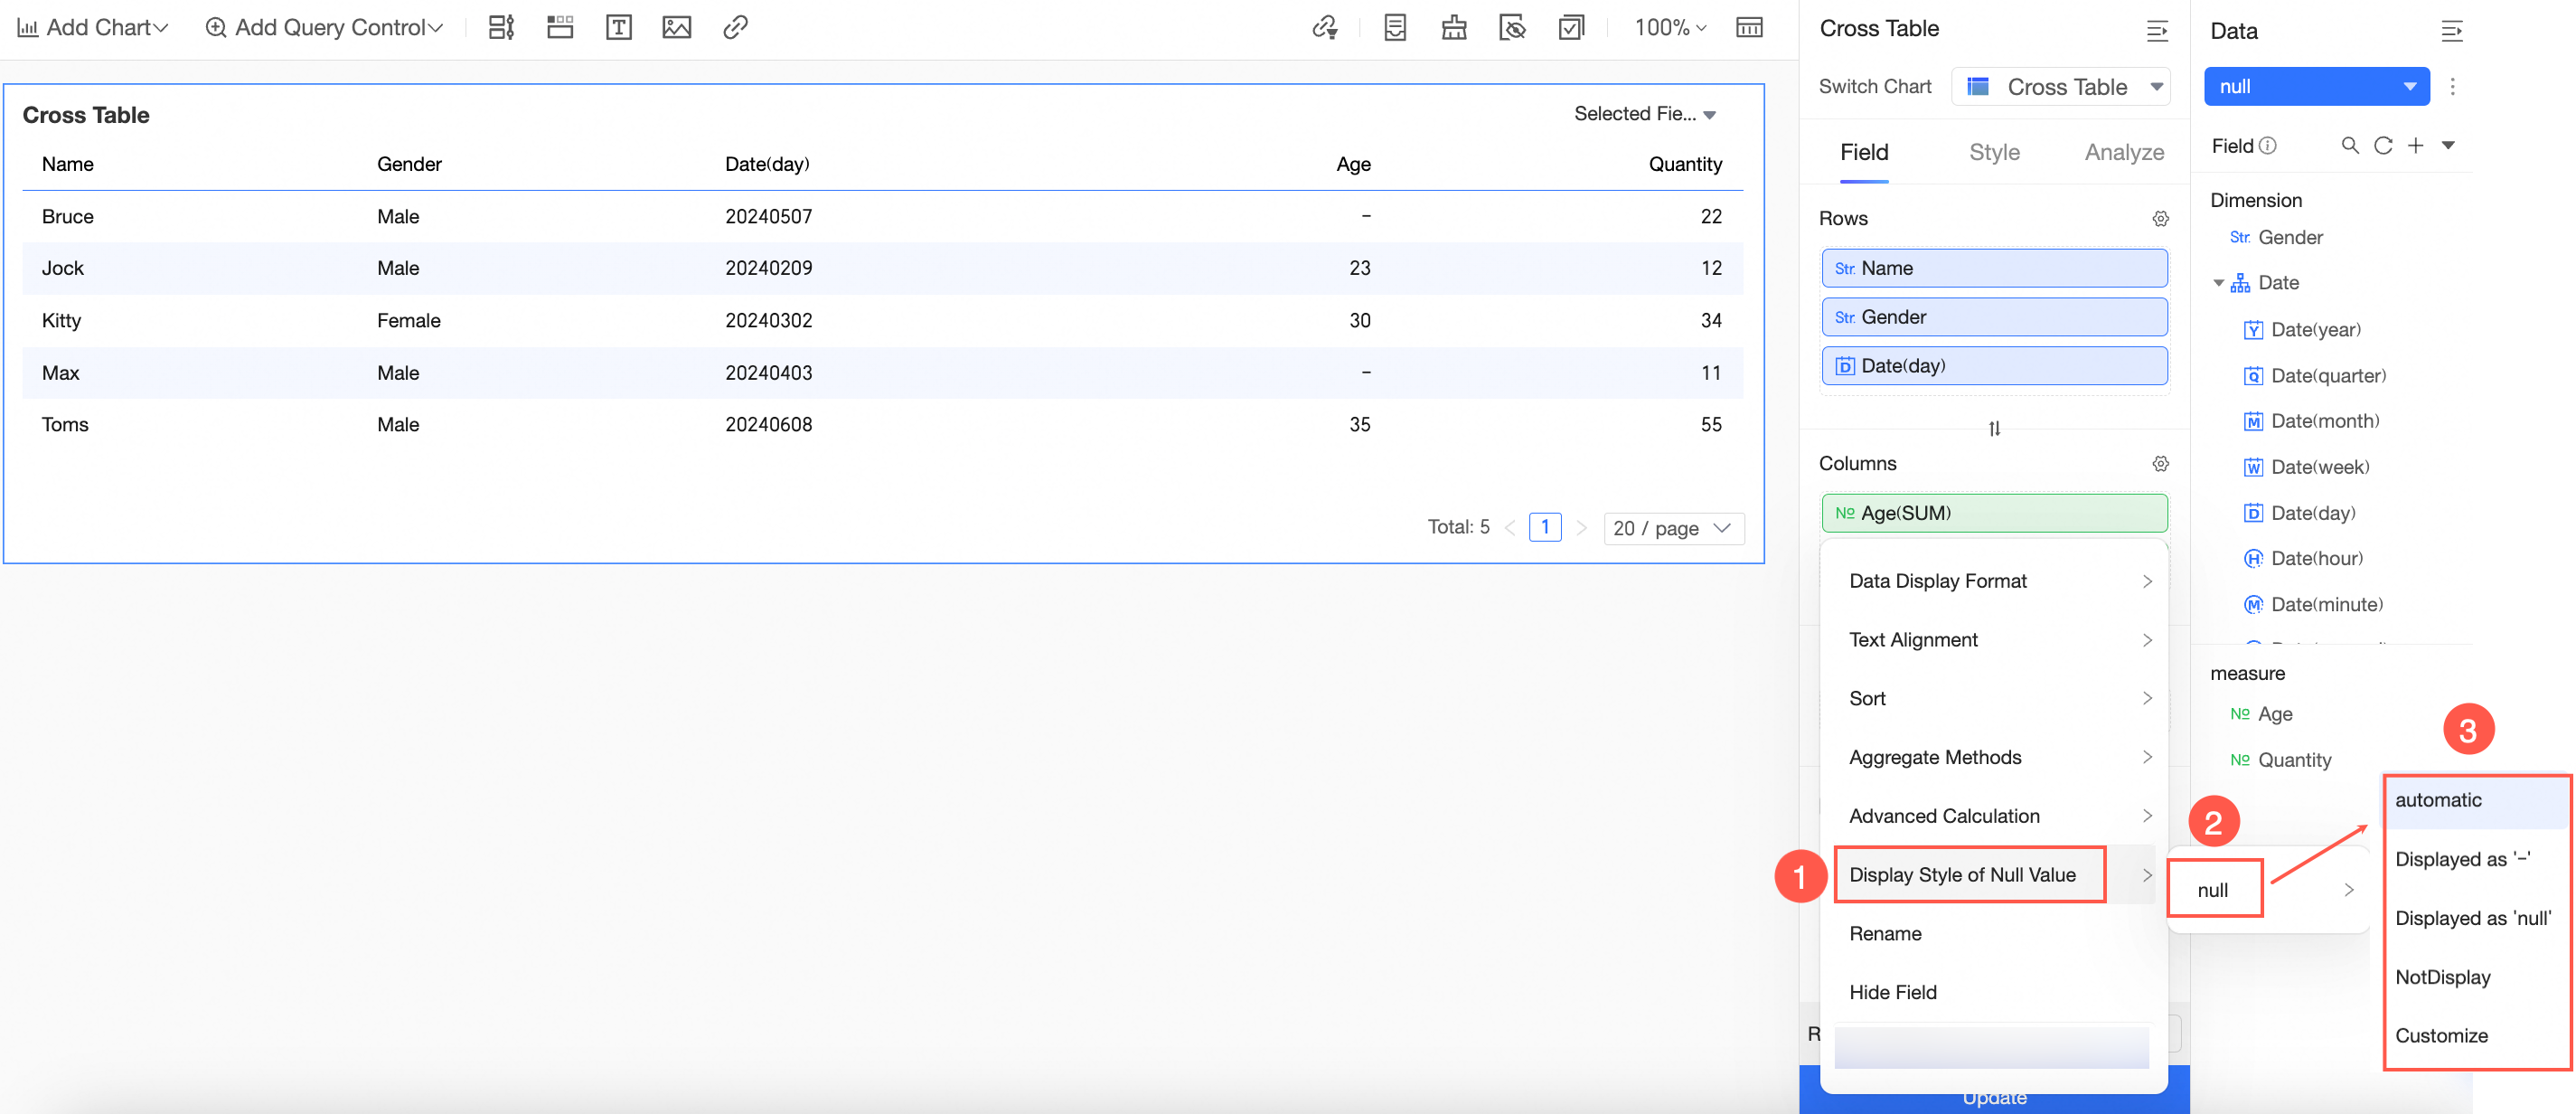
Configure display of null or empty values
Configure the display style for empty values in the dataset settings.
Configure the display style for empty values in the dashboard settings.
Use parameterized SQL for ratio calculations
Quick BI does not natively support ratio calculations, but you can implement them with parameterized SQL in a custom dataset.
The following example calculates each city's share of its province's total sales, with user-selectable date range and province/city filters. The dataset has four fields: date (date), province (province), city (city), and sales amount (order_amt).
select a.city,sum(fenzi)/sum(fenmu) as ratio
from
(select province,city,sum(order_amt) fenzi
 from  zhanbi_test
 where  $expr{date:date_para}
 and    $expr{province:province_para}
 and    $expr{city:city_para}
 group by province,city
)a
left  join
(select province,sum(order_amt) fenmu
 from  zhanbi_test
 where  $expr{date:date_para}
 and    $expr{province:province_para}
 and    $expr{city:city_para}
 group by province
)b on a.province=b.province
This query aggregates by the city field; you can adapt it to aggregate by other fields. After generating the SQL, convert the date field to a date type in the dataset's parameter settings, then create the dataset and add it to a dashboard.
Use parameterized SQL for cumulative calculations
Quick BI has several built-in cumulative calculation types: Year-to-Date, Historical Cumulative, Month-to-Date, Quarter-to-Date, and Custom. If the dataset has a fiscal year configured and the date field is a fiscal year field, day-level granularity also supports Fiscal Year-to-Date and Fiscal Quarter-to-Date. For details, see Date Accumulation.
For built-in cumulative calculations, select a date-type day field in dimensions, as shown below.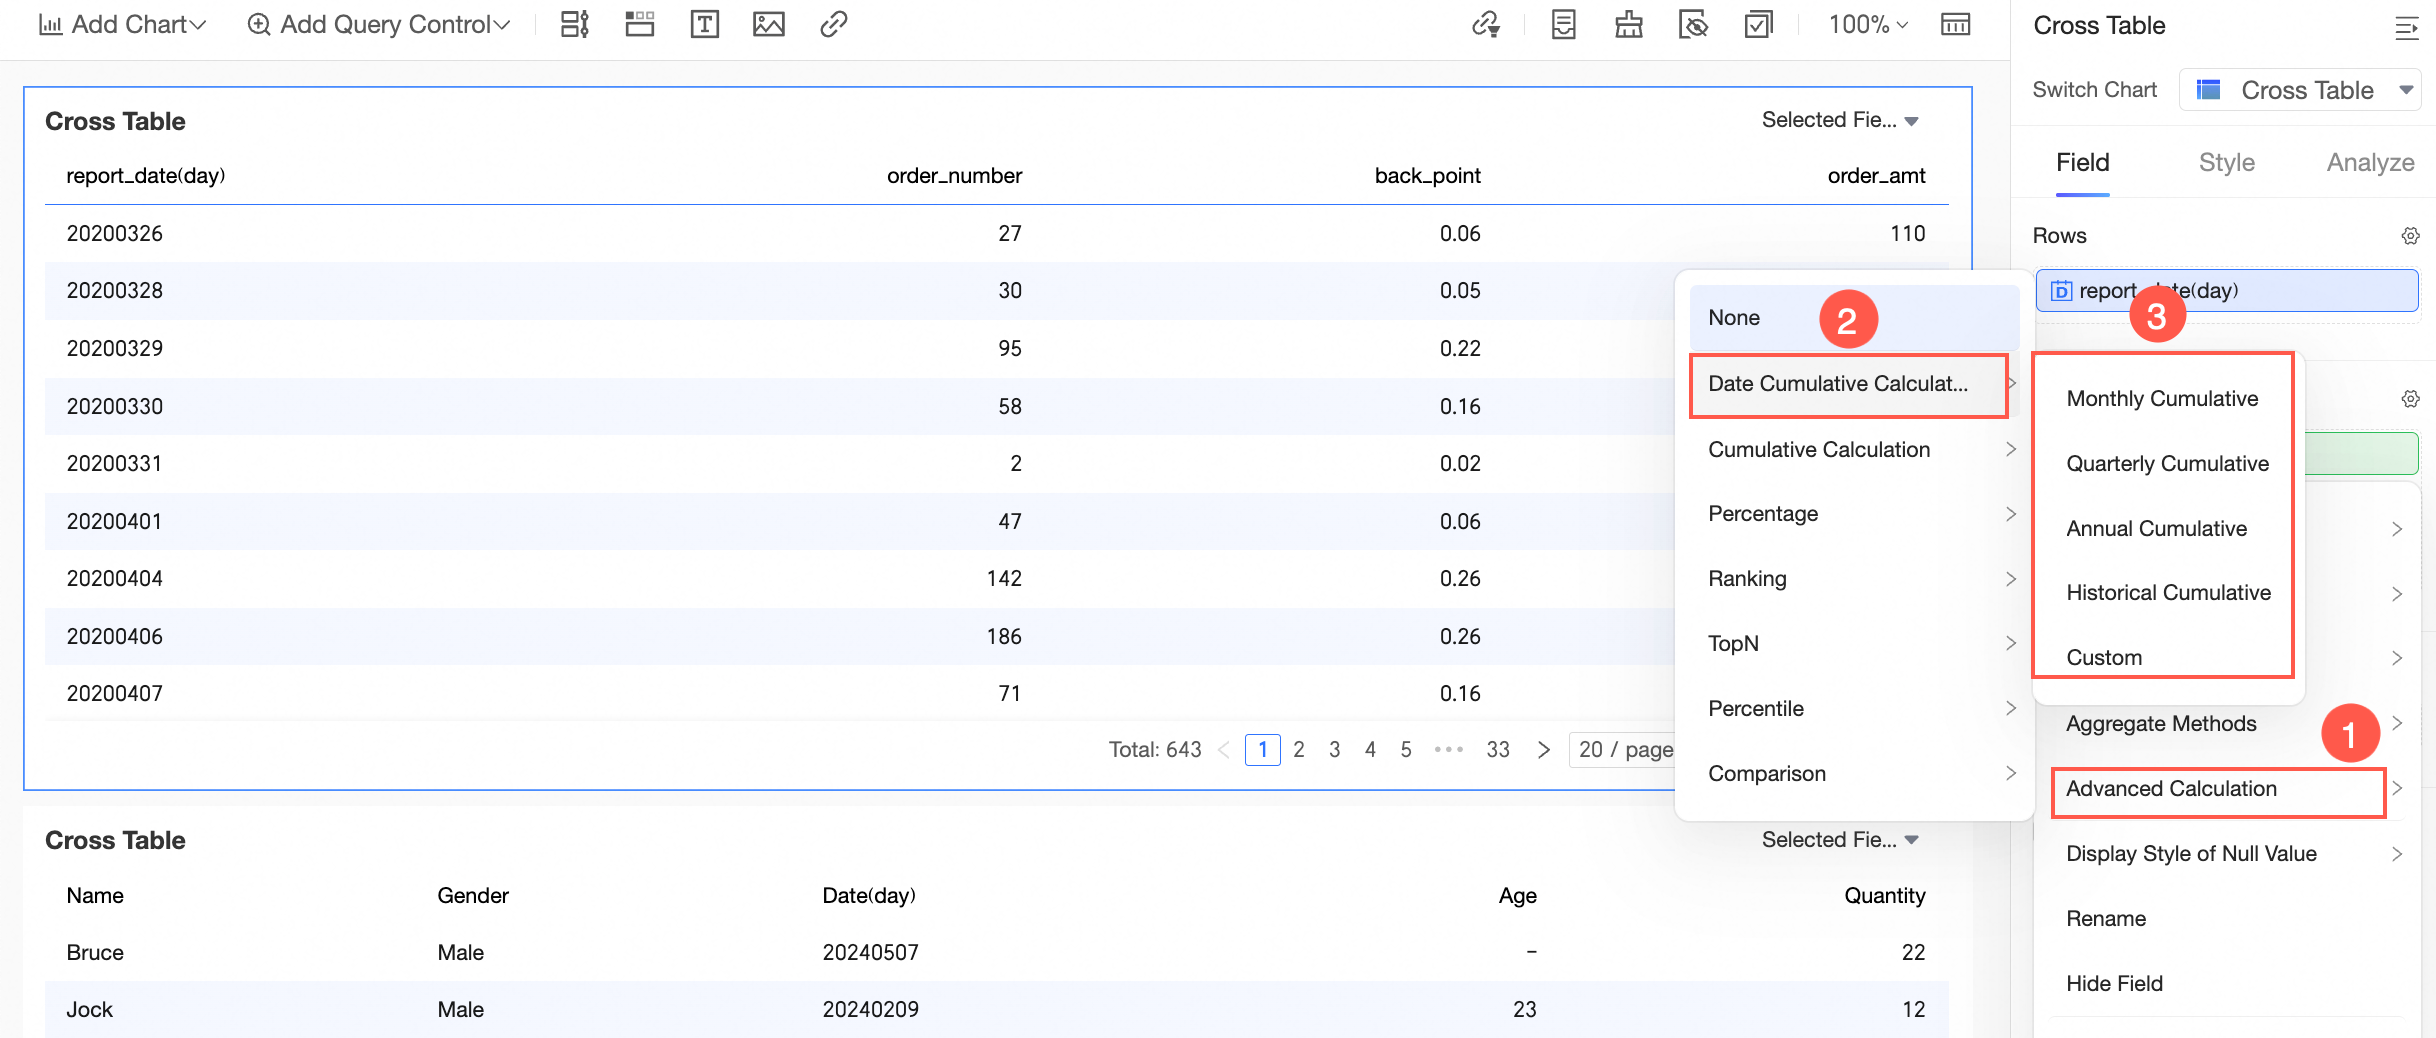
To calculate cumulative values over a custom time period, use parameterized SQL. The following example computes a monthly cumulative total:
select  a.mon_date,avg(a.order_num) order_num,sum(b.order_num) add_num
from (
select date_format(report_date,'%Y/%m') mon_date,count(distinct order_id) order_num,max(date_format(report_date,'%Y/%m')) max_mon_date
from  company_sales_record_copy
where  $expr{report_date:month_date}
group by date_format(report_date,'%Y/%m')
)a
left join(
select date_format(report_date,'%Y/%m') mon_date,count(distinct order_id) order_num
from  company_sales_record_copy
where  $expr{report_date:month_date}
group by date_format(report_date,'%Y/%m')
)b on a.max_mon_date>=b.mon_date
group by a.mon_date
When the query control is linked to the parameter field in the dashboard, filtering by a month range returns the cumulative value for each month starting from the first month of the range.
Query last N days with a single date
By default, selecting a single date in Quick BI shows data for that day only, while selecting a range shows data for the full range. To display both a specific day and the N days leading up to it across two separate charts, use parameterized SQL with date offset expressions:
select   report_date,area,product_type,count(distinct order_id) order_num
from   company_sales_record
where  area in ('Southwest','Northwest','North China')
and    ( $expr{dateadd(report_date,1,'dd'):date1}
or      $expr{dateadd(report_date,2,'dd'):date1}
or      $expr{dateadd(report_date,3,'dd'):date1})
group by area,product_type,report_date
Row-level security
Yes. For more information, see Row-level security.
Default row display limit
By default, 100 rows are displayed.
Pagination in data view
No.
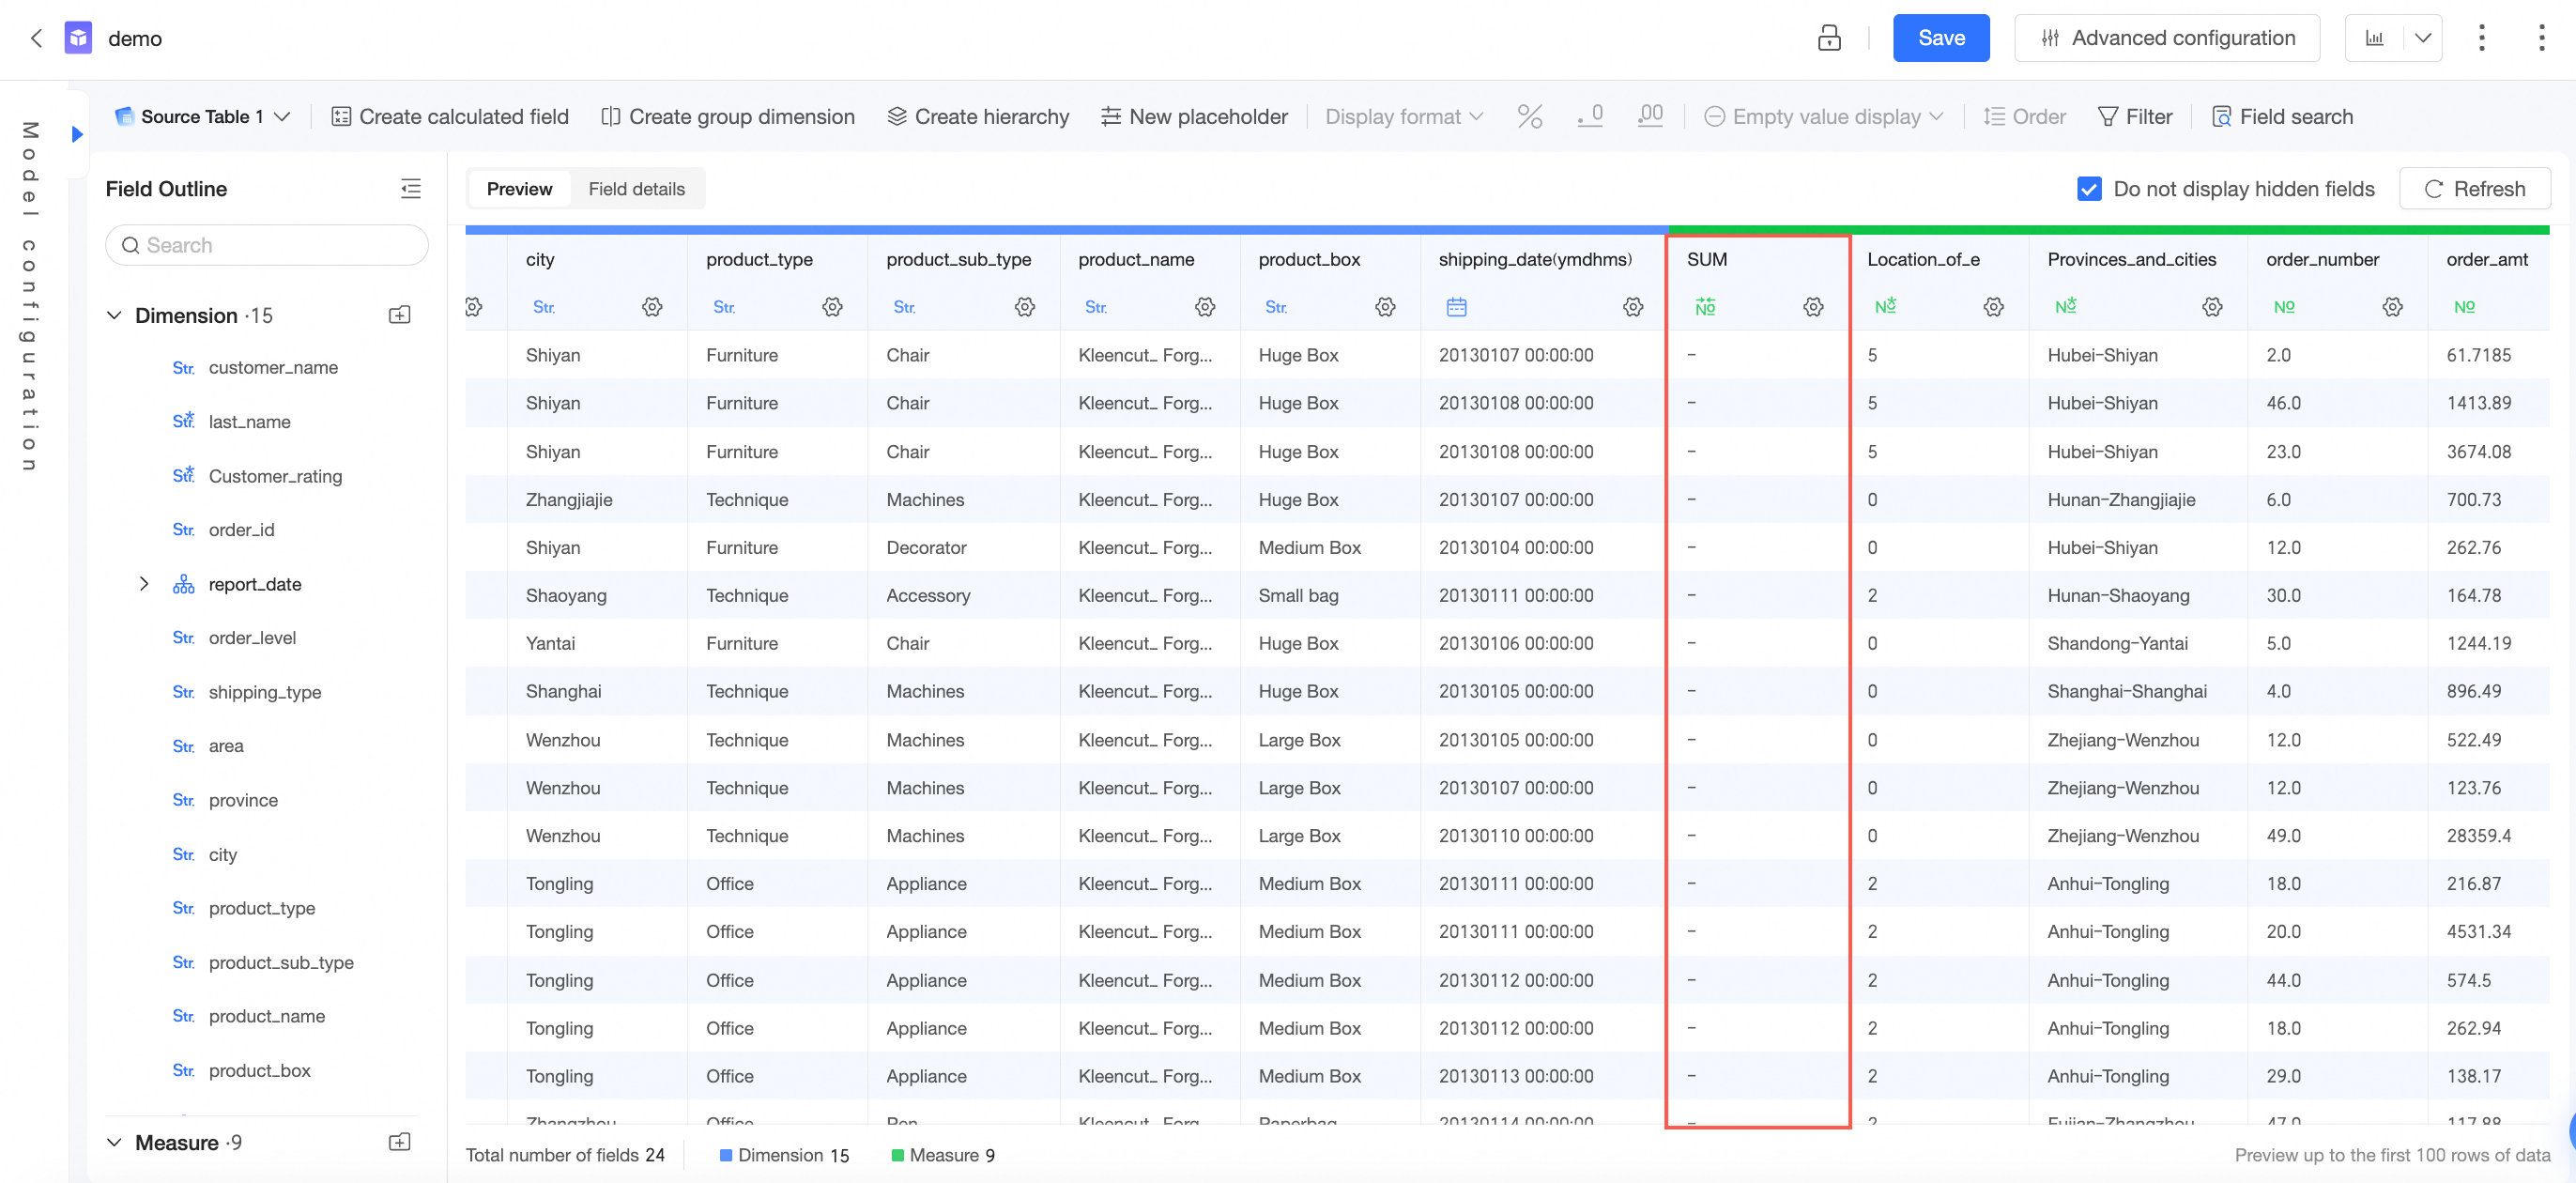
New fields not displayed
Aggregated calculated fields are not shown in the data preview.
Use geographic data in map charts
On the dataset edit page, change the dimension type of your geographic field to the appropriate geographic information type.
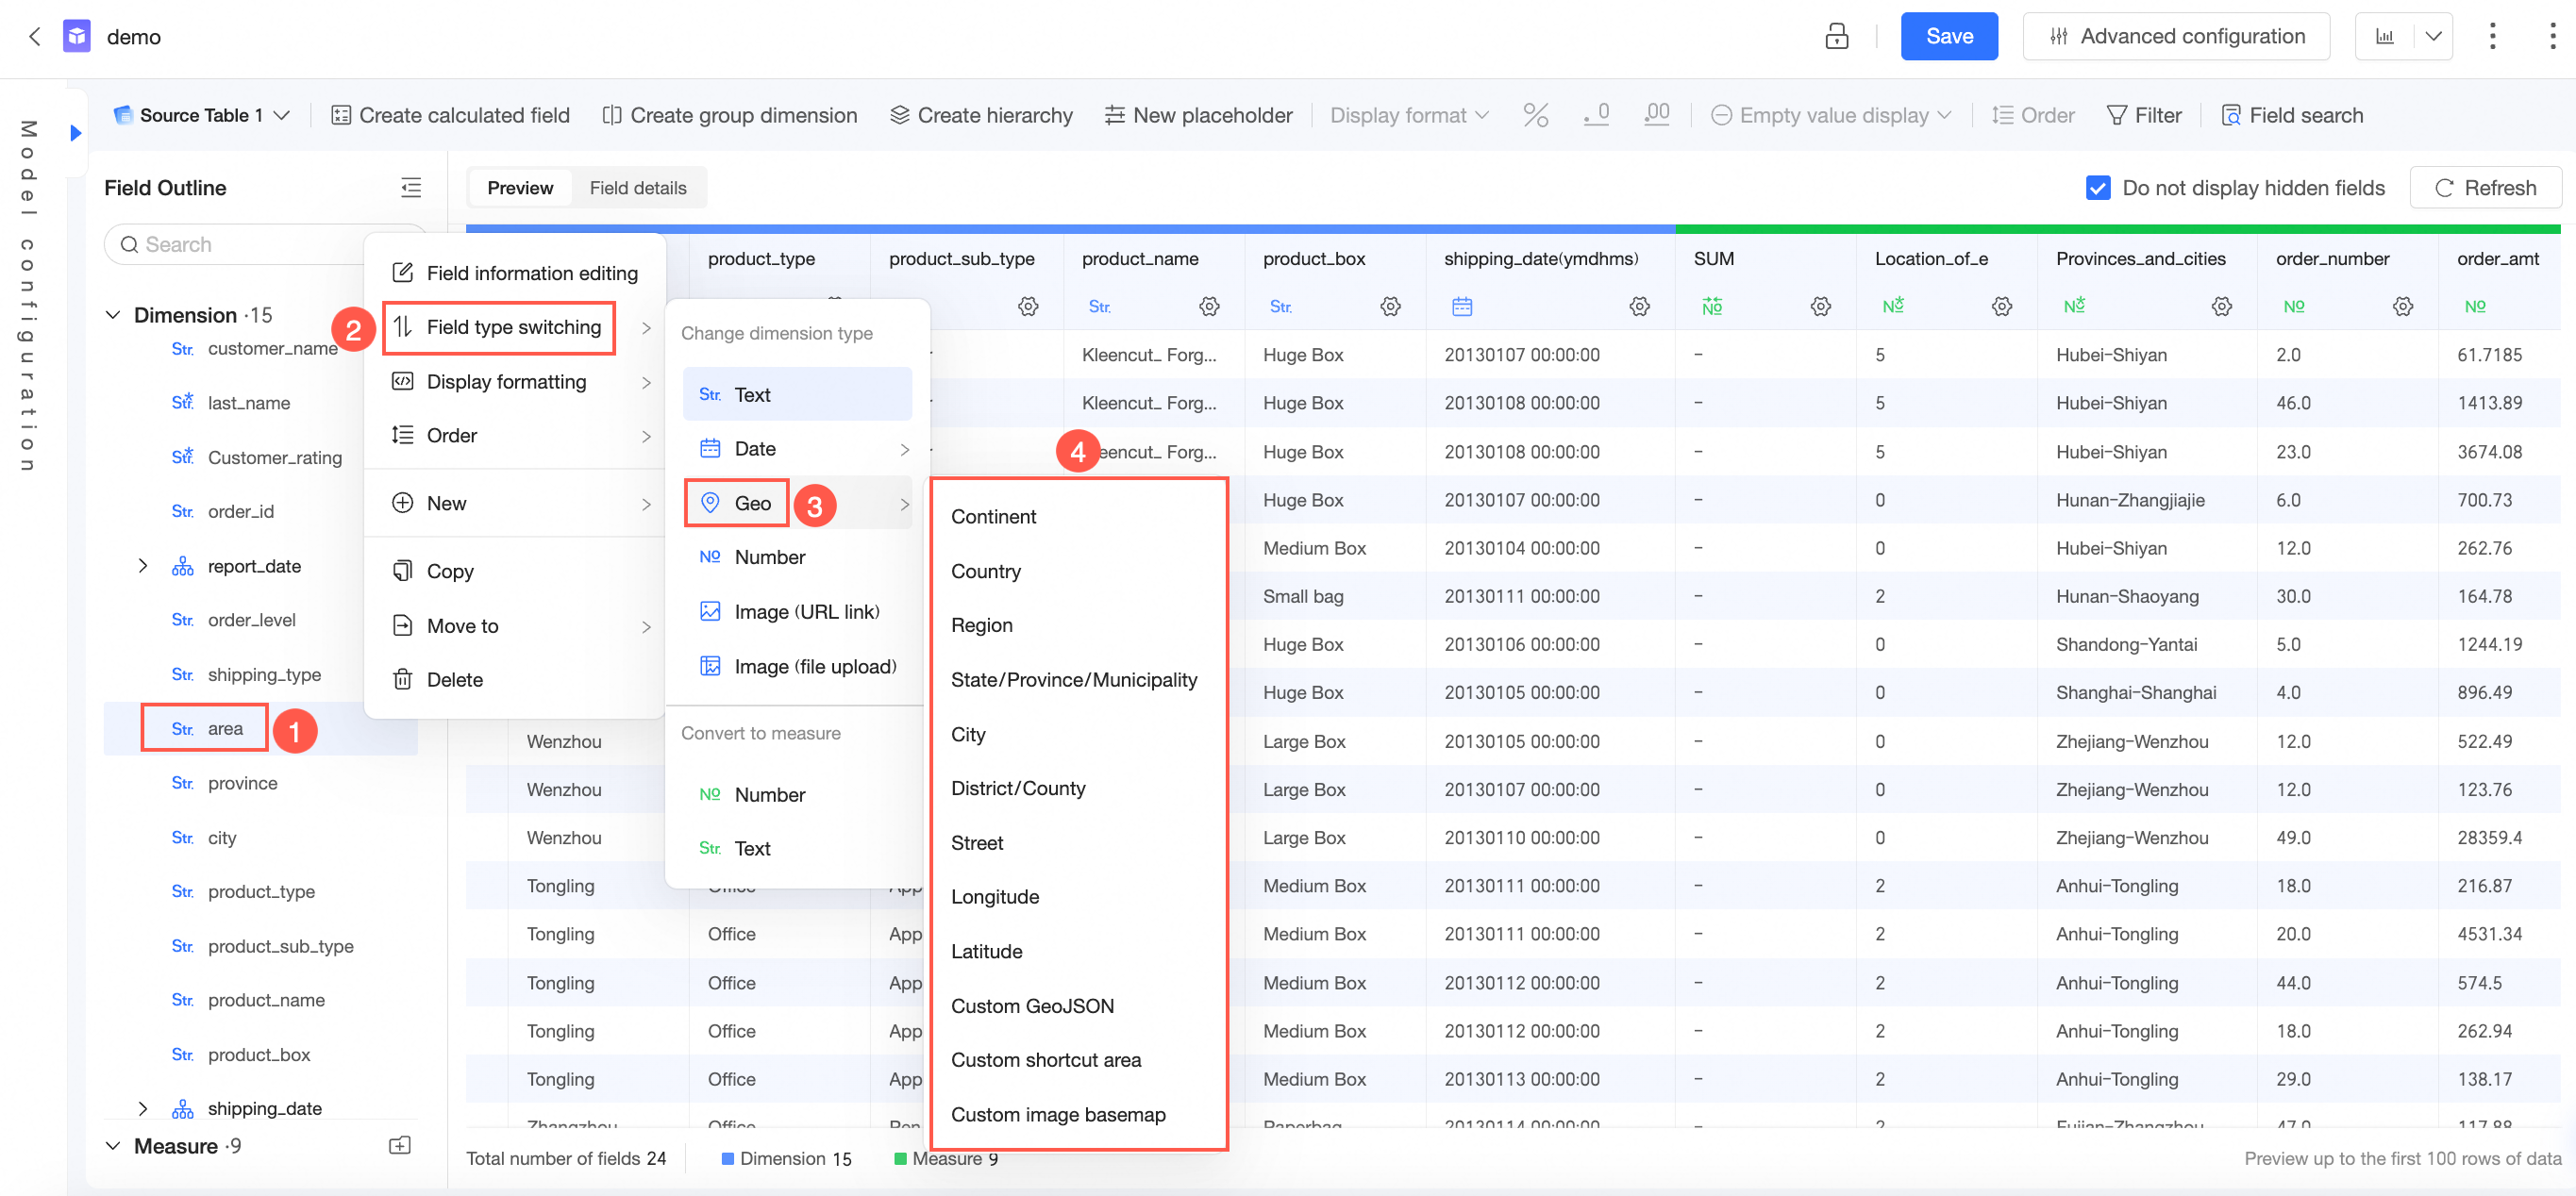
For details, see Create a dataset.
Use field descriptions as names
In workspace settings, you can configure whether to use table names or remarks when creating datasets in that workspace.
You can also select multiple fields in the dataset's bulk field configuration panel and batch-apply their descriptions as field names.
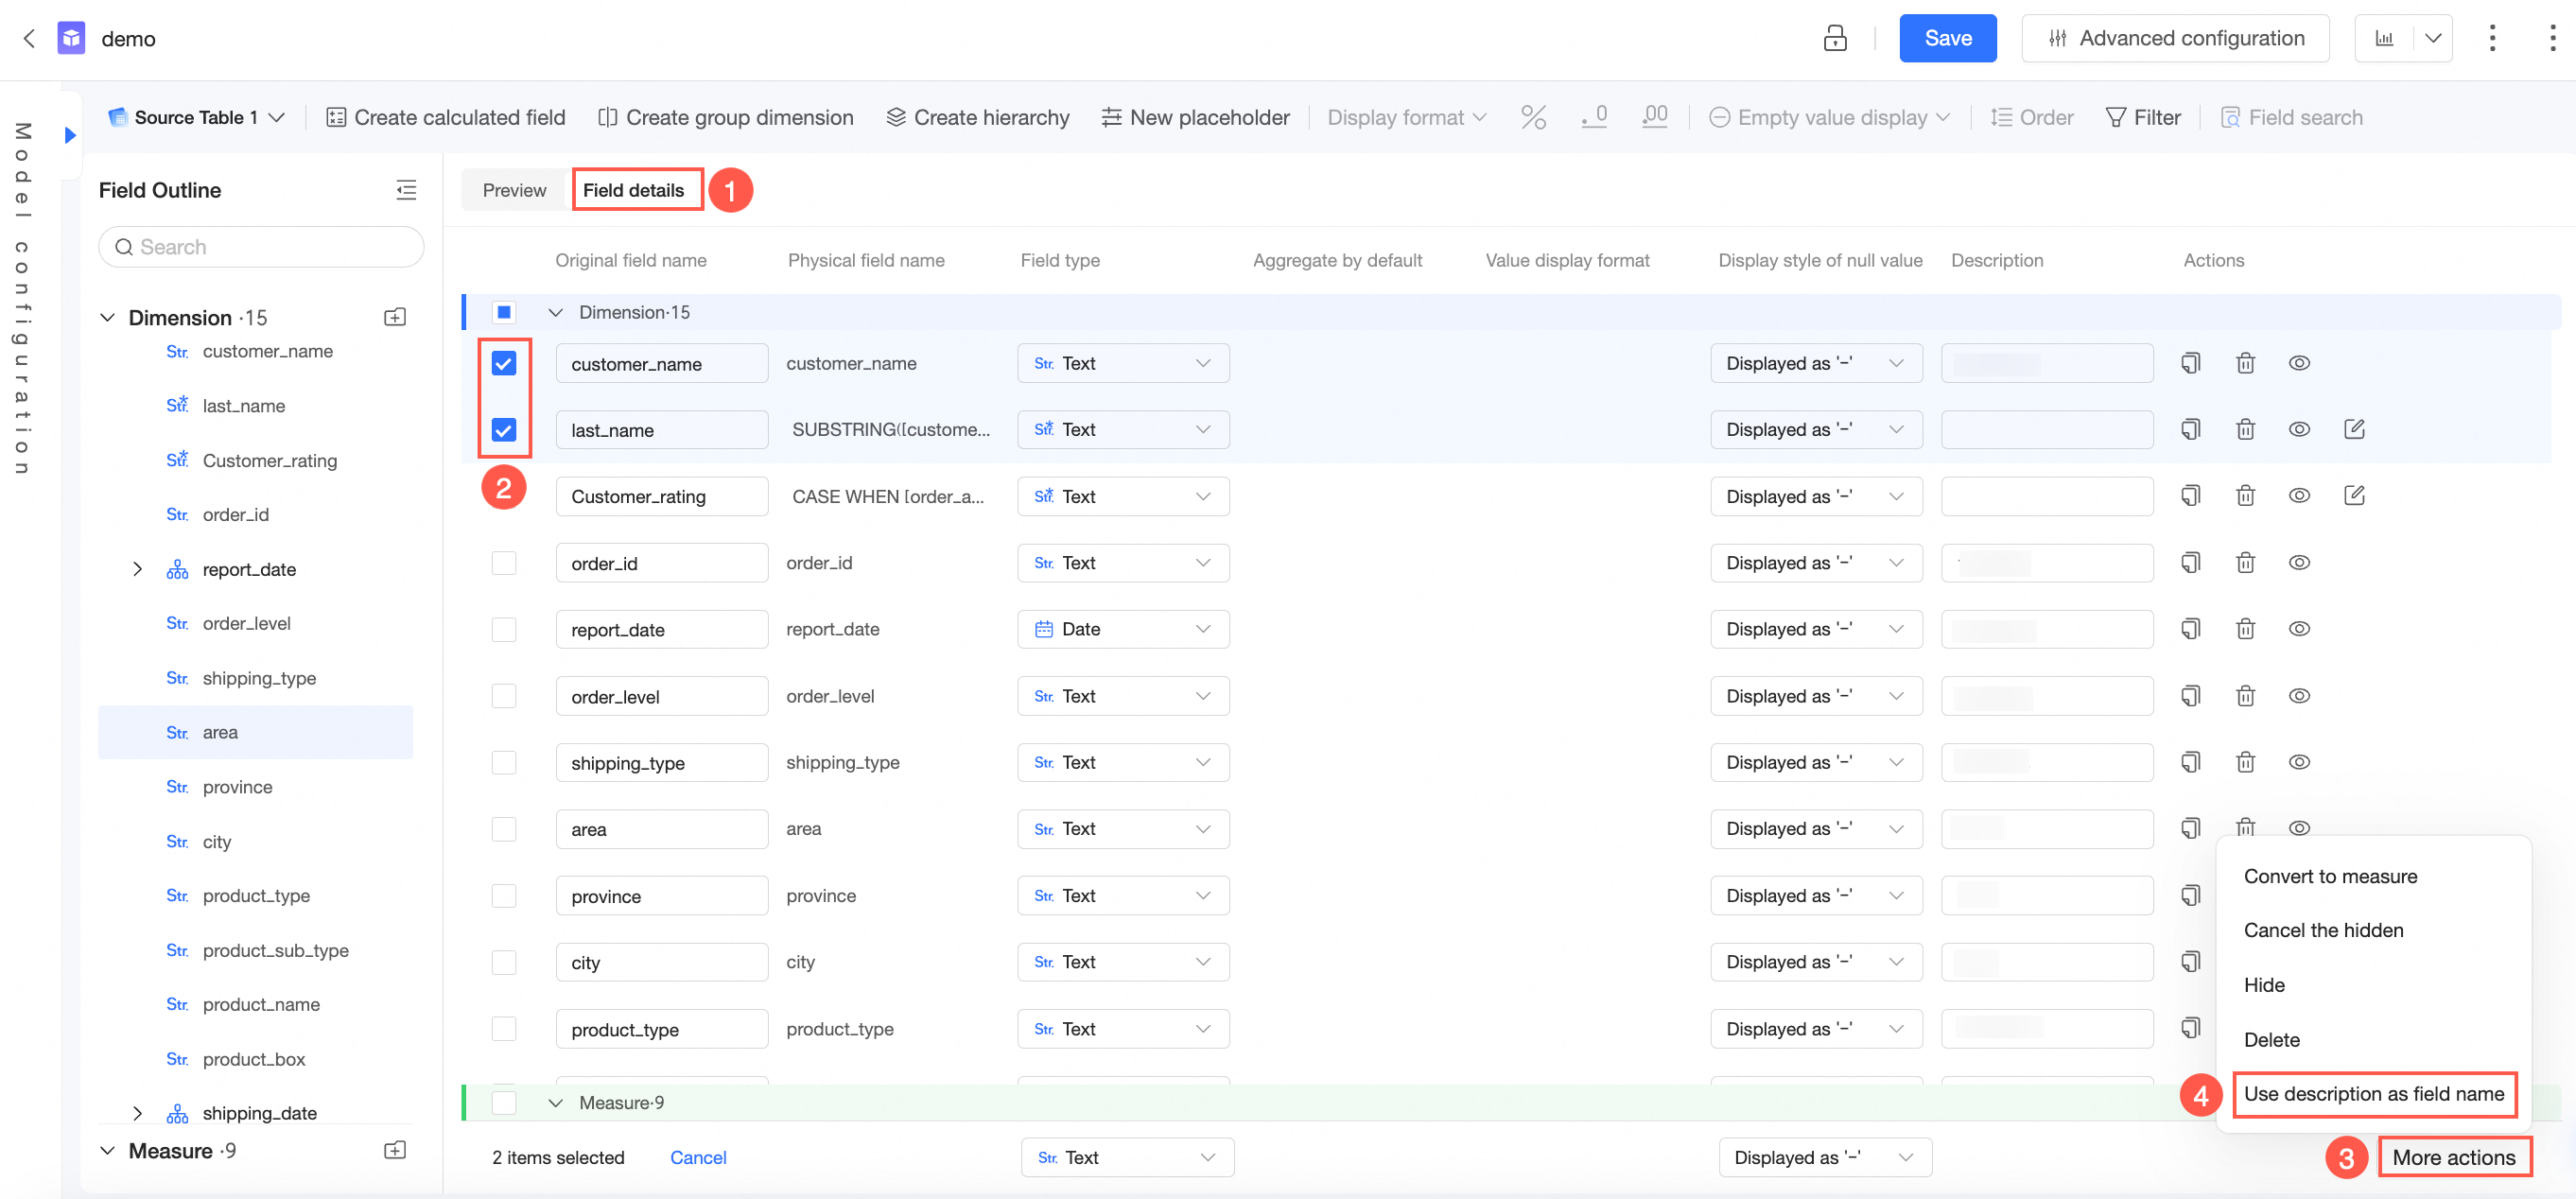
If a field's description is empty, it cannot be used as the field name.
If you create a dataset using custom SQL, set field aliases in the statement. These aliases serve as the displayed field names.
Update datasets after table changes
When a physical field is no longer found, Quick BI does not automatically remove it — the field may still be referenced in analyses or upstream dashboards. Click the table on the canvas to view field changes in the right panel, then delete all invalid fields at once with a single click.
Create datasets from multiple databases
Drag tables from both data sources onto the canvas, configure a relationship between them. After acceleration with the Quick Engine, the data is ready to use. For data sources that support Quick Engine, see Data source feature list.
Copy datasets to another workspace
Use the copy dataset across workspaces feature. For details, see Copy a dataset across workspaces.
Configure data models for multi-table analysis
For more information, see Build a model.
Configuring a data model defines JOIN relationships between tables. Set it up on the dataset editing page. For details, see Build a model.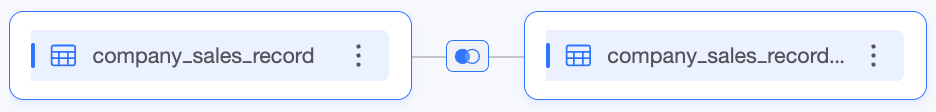
Benefits of dataset query caching
Enabling query result caching speeds up report access and reduces database load. After the first request, subsequent queries within the cache duration are served from cache — the database is not queried again until the cache expires.
Optimize slow SQL dataset queries
Optimize the SQL logic: verify indexes are being used, and replace complex joins with database views where possible.
Set globally effective default values for SQL placeholders to prevent full table scans when no filter is applied.