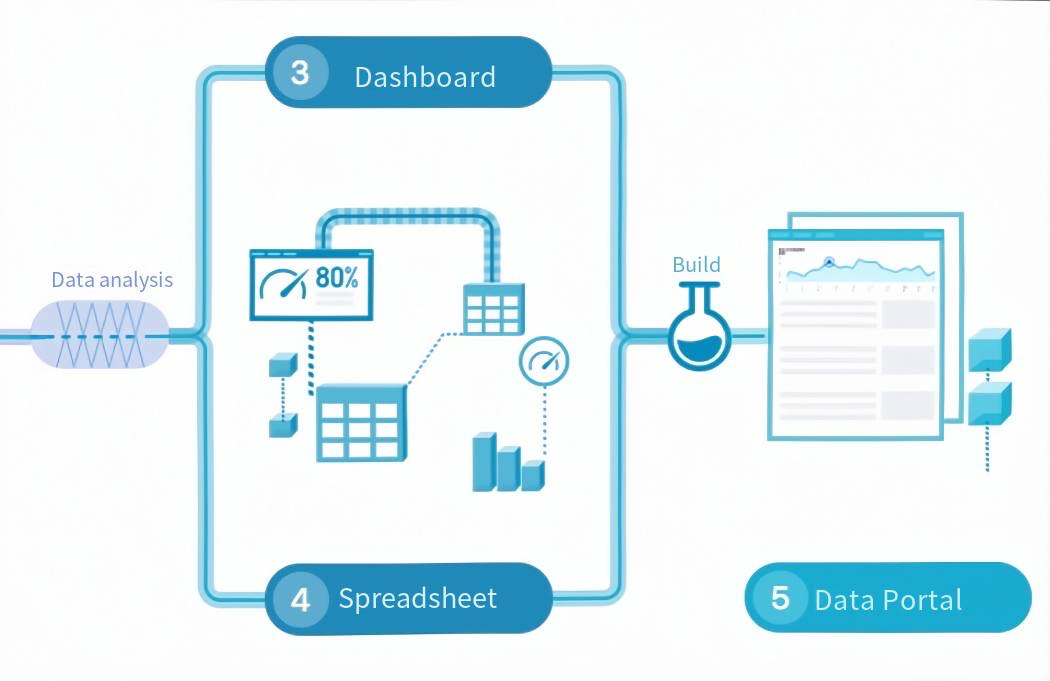
Data analysis
Quick BI provides six analysis tools that cover the full spectrum of data visualization and exploration — from building executive dashboards to letting business users query data independently without IT support.
Dashboards: Build interactive charts and visualizations using over 50 chart types. Anyone on your team can explore data visually.
-
Workbooks: Perform complex data analysis using over 400 Excel-compatible functions. Best for analysts already comfortable with spreadsheets.
NoteThe workbook feature is available in Quick BI Pro and Quick BI Enterprise Standard.
BI portals: Create tailored data displays for a range of scenarios, including executive briefings, public-facing screens, real-time operations monitoring, and project presentations.
Exploratory analysis: A lightweight exploration tool for business users. Drag and drop fields to analyze data, get smart chart recommendations, and apply advanced calculations — without being locked into a fixed dashboard layout.
-
Self-service data retrieval: Let business users query and download detailed reports with millions of rows. IT sets up the datasets; business users independently select the fields they need, reducing ad hoc data requests to your IT team.
NoteThis feature is available in Quick BI Enterprise Standard.
Ad-hoc analysis: A tabular analysis tool for frontline business users. Drag and drop to explore data in a familiar table format.
Data analysis workflow