Quick BI lets you reuse component resources from other dashboards in the same workspace or from the template marketplace to build reports quickly and efficiently.
Function overview
Reuse component resources is a toolbar feature in the Quick BI dashboard editor. It lets you copy pre-configured charts, controls, or other elements from other dashboards into the one you are currently editing. Source dashboards can be those published by you or your colleagues, or templates from your company or the official marketplace.
Benefits
-
Improve efficiency: Reuse common layouts and charts, such as sales trend charts or user popularity cards, with a single click. This saves you from configuring data, styles, and interactions from scratch.
-
Maintain consistency: When you collaborate with a team or build a series of themed dashboards, reusing components helps maintain a consistent design and analytical approach.
-
Quick Launch: New users or anyone who needs to build a dashboard quickly can leverage best practices from the template marketplace to create a high-quality prototype.
Scenarios
-
Building similar dashboards: For example, to create a new Regional Sales Analysis dashboard where most charts and controls are similar to an existing National Sales Overview dashboard, reuse the relevant components from the National Sales Overview dashboard.
-
Reusing similar elements: For example, to add a well-designed rich text block or a specific logo to a dashboard, copy it directly from a company template or another published dashboard.
Limits
Note the following limits when you use this feature:
-
Source dashboard status: You can only reuse components from published dashboards. Components from dashboards that are in a draft state or are unpublished cannot be reused.
-
Selection scope: You can select components from only one source dashboard at a time, from either the current workspace or the template marketplace. After you copy a set of components, to reuse components from another dashboard, click the reuse icon again and select a new source. You cannot select and copy components from multiple dashboards in a single operation.
-
Supported component types: The main component types that support reuse include the following:
-
Controls: Tab components, rich text, and images.
-
Charts: Standard chart components, such as line charts, column charts, pie charts, and tables.
-
Other: Custom components.
-
Not all component types support reuse. The components available for reuse are those shown on the interface.
Procedure
On the dashboard editor page in Quick BI, reuse components as follows:
-
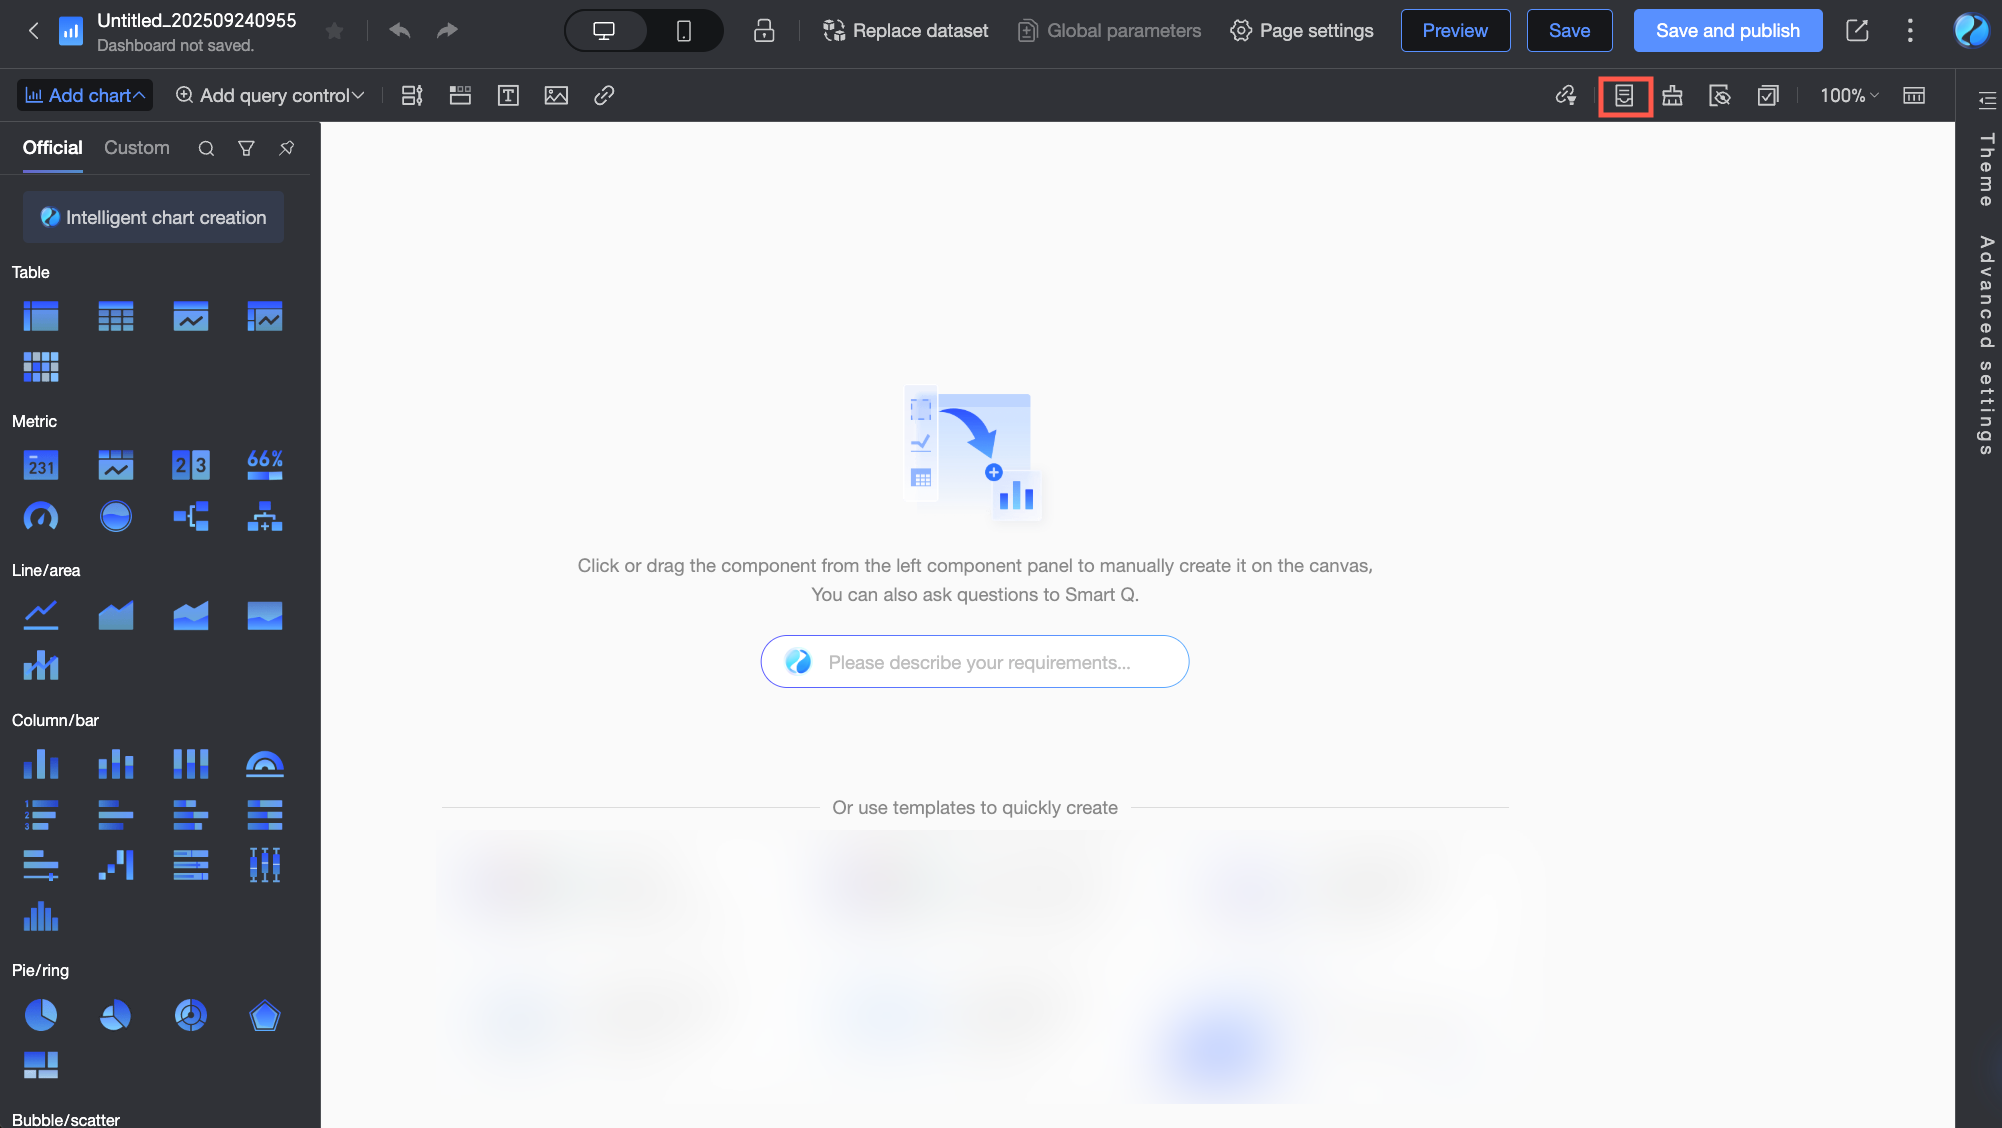
Accessing the feature
On the toolbar at the top of the dashboard editor page, find and click the Reuse component resources icon.
-
Select Source
In the Select Components to Copy window, select the dashboard components that you want to copy. You can quickly locate the dashboard by entering keywords in the search box.

-
Search and locate: If you know the name of the source dashboard, enter keywords in the search box at the top to quickly find it.
-
Select a source tab:
-
From current workspace: This tab lists all published dashboards in your workspace. Select the dashboard you want to reuse.
-
From template marketplace: This tab displays templates shared within your enterprise and templates from the Quick BI official template marketplace. Select the template dashboard you want to reference.
-
-
-
Select components
After you click the source dashboard, the window displays all reusable components in that dashboard. Select one or more components that you want to reuse.
-
Create a copy
After you select the target component, click the Copy to Dashboard button in the bottom-right corner of the window.
-
Reuse Completed
The selected components are copied to the canvas of the dashboard you are editing. You can then drag the components to adjust their position and size.
FAQ
-
Why can't I find the dashboard I want to reuse in the "From current workspace" list?
A: Check the following:
-
Is the dashboard published? Only published dashboards are visible.
-
Do you have permission to access the dashboard? Special permission settings might affect visibility, even within the same workspace.
-
Did you select the wrong tab? Make sure you are searching on the From current workspace tab, not the From template marketplace tab.
-
-
What types of components can I reuse? Which types are not supported?
A: You can reuse most controls, such as Tab, rich text, and images; standard charts; and custom components. Some special components or containers, such as storylines or the overall logic of query controls, might not support direct reuse. The interface shows only the components that you can reuse.
-
Are the data source and configuration copied when a component is reused?
A: The component's style and configuration, such as chart type, selected dimension and measure fields, and calculation logic, are usually copied. However, note the following:
-
Data source dependency: A reused component depends on the datasets associated with the current dashboard. If the current dashboard does not contain the dataset or fields that the component requires, the component might show an error. You must manually associate or configure the data for the component.
-
Independence: A reused component is an independent copy. It is not linked to the original component. Changes to the original component do not affect the reused copy, and vice versa.
-
-
Can I copy components from multiple different dashboards at once?
A: No. Each time you open the reuse window, you can select components from only one source dashboard. To reuse components from multiple sources, you must repeat the process: open the reuse window, select a source, pick components, and copy.
-
Will reusing components affect my dashboard's performance?
A: Reusing components does not directly cause performance issues. The performance impact is similar to that of manually creating the same number of components with the same complexity. Dashboard performance primarily depends on the total number of components, data volume, and computational complexity.