Ask data questions
Intelligent Data Assistant Q lets you ask data questions in natural language and get instant analysis results, powered by ChatBI. On PC or mobile, you can preview and select datasets, ask questions directly or use quick questions for multi-turn conversations, and review past conversations in the conversation list.
The following sections describe how to use Intelligent Data Assistant Q.
Prerequisites
-
Create a dataset and configure Intelligent Data Assistant Q.
-
Obtain the necessary resource permissions. For more information, see permission management.
PC entry points
-
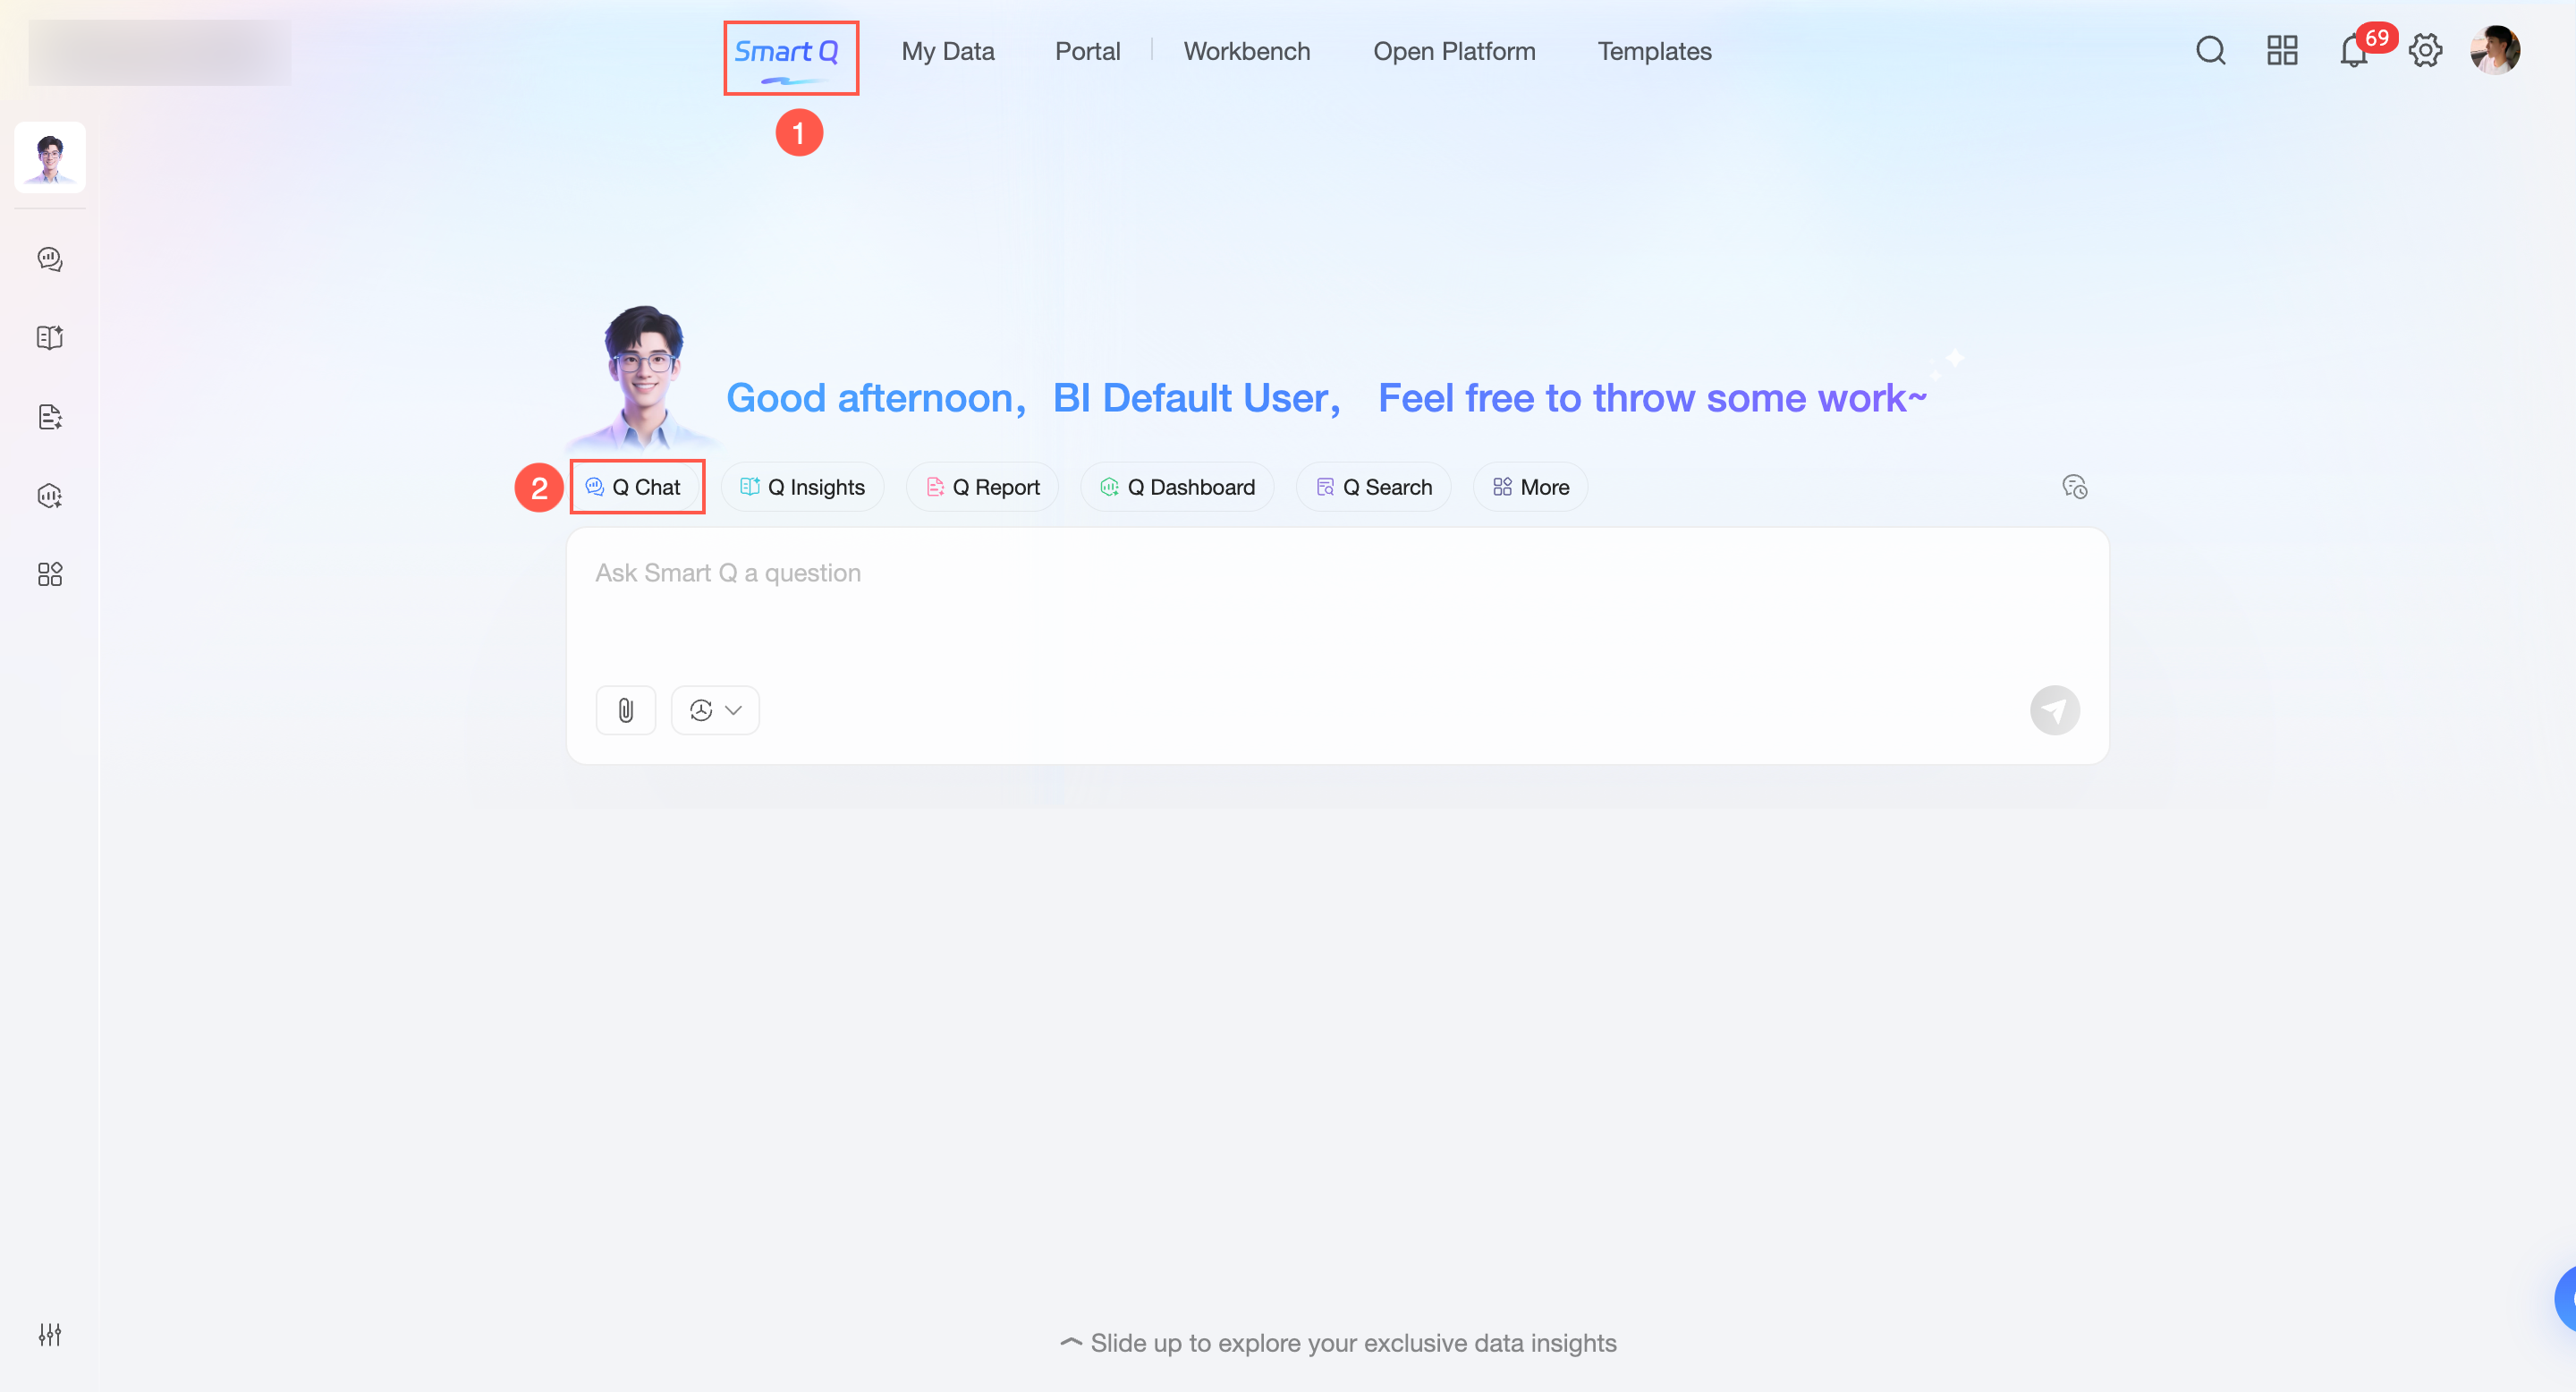
Entry 1: On the Quick BI homepage, click Intelligent Assistant Q, and in the main input field, select Intelligent Data Assistant Q.
-
Entry 2: In the left-side navigation pane of the Intelligent Assistant Q homepage, select Intelligent Data Assistant Q.
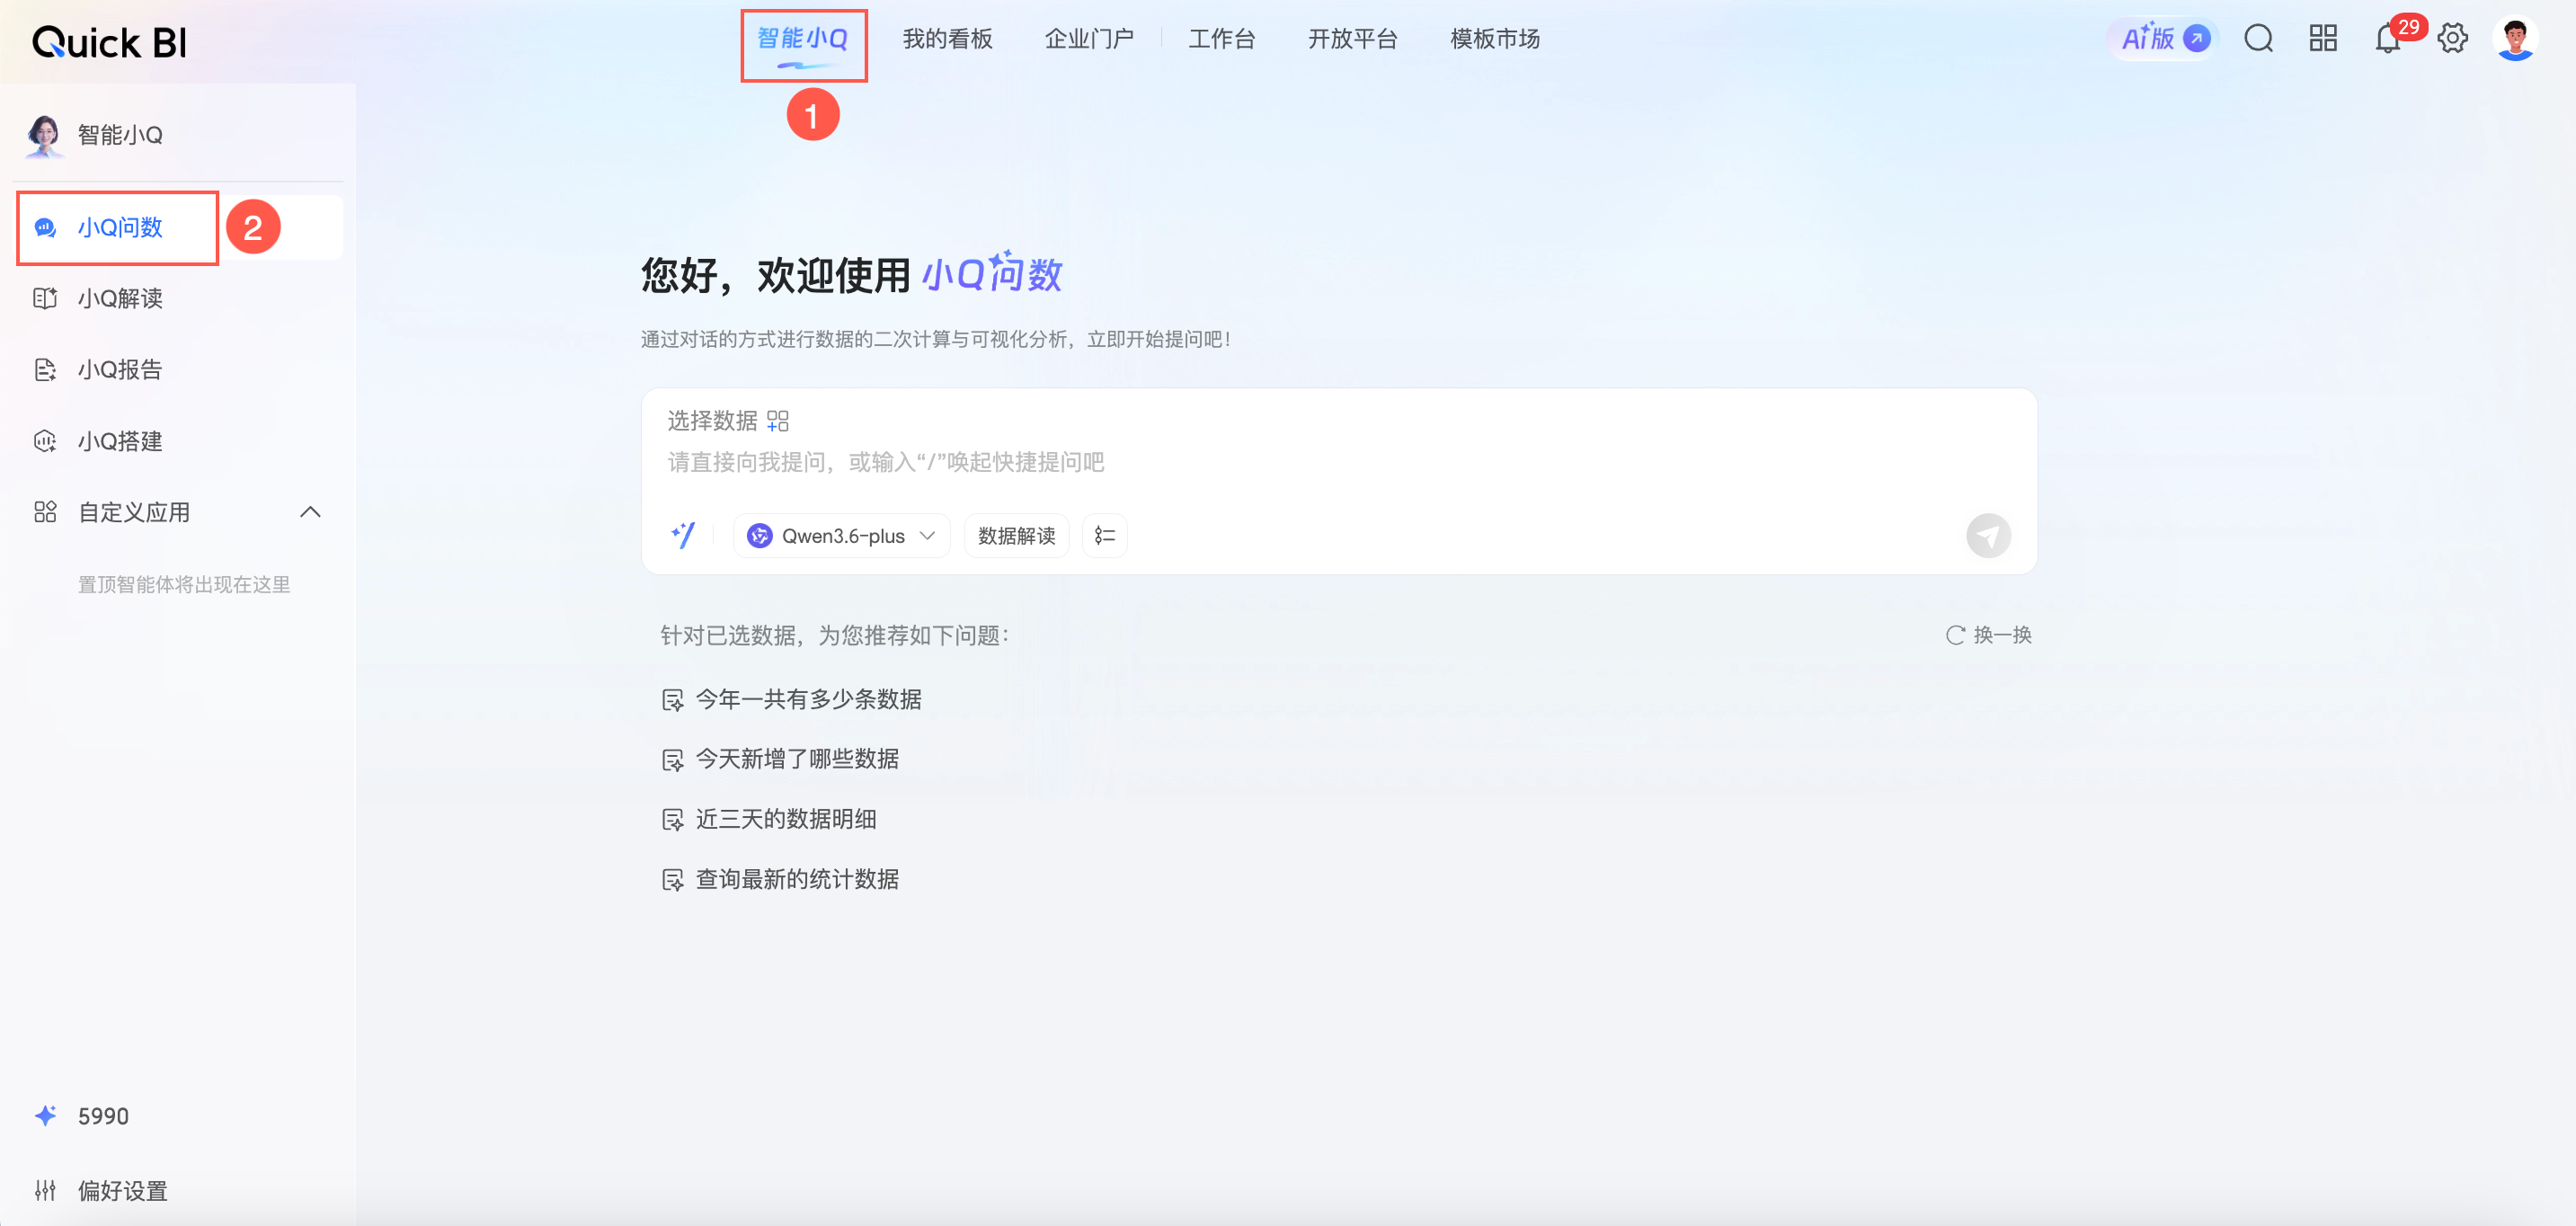
The functionality is nearly identical for both entry points. The following instructions use Entry 2 as an example.
Data sources
Datasets
You can query datasets under the All tab and within each analysis topic for which you have permissions.
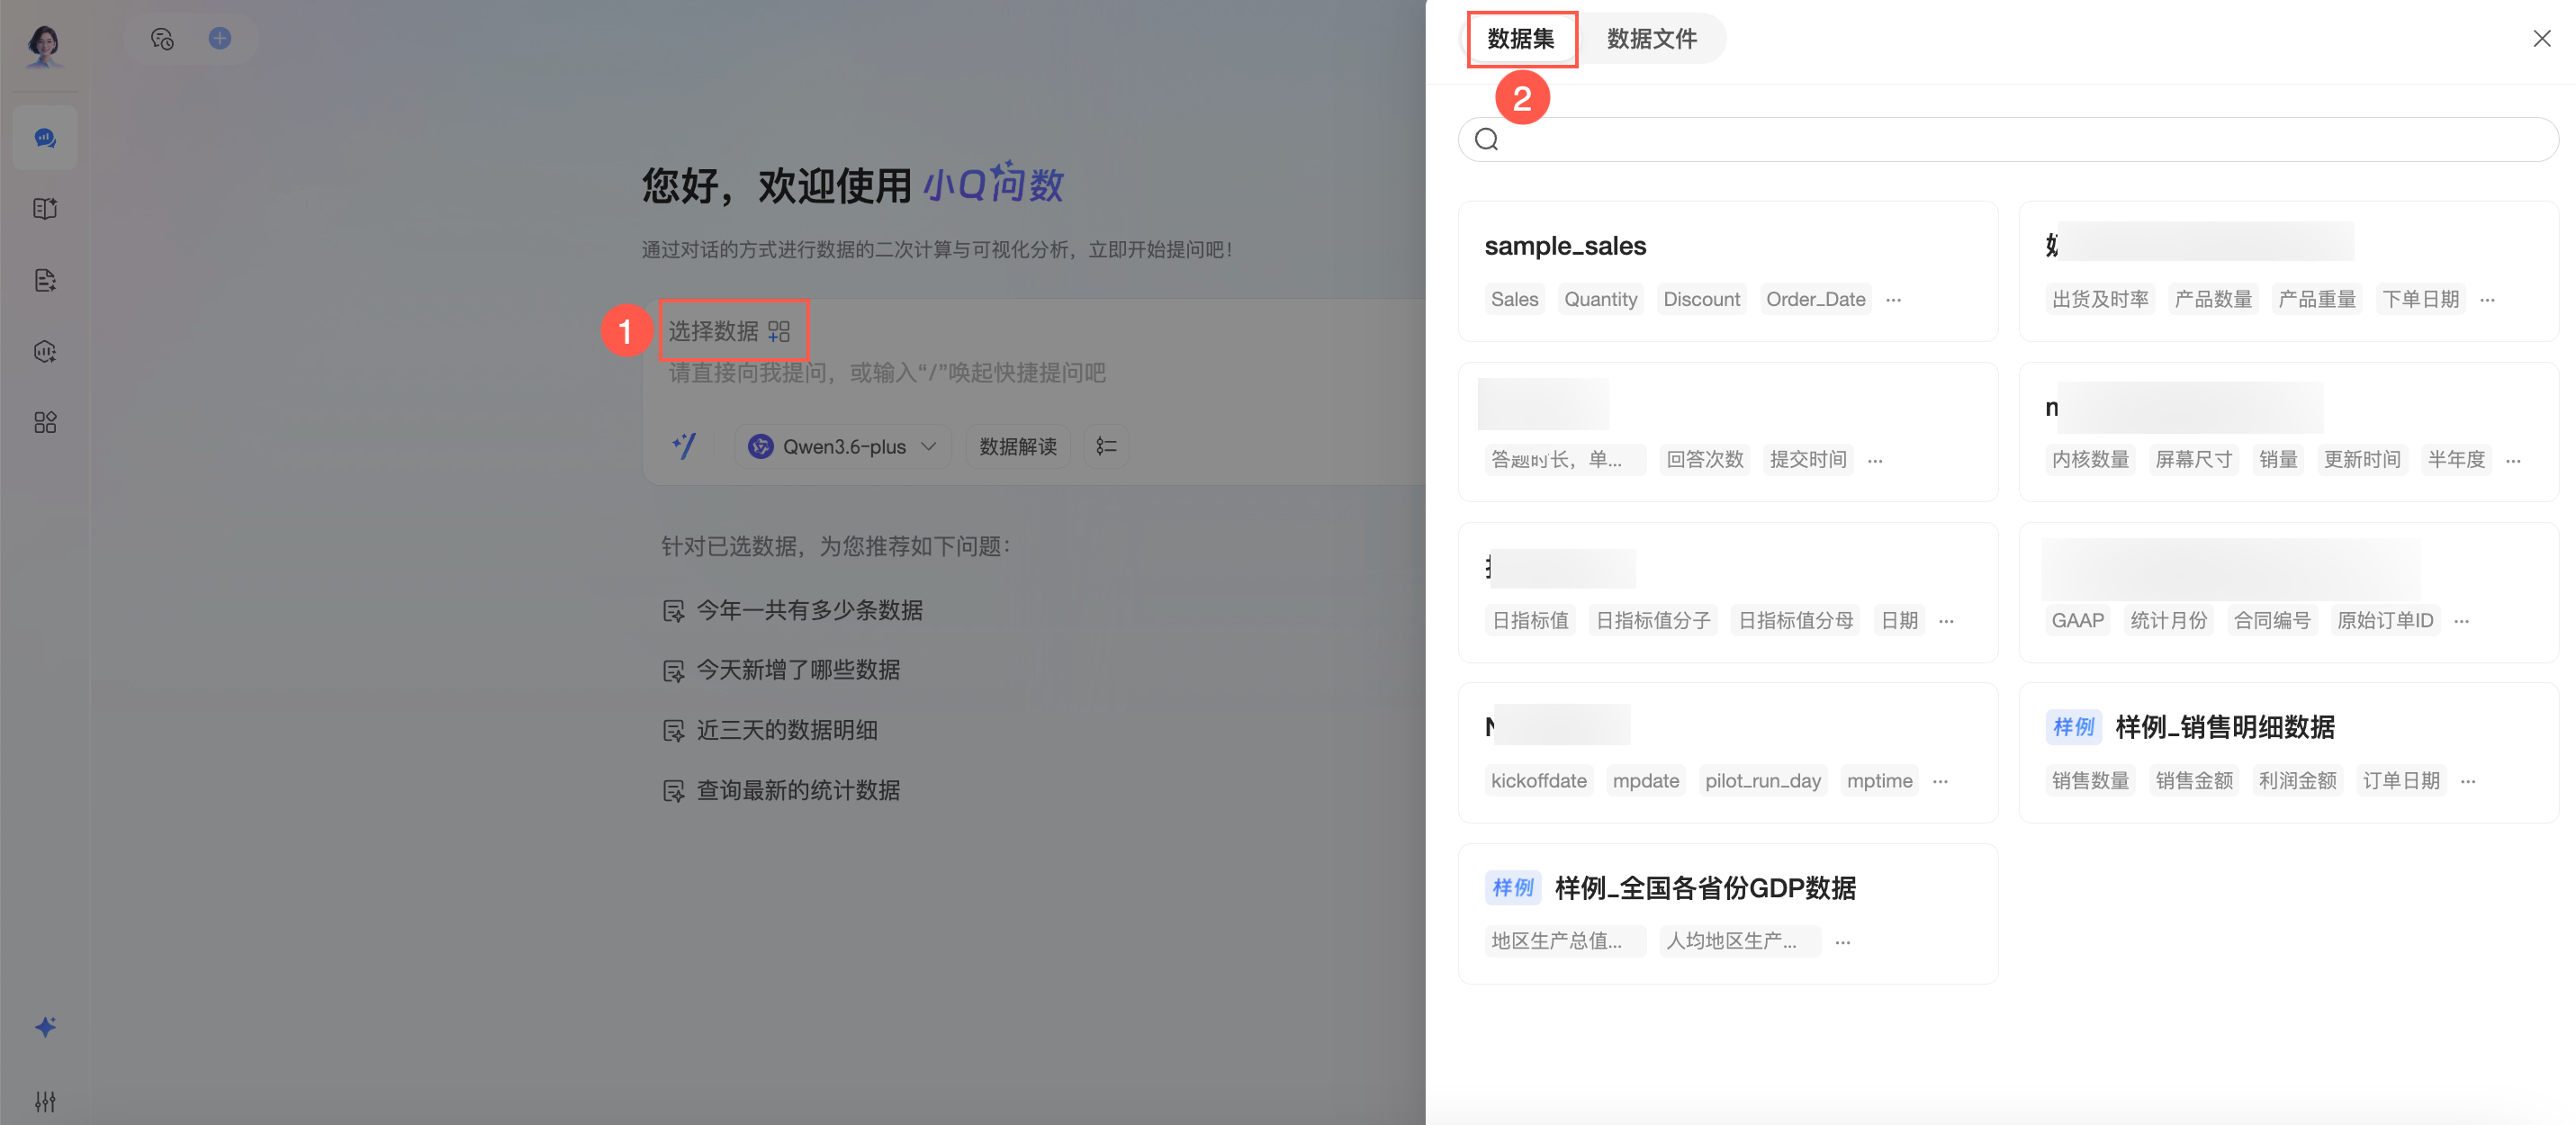
-
To configure dataset permissions for Intelligent Data Assistant Q, see Manage permissions for Intelligent Data Assistant Q.
-
To configure an analysis topic, see Manage analysis topics.
-
Datasets marked with a Sample tag in the upper-left corner are sample datasets.
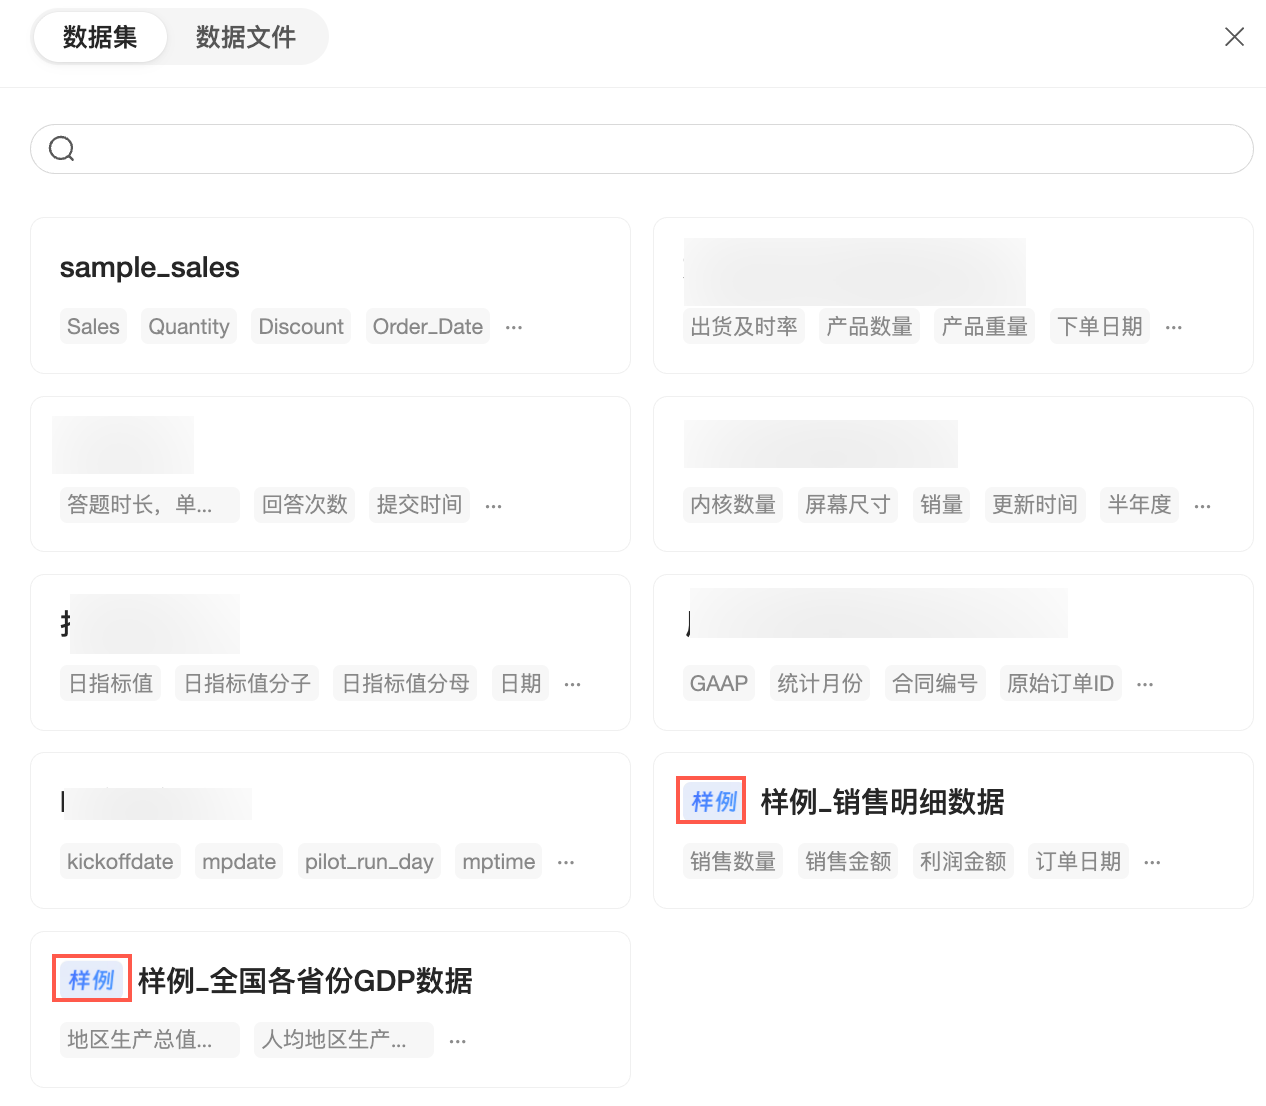
If you do not need sample data, you can hide it. For more information, see Display sample datasets.
Data files
You can upload local data files.
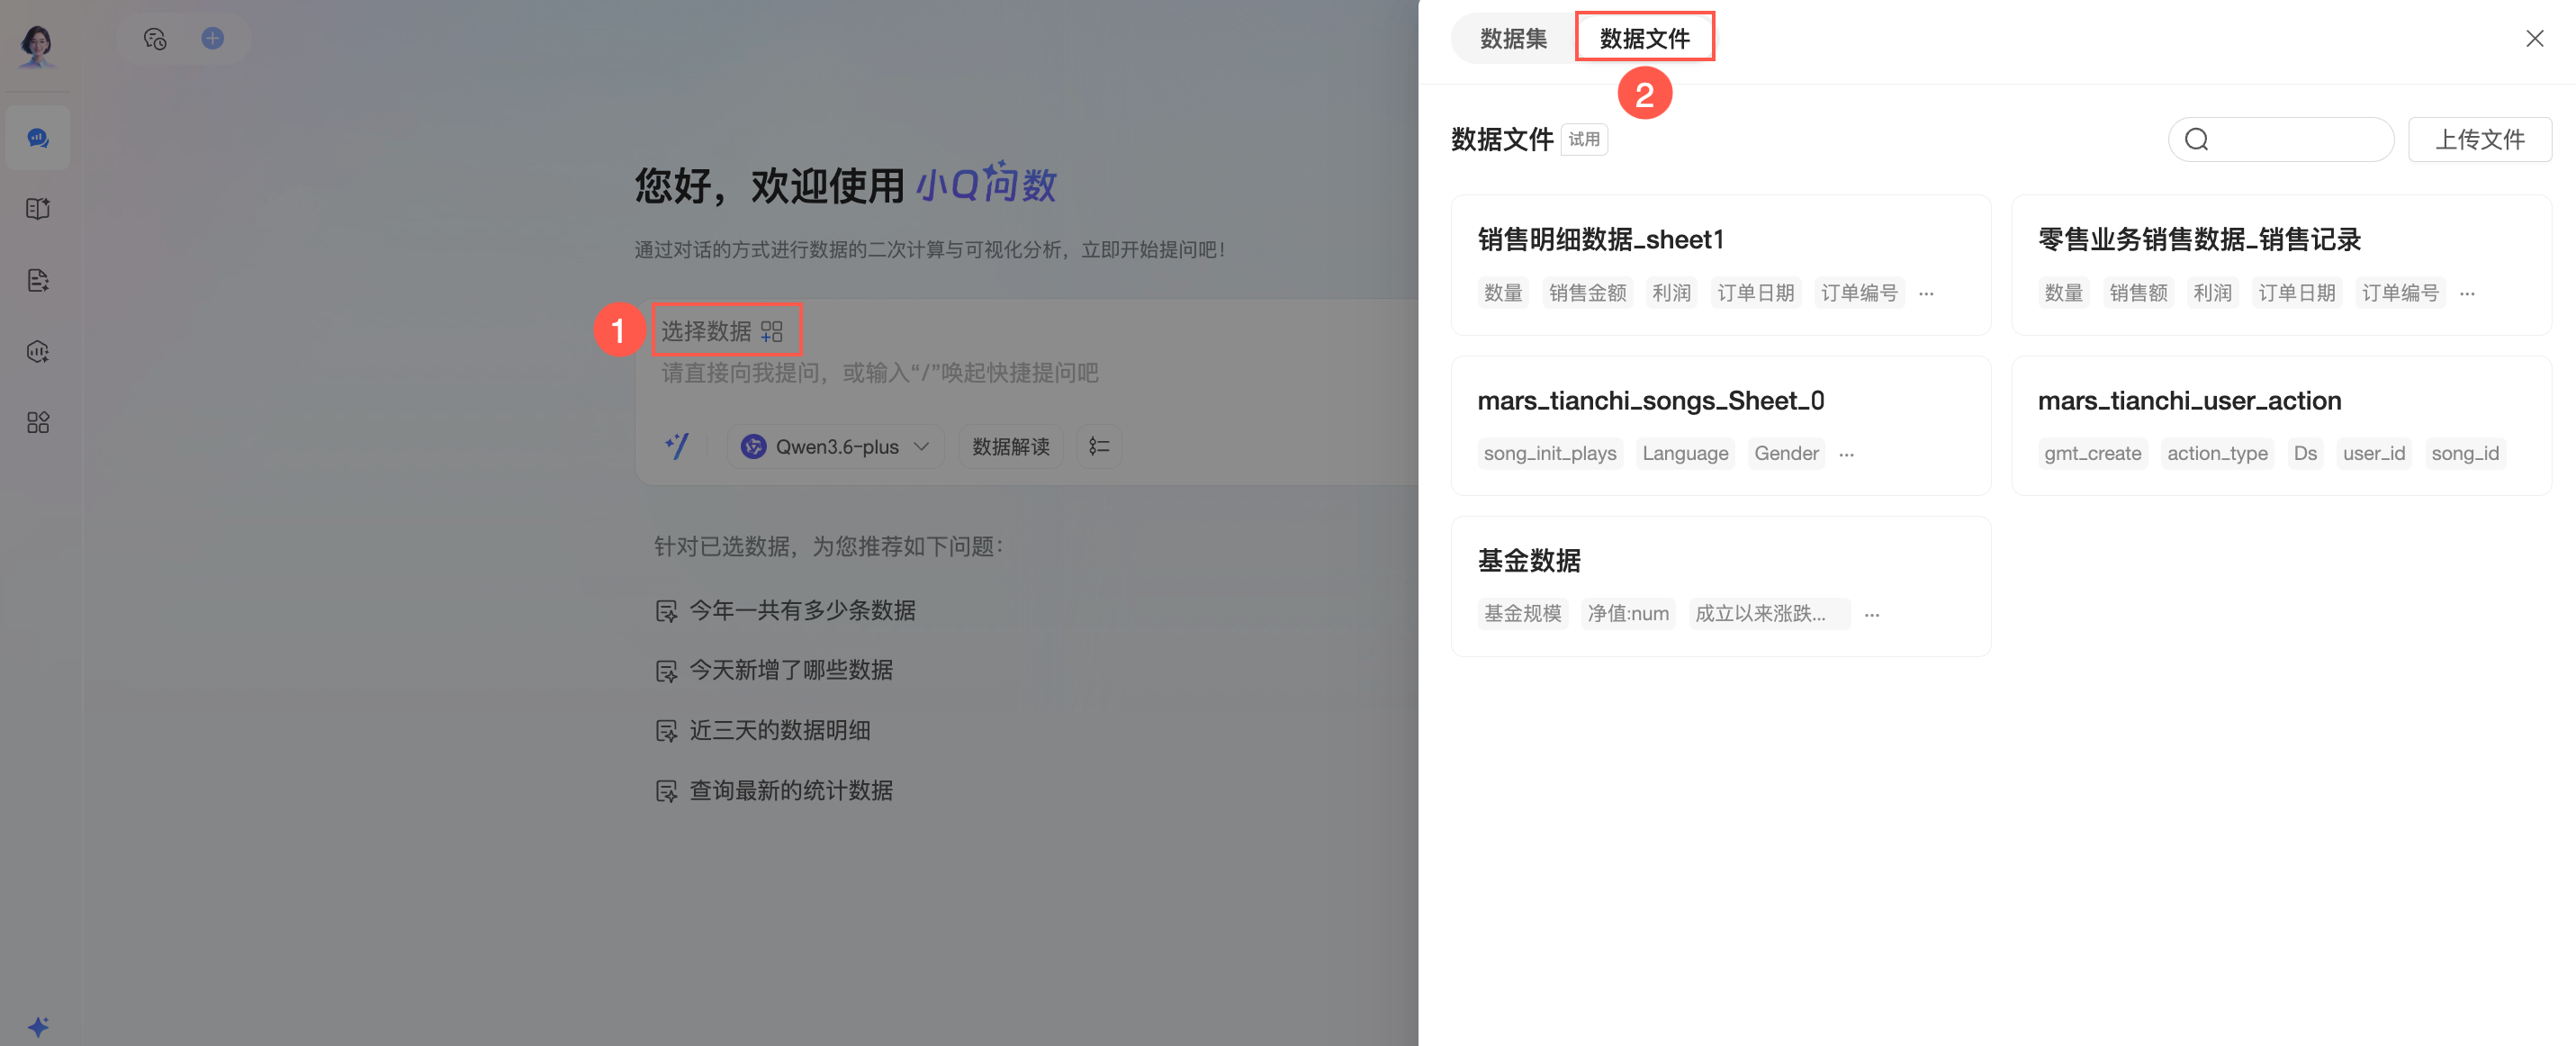
Upload a data file
-
On the Data Files tab, if no files have been uploaded, click Upload File.
If you have already uploaded data files, click the Upload File icon in the upper-right corner to go to the upload page.

-
On the file upload page, drag a file to the upload area, or click the area to select a file.
-
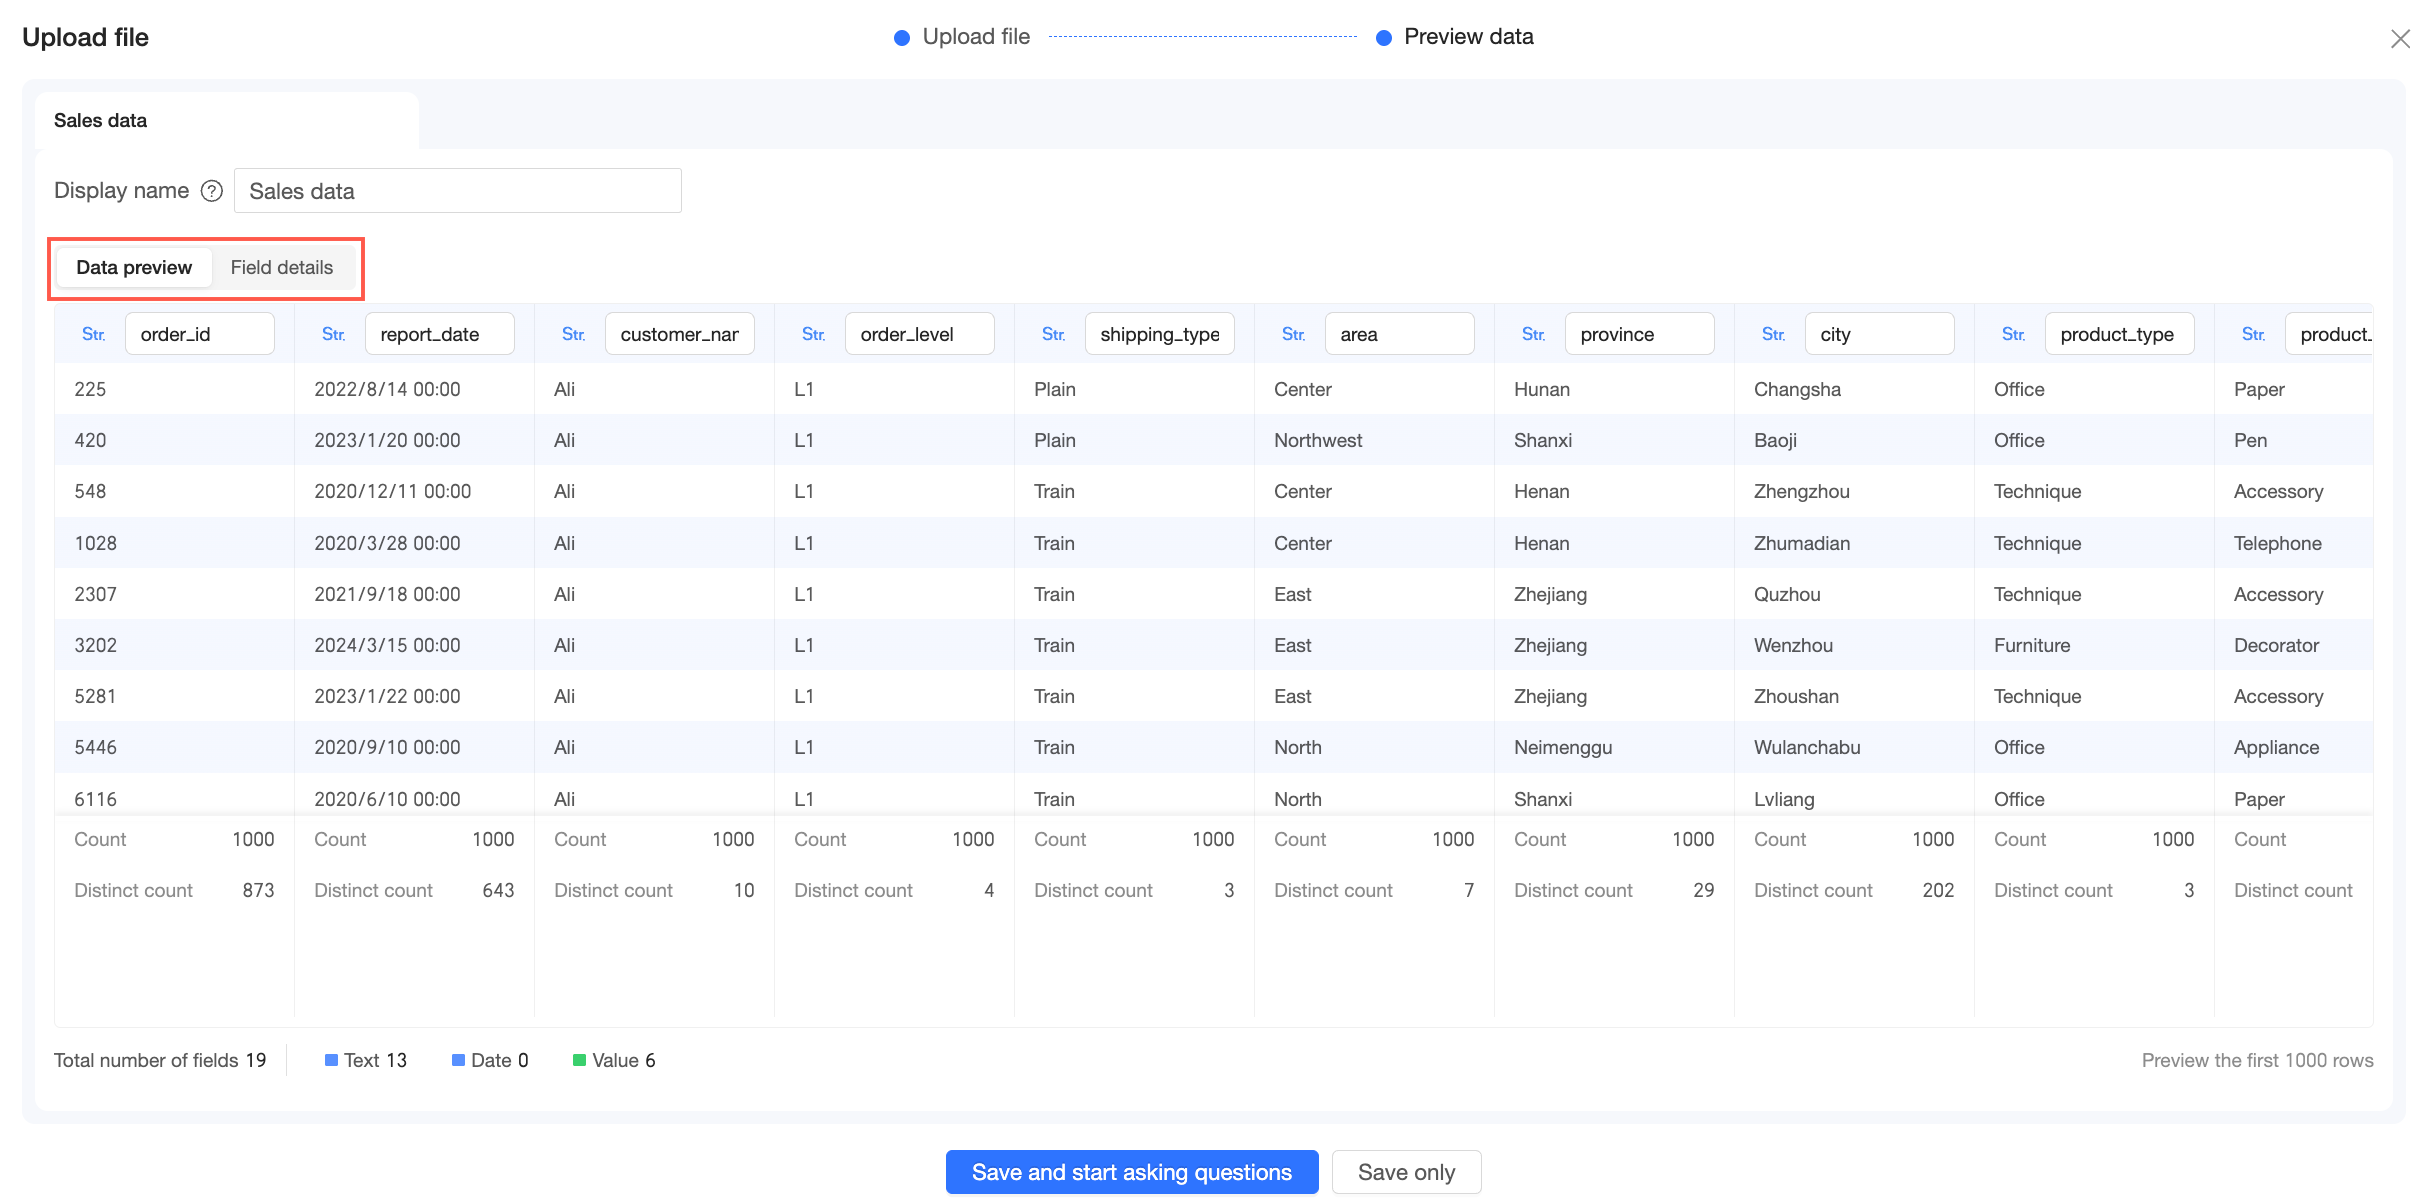
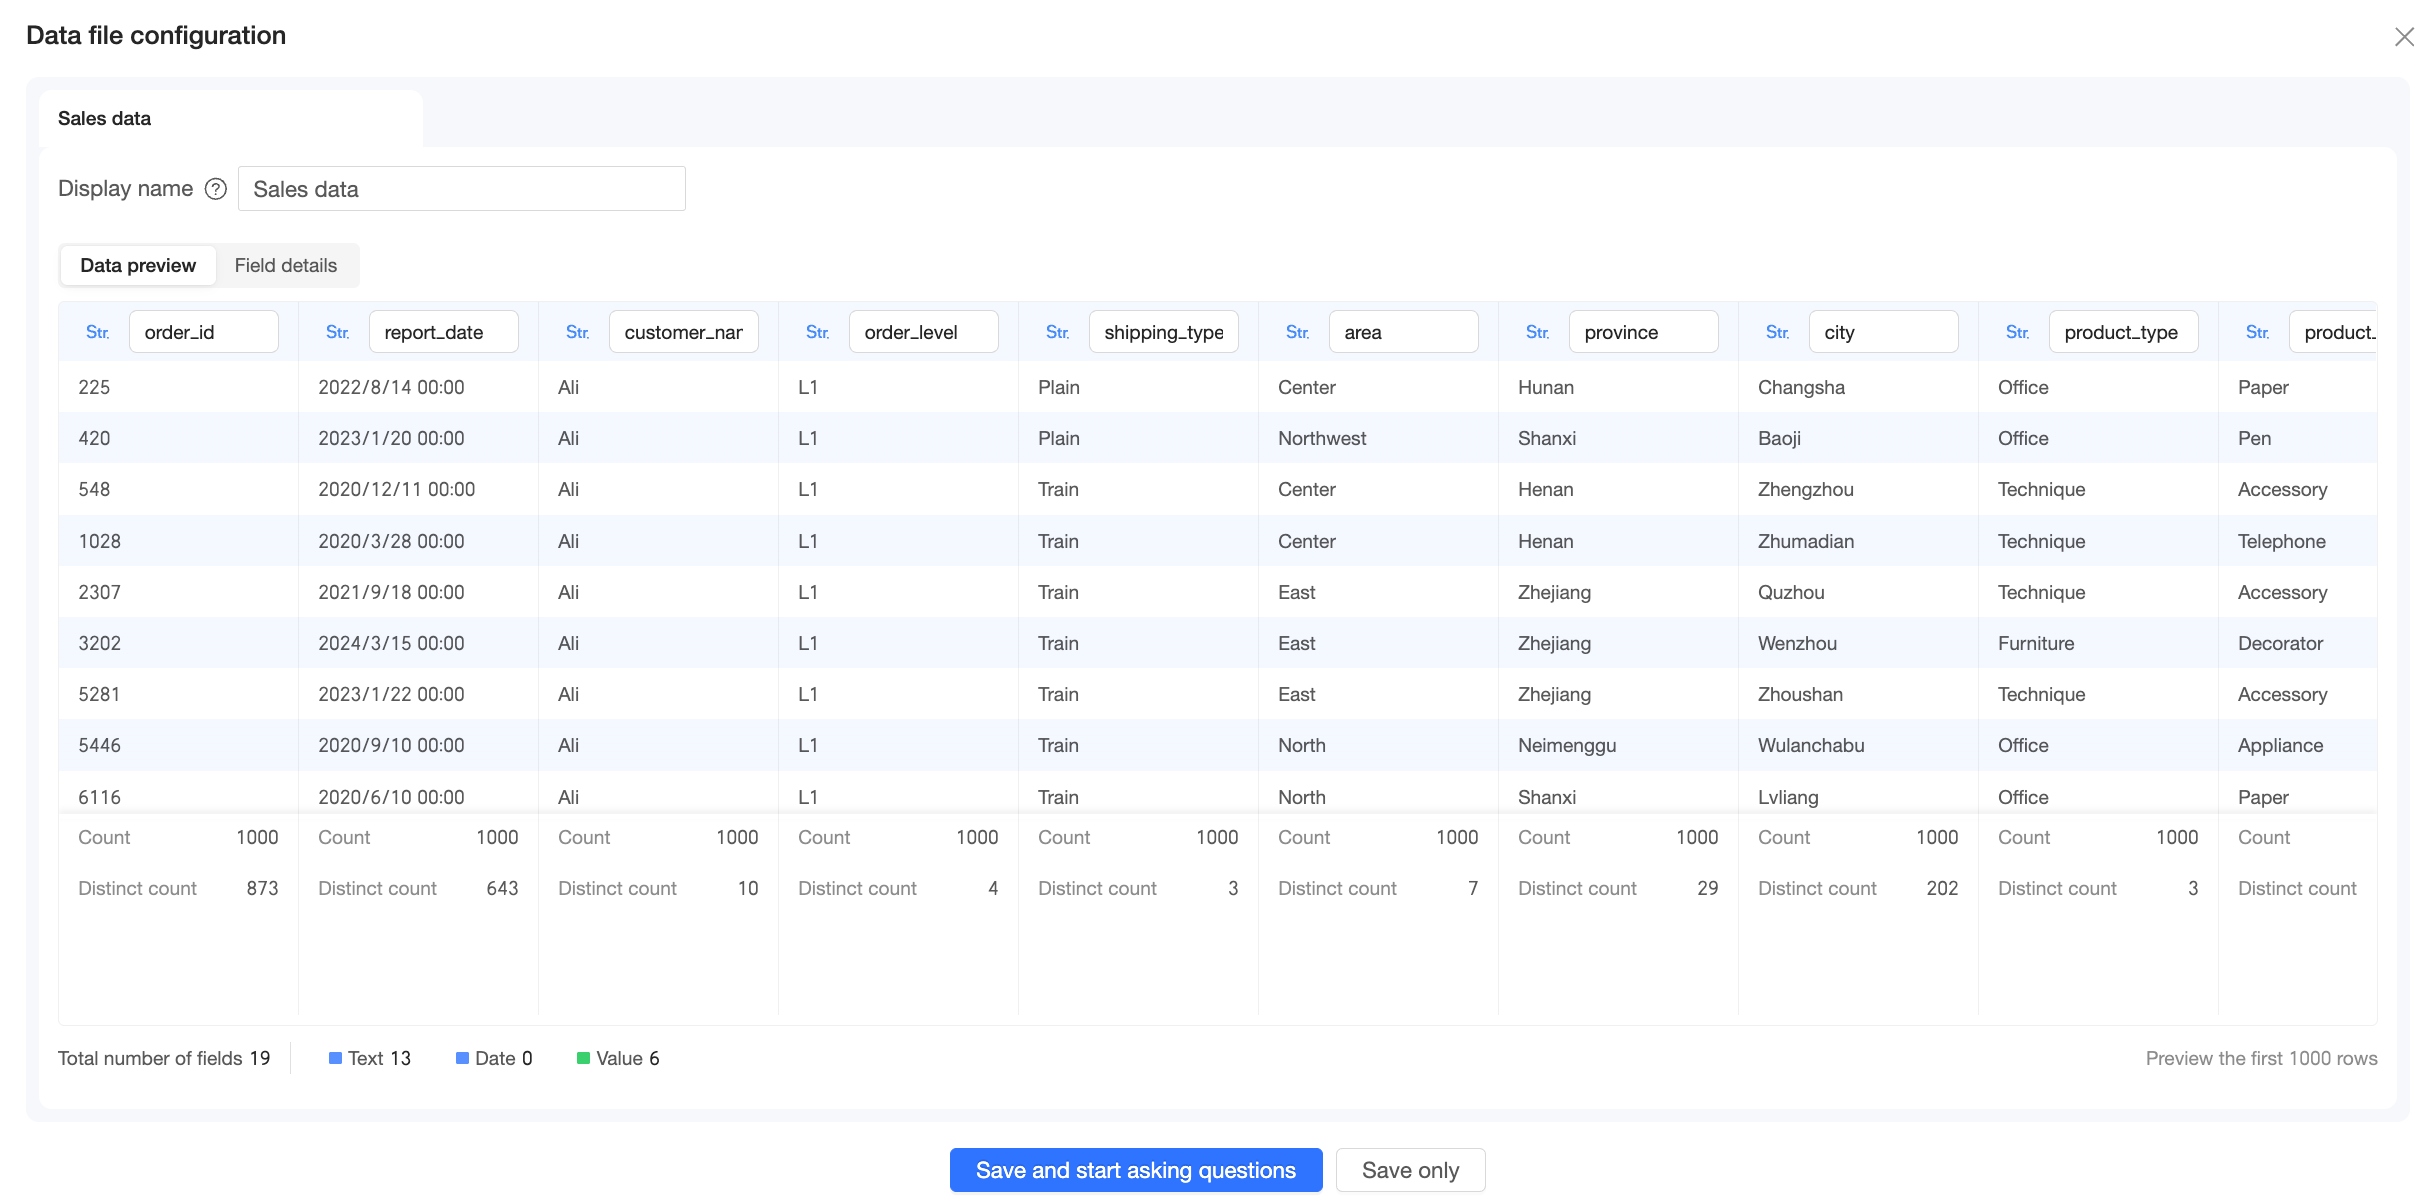
Preview the data.
-
On the data preview page, you can set the display name for the dataset.
NoteEnter a valid name. Do not use special characters or leading/trailing spaces.
-
You can perform a data preview and view field details.
-
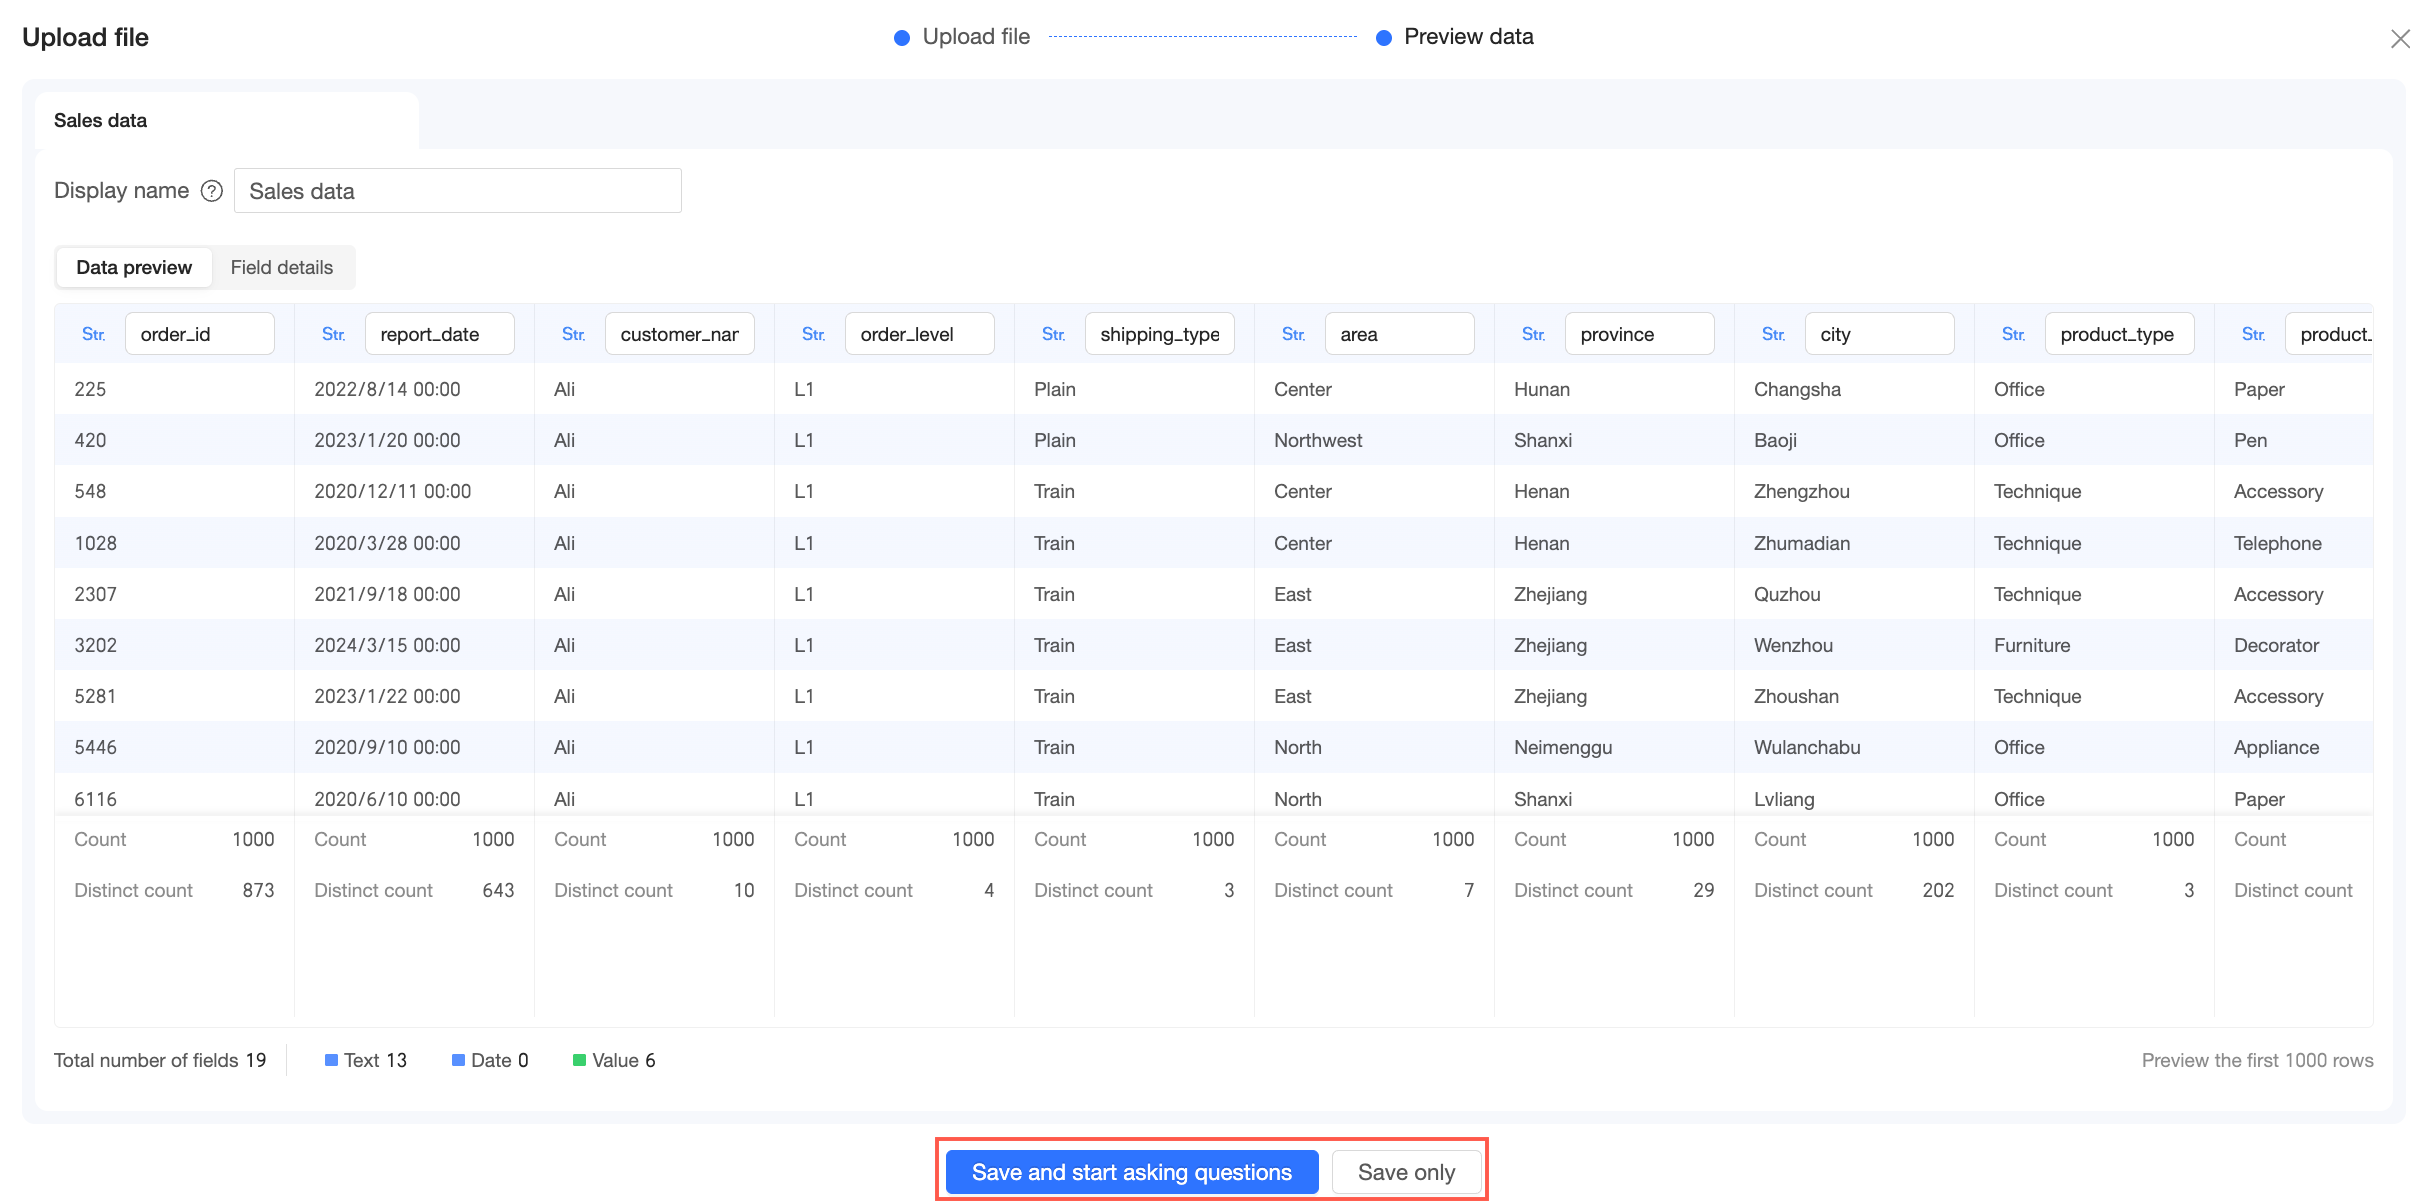
After confirming the data is correct, click Save and Ask or Save Only.
-
Save and Ask: Saves the file as a dataset and opens it for querying.
-
Save Only: Saves the file as a dataset without opening it for querying.
-
-
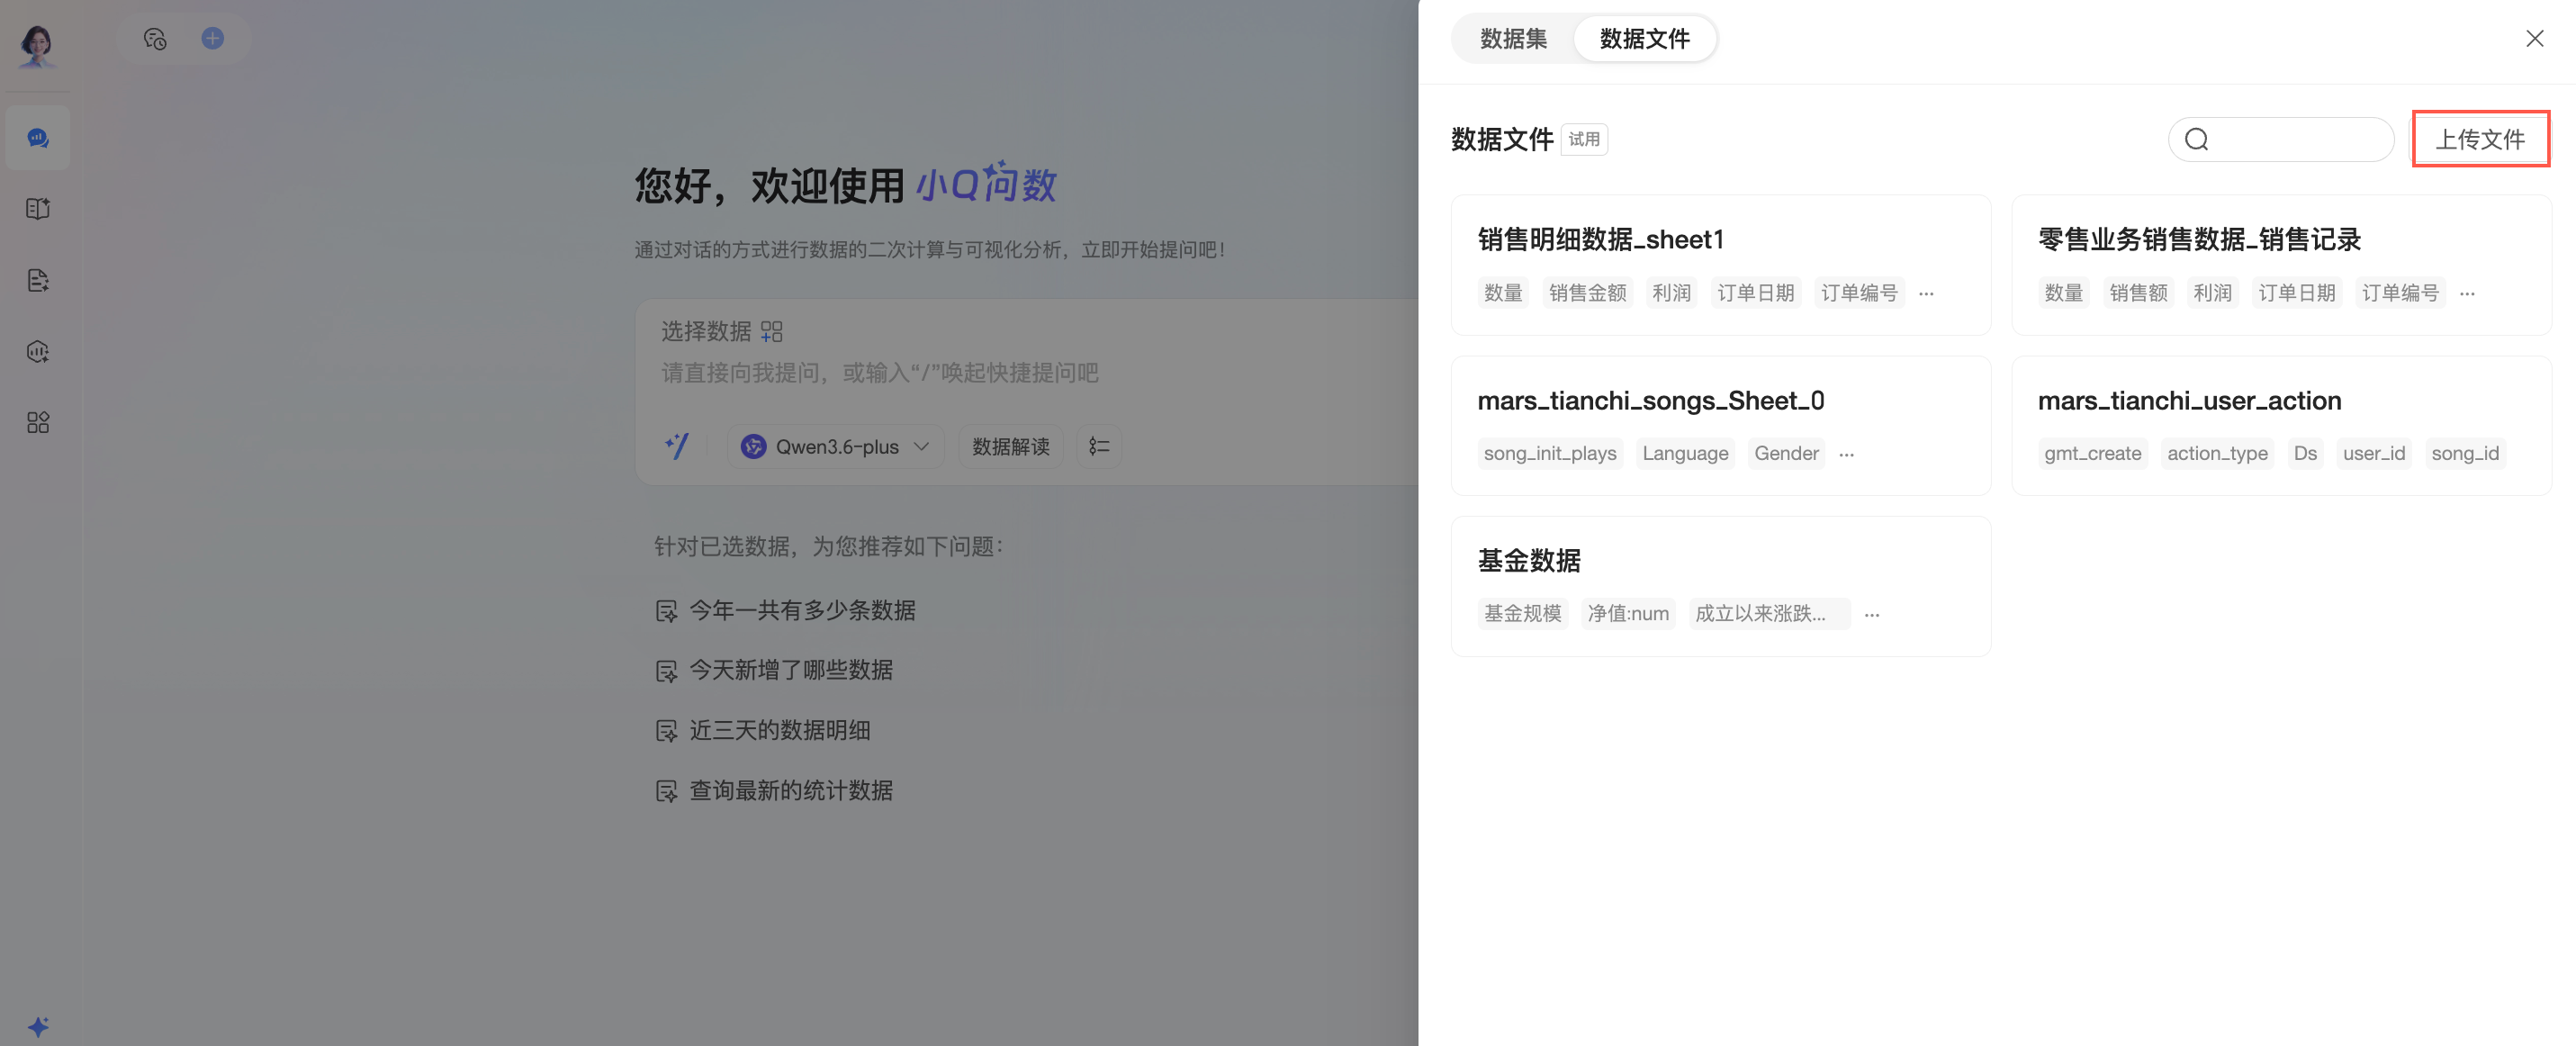
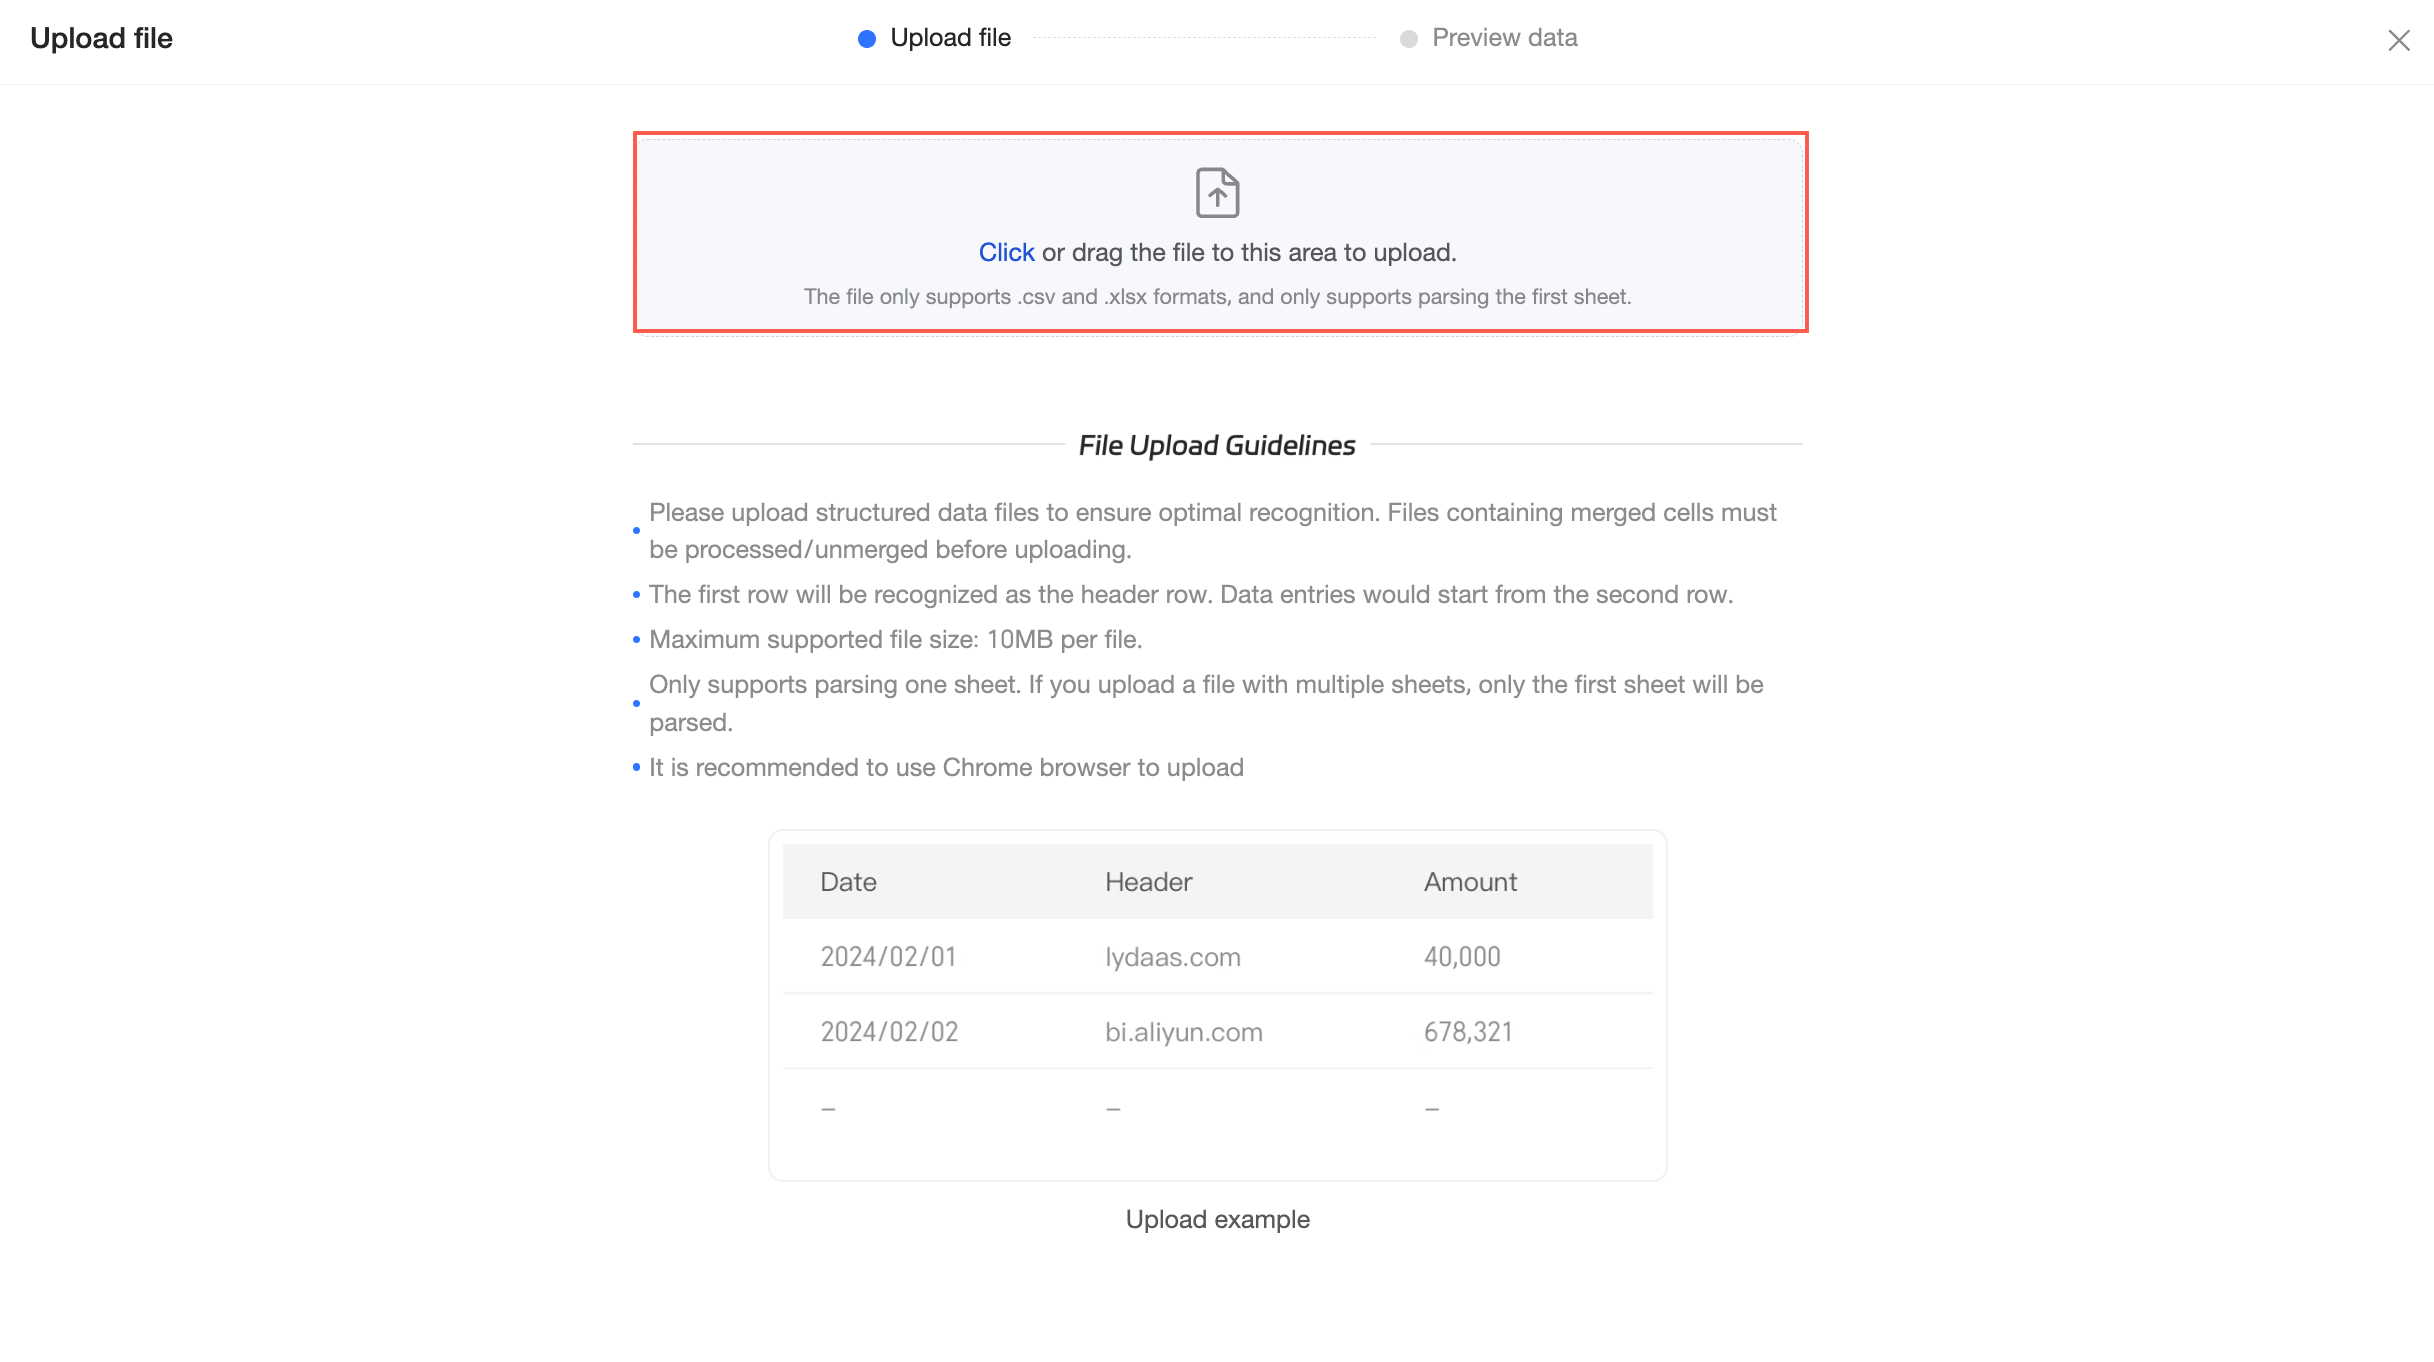
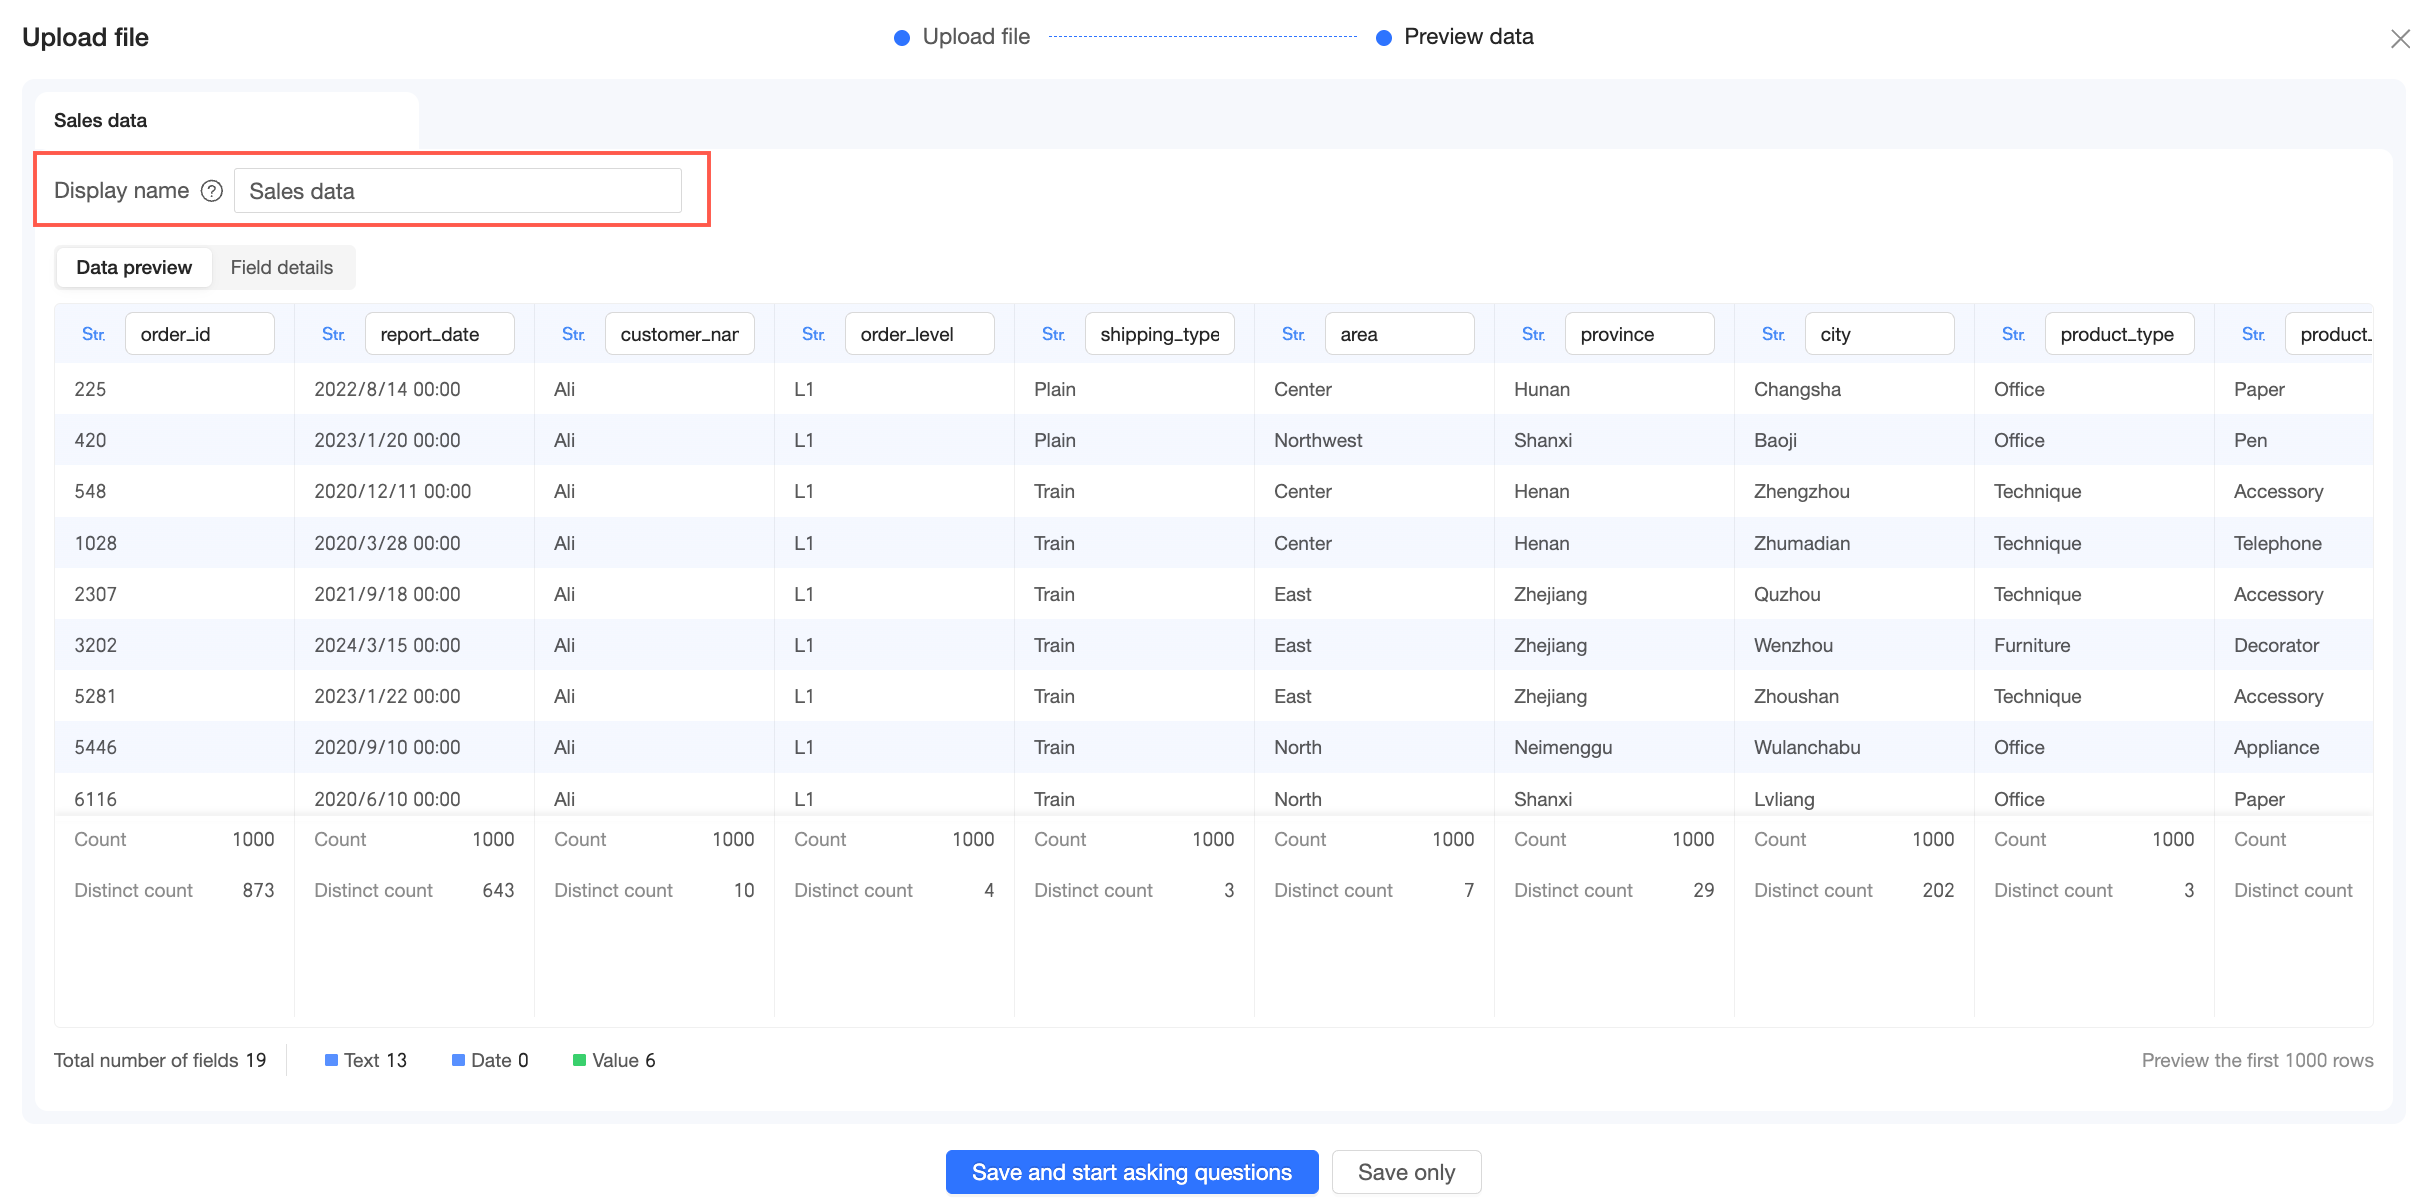
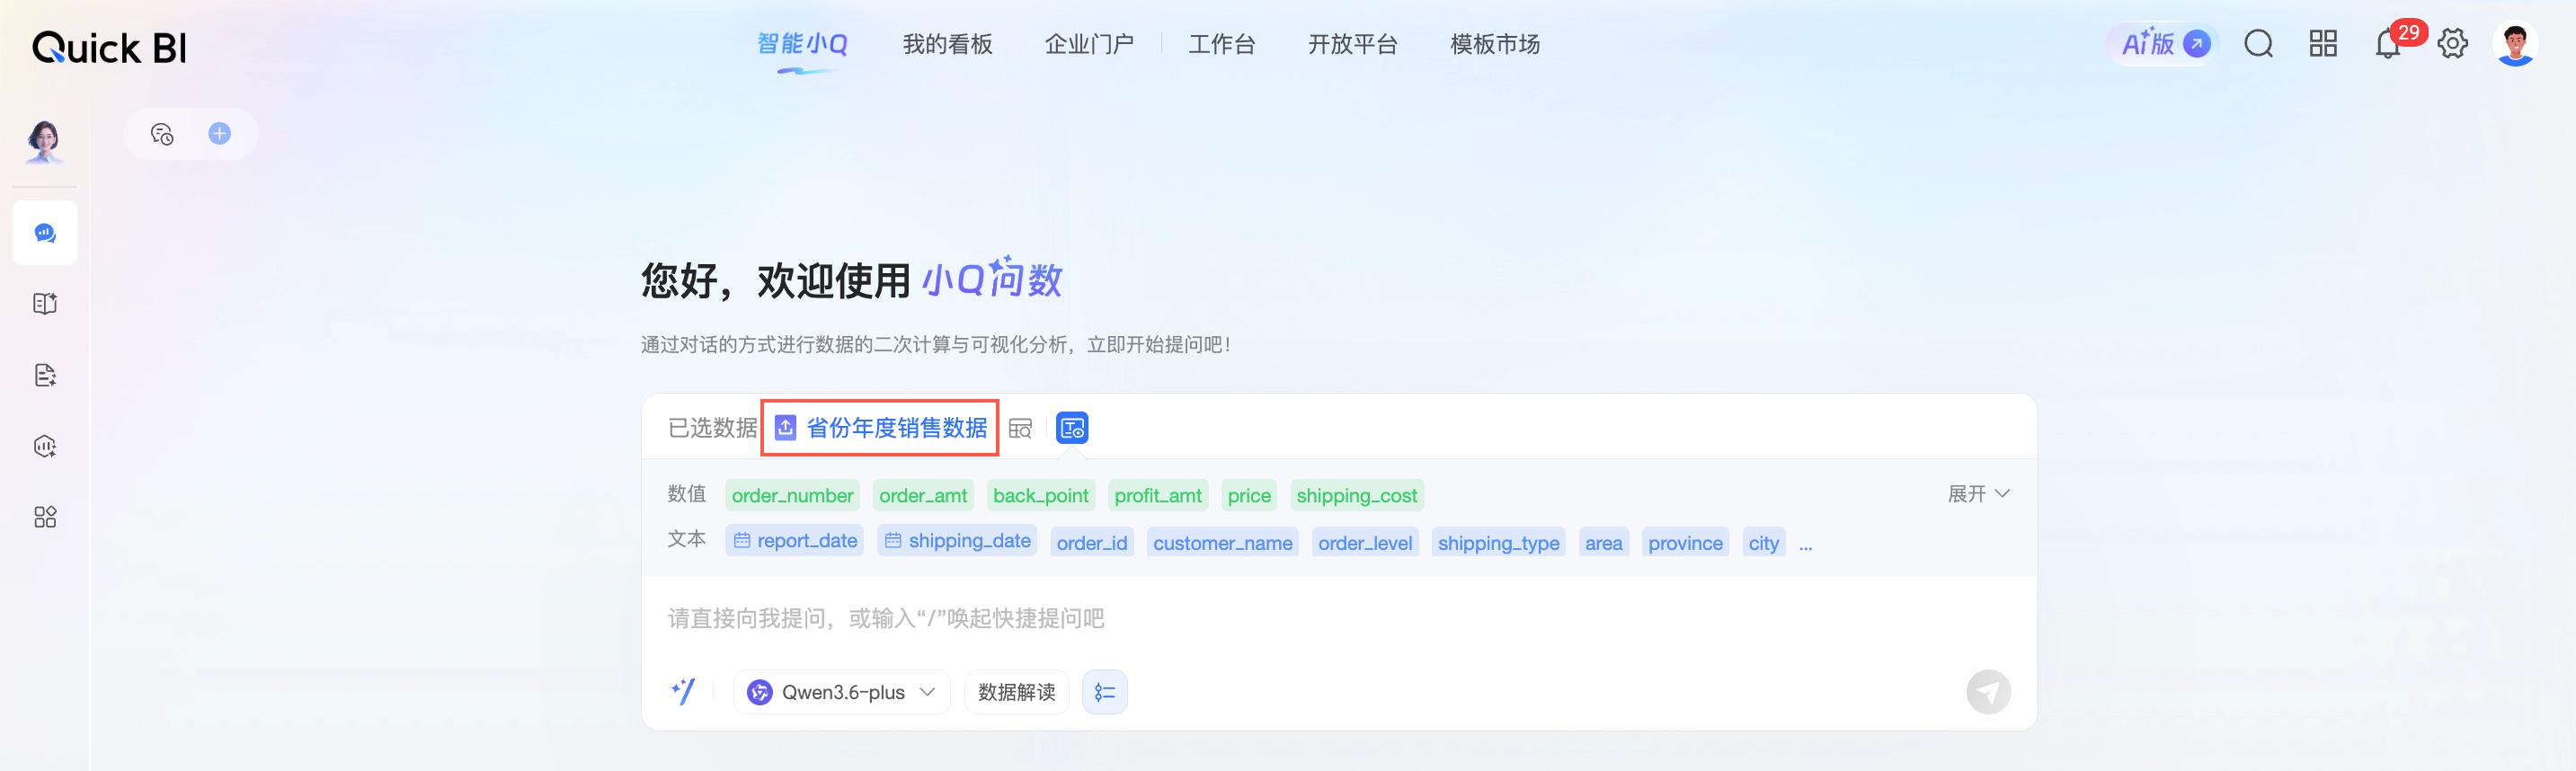
Once the file is uploaded, you can select it to ask questions.
Manage data files
-
Configure
-
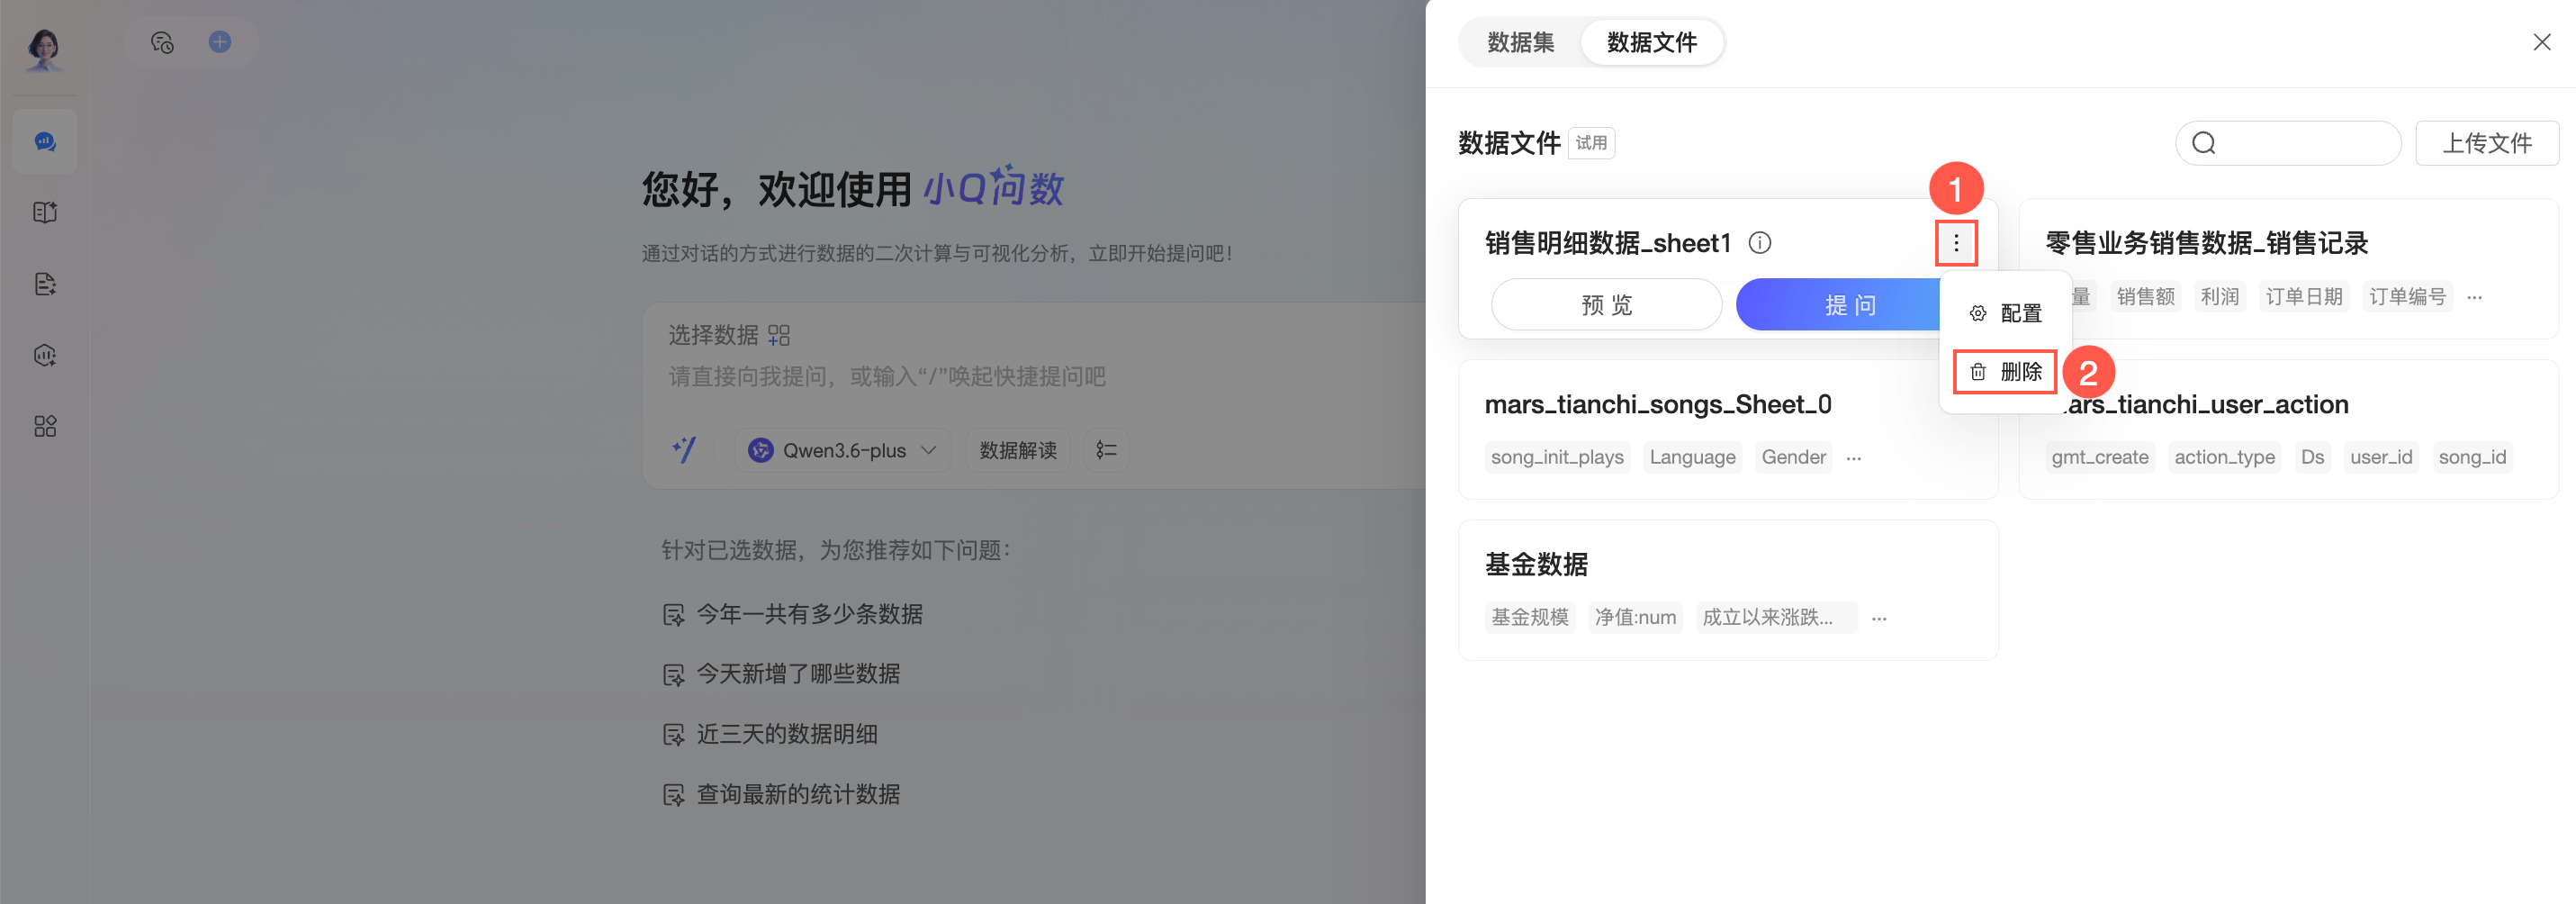
Hover over a data file, click the
icon, and select Configure. -
On the configuration page, you can modify the display name, use data preview, and view field details.
-
-
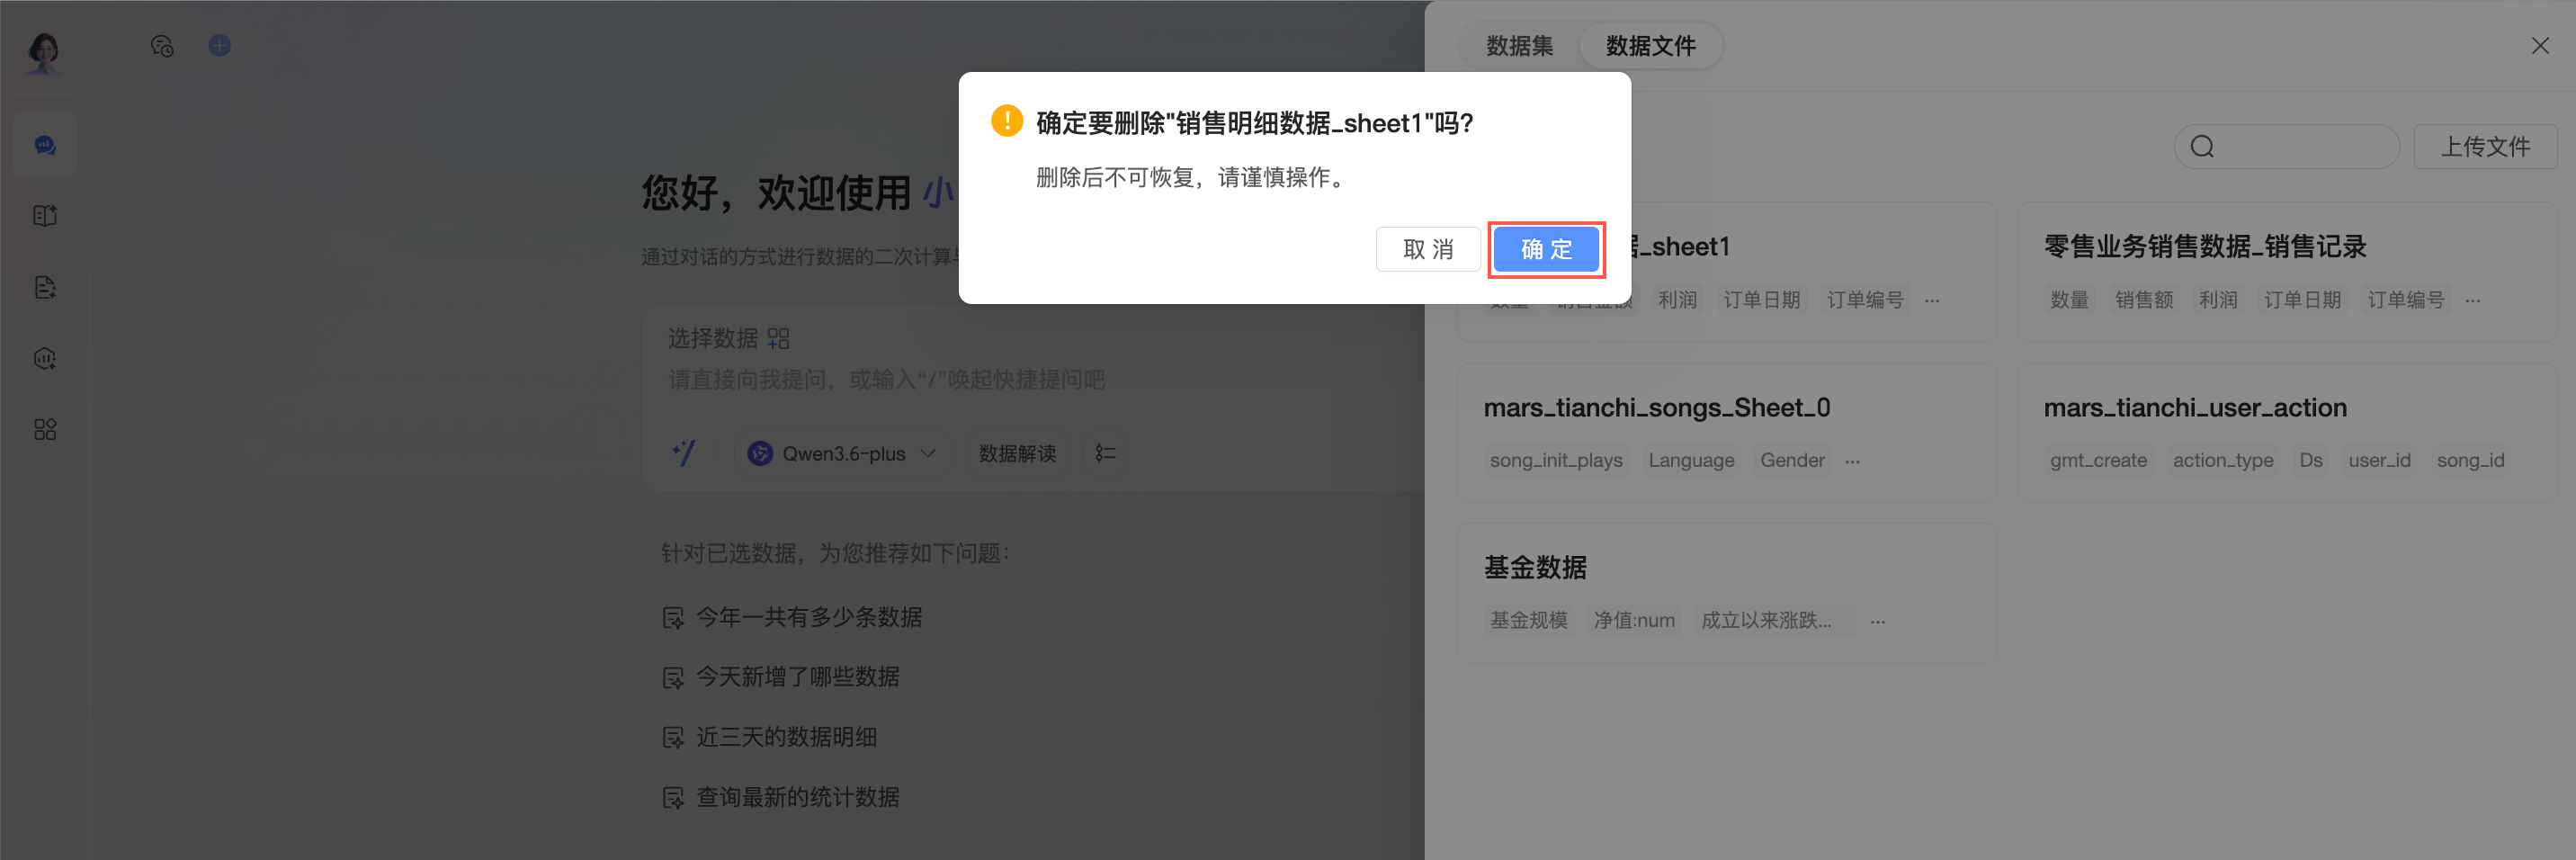
Delete
-
Hover over a data file, click the
icon, and select Delete. -
In the confirmation dialog, click OK to delete the data file.
-
 icon, and select Configure.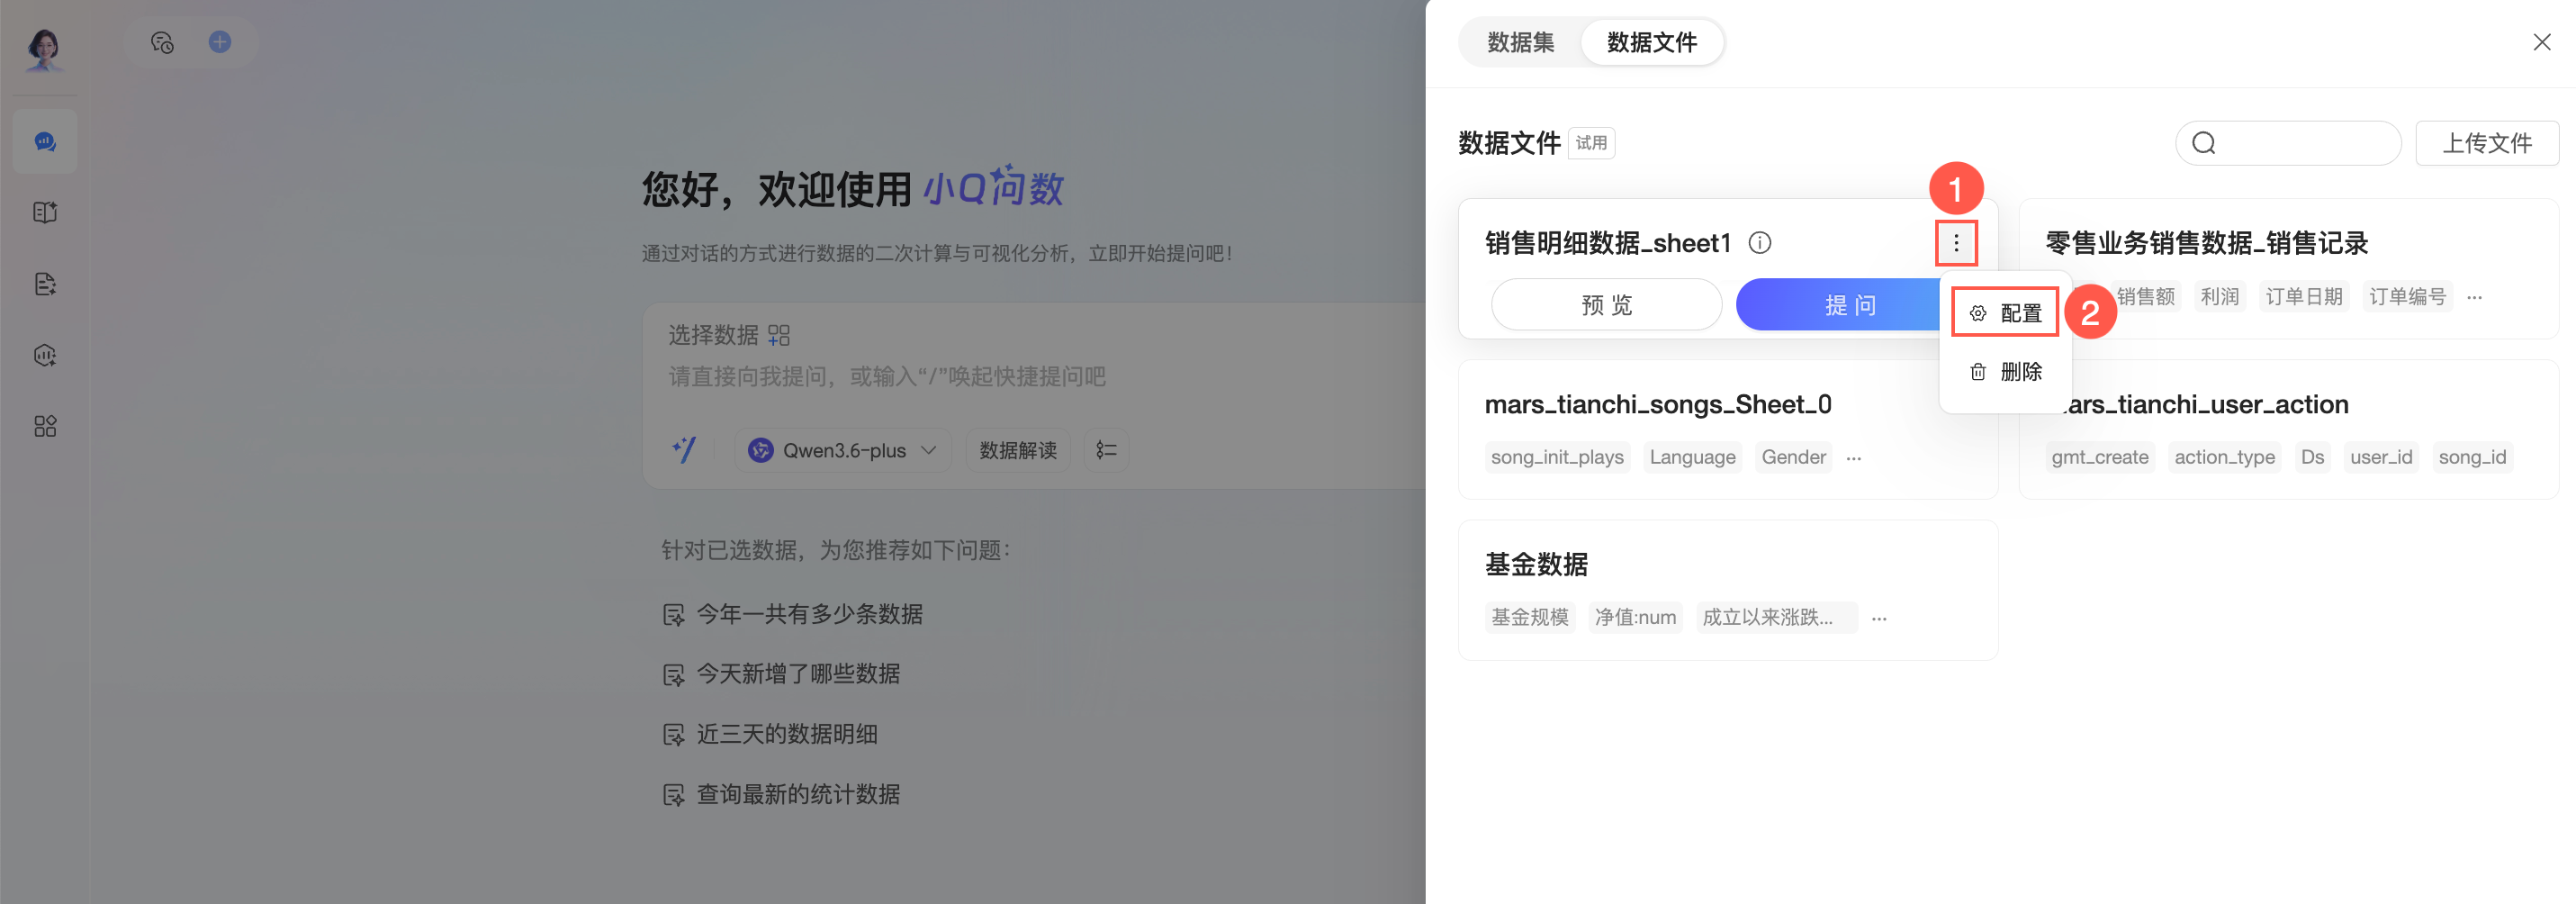
Preview and select datasets
Select a single dataset
-
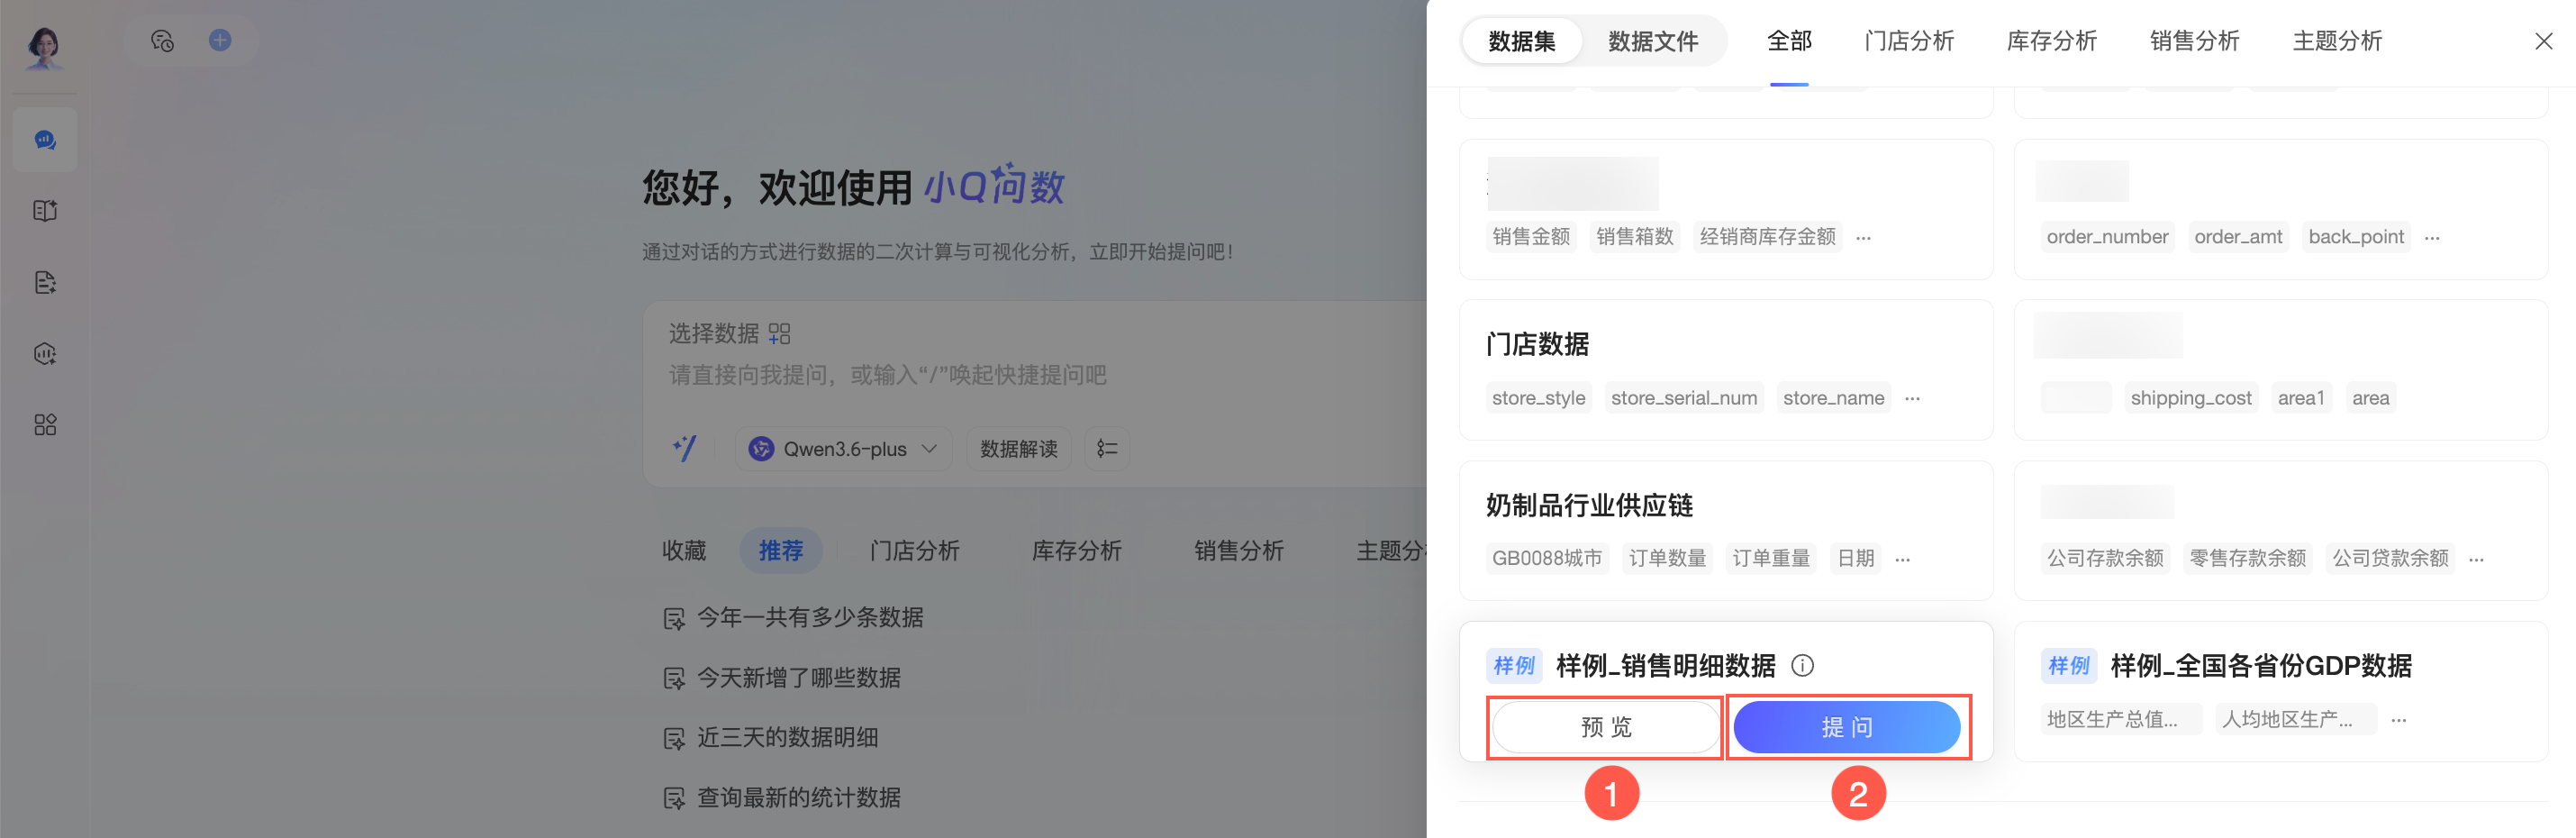
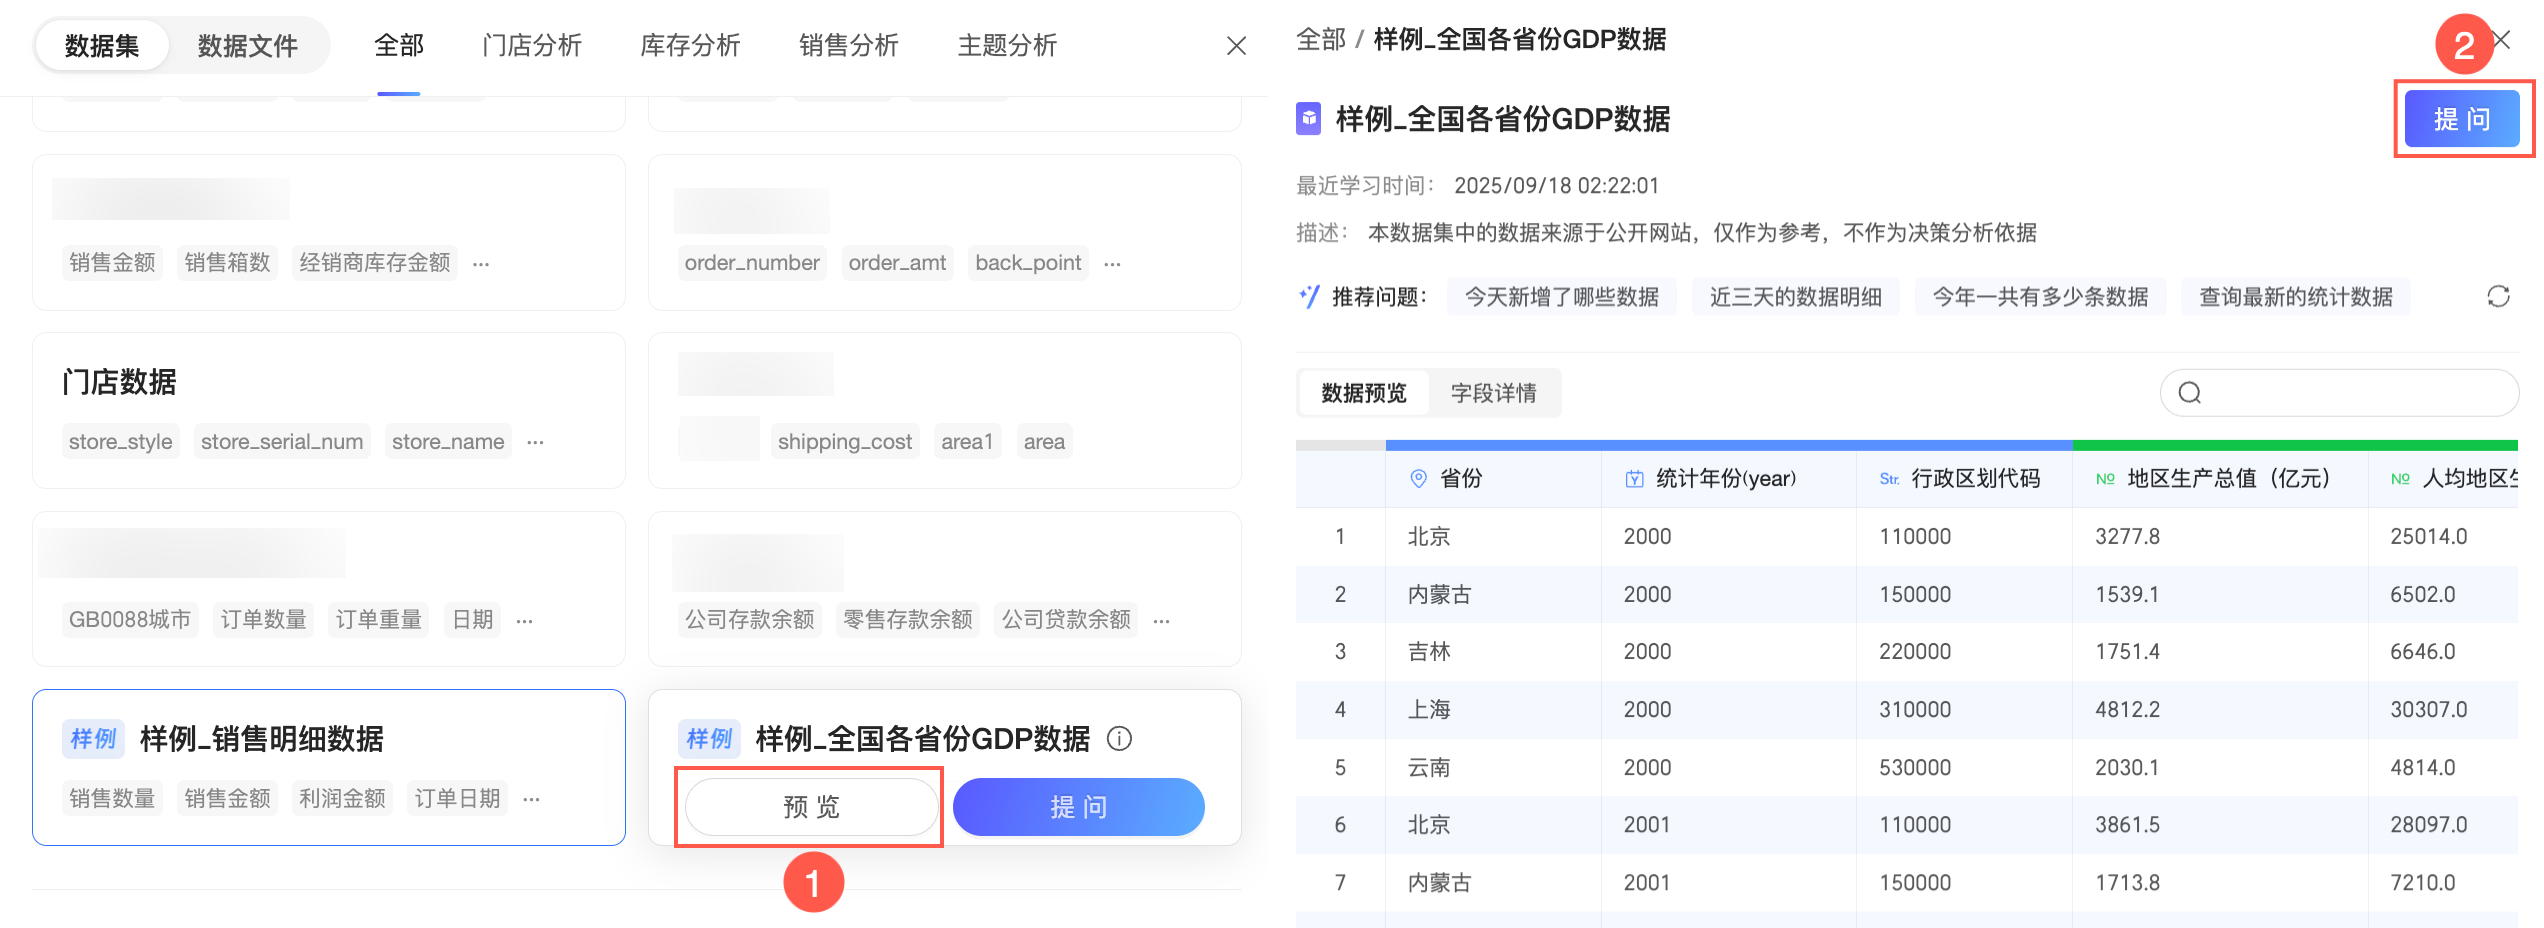
In the Intelligent Data Assistant Q interface, click to select a data source. You can see the datasets and uploaded data files for which you have permissions. Hover over a dataset to Preview it or click Ask to query it directly.
-
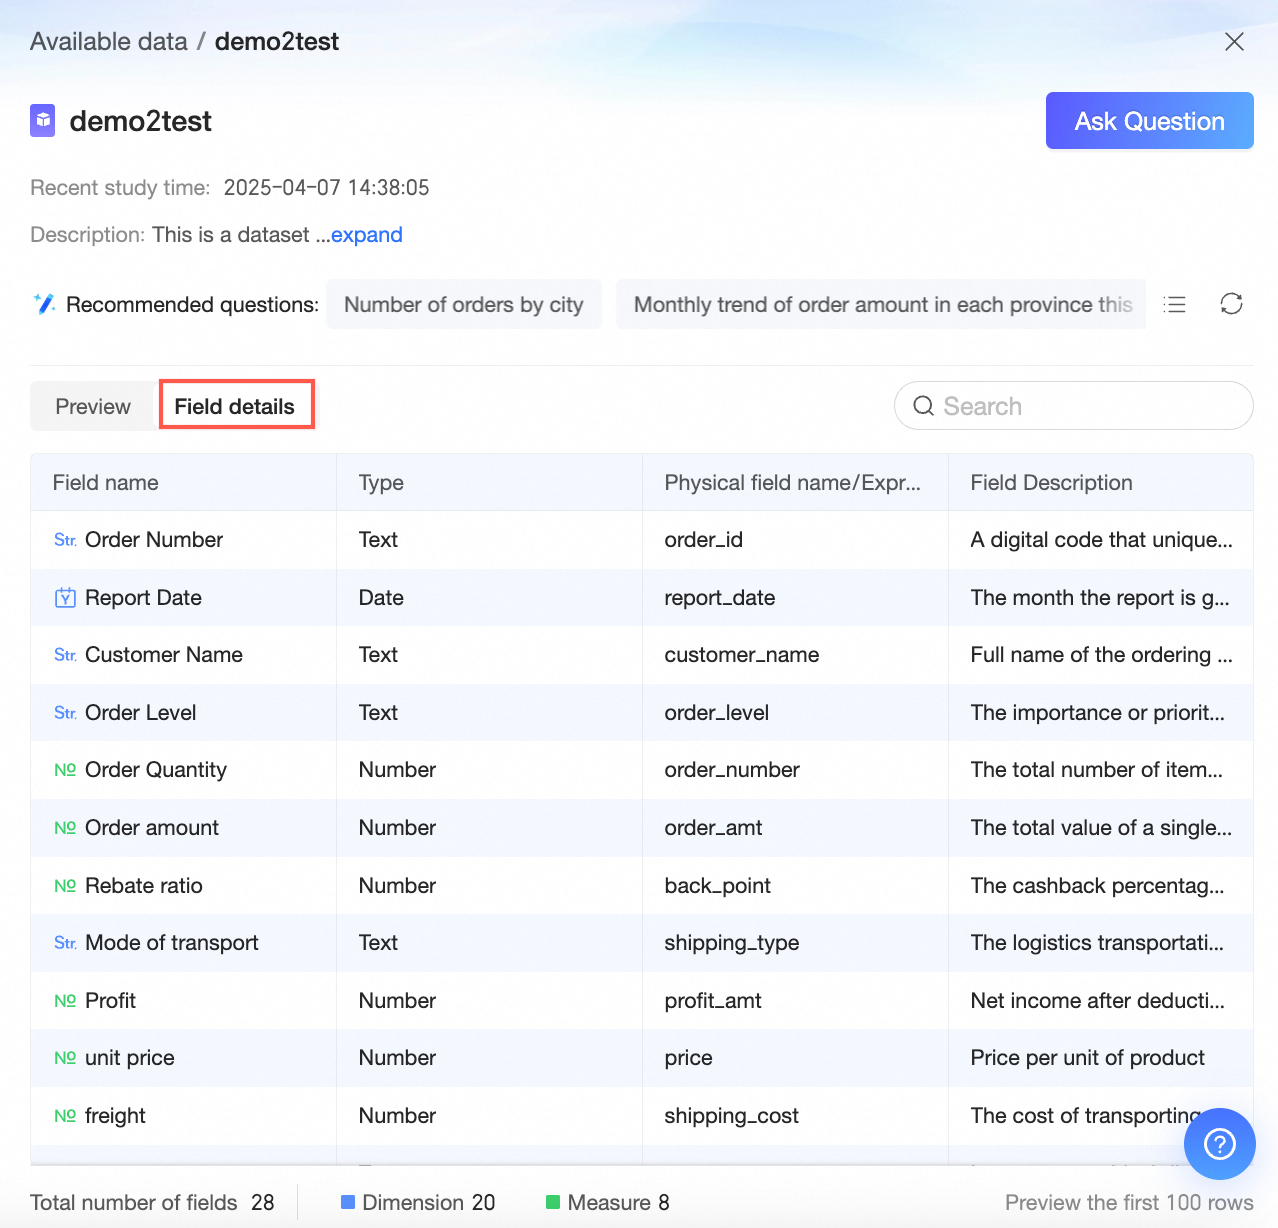
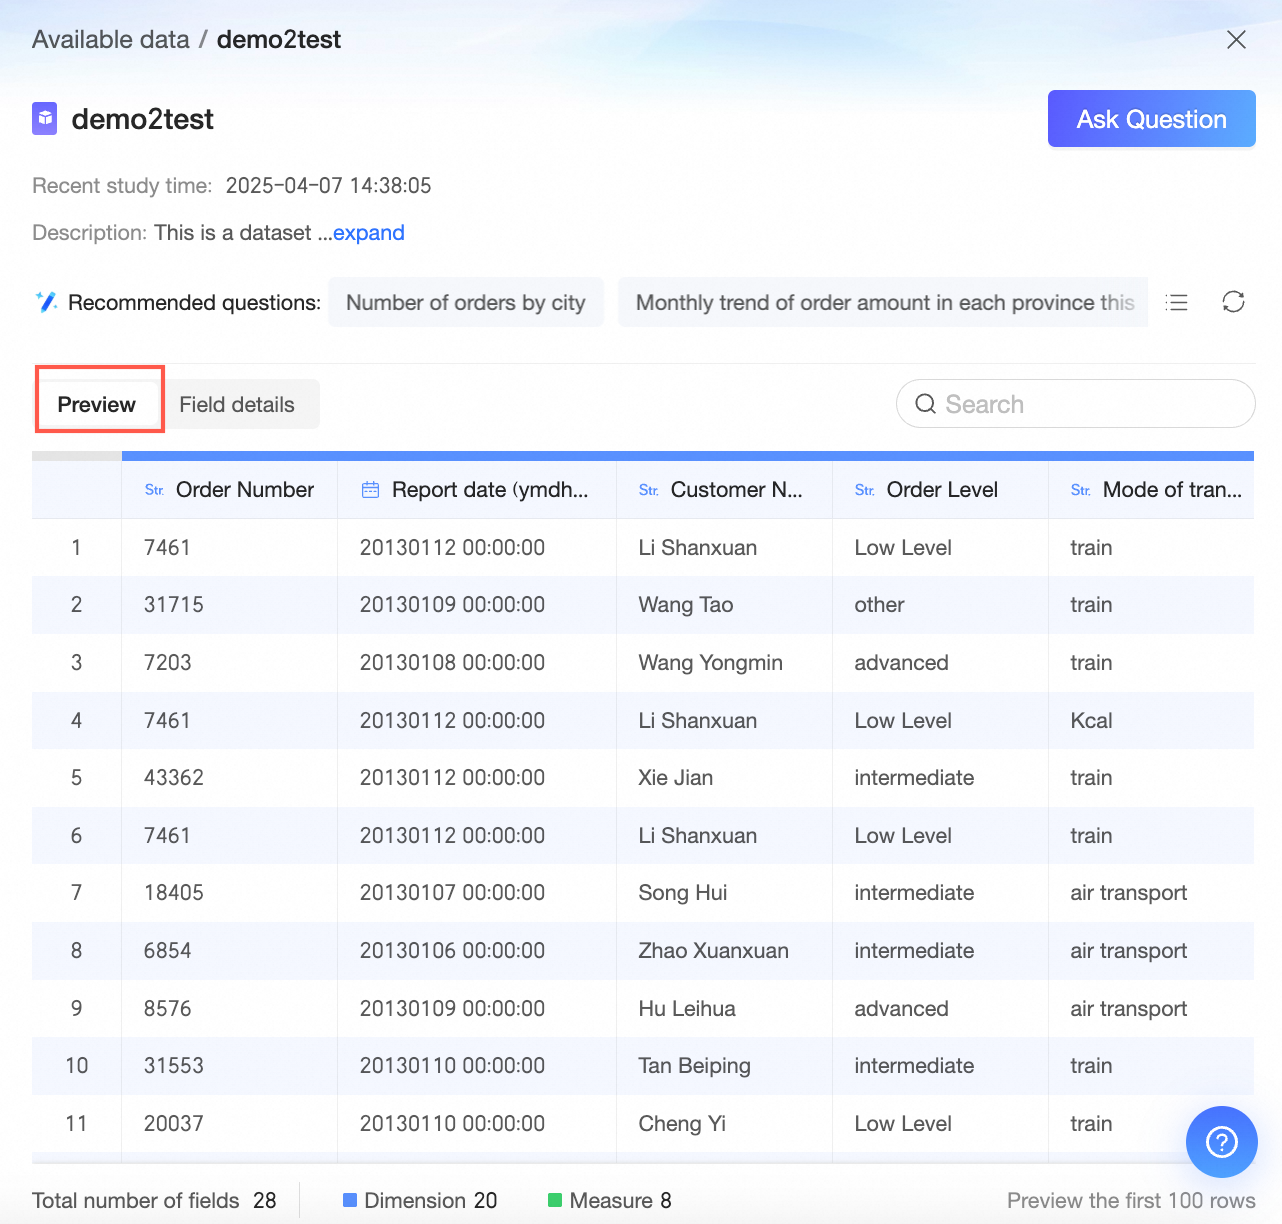
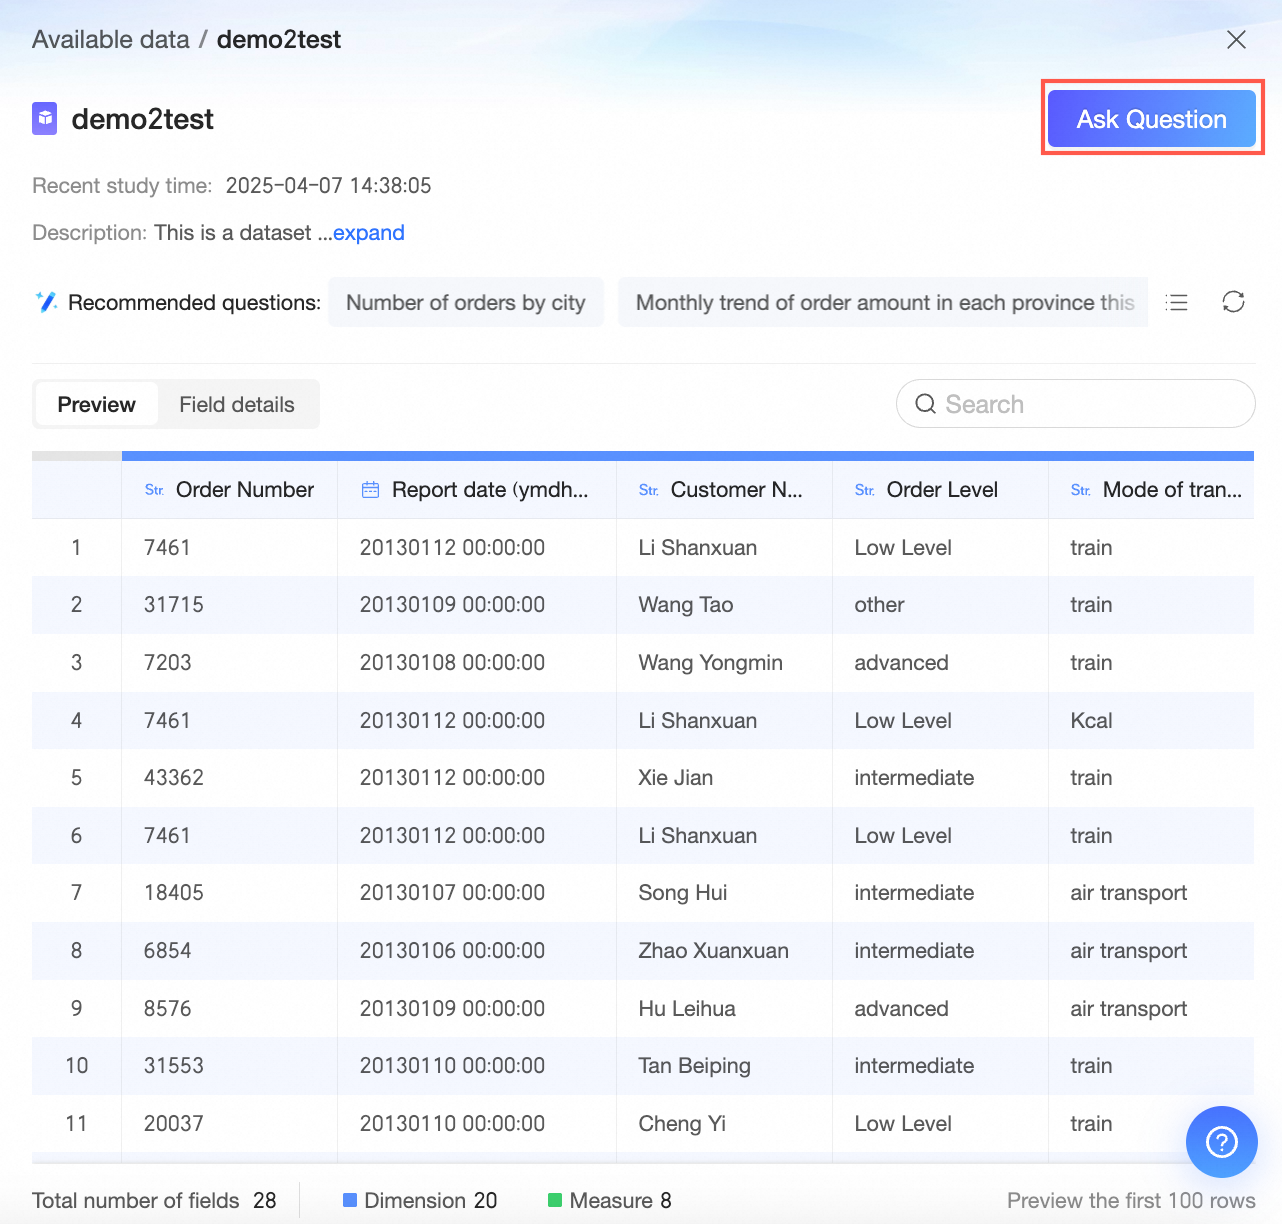
Click Preview (①) to view the dataset's field details and data preview. From here, you can use quick questions or click Ask in the upper-right corner to open the Intelligent Data Assistant Q chat box.
-
Field Details
-
Data Preview
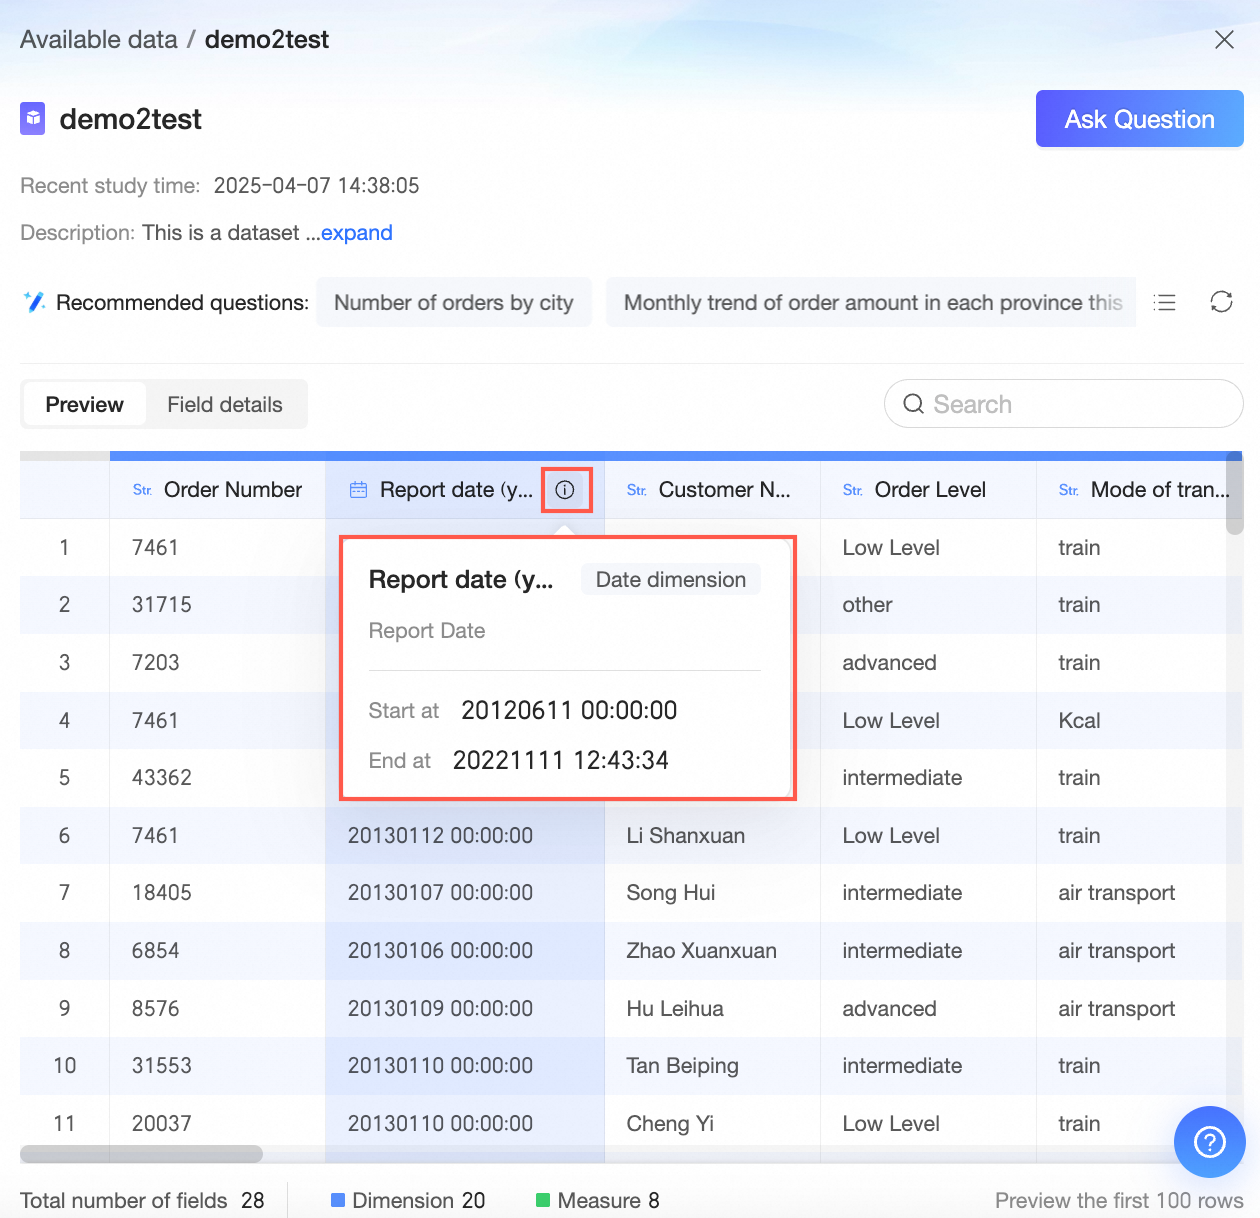
Hover over a dimension field to view its details.
-
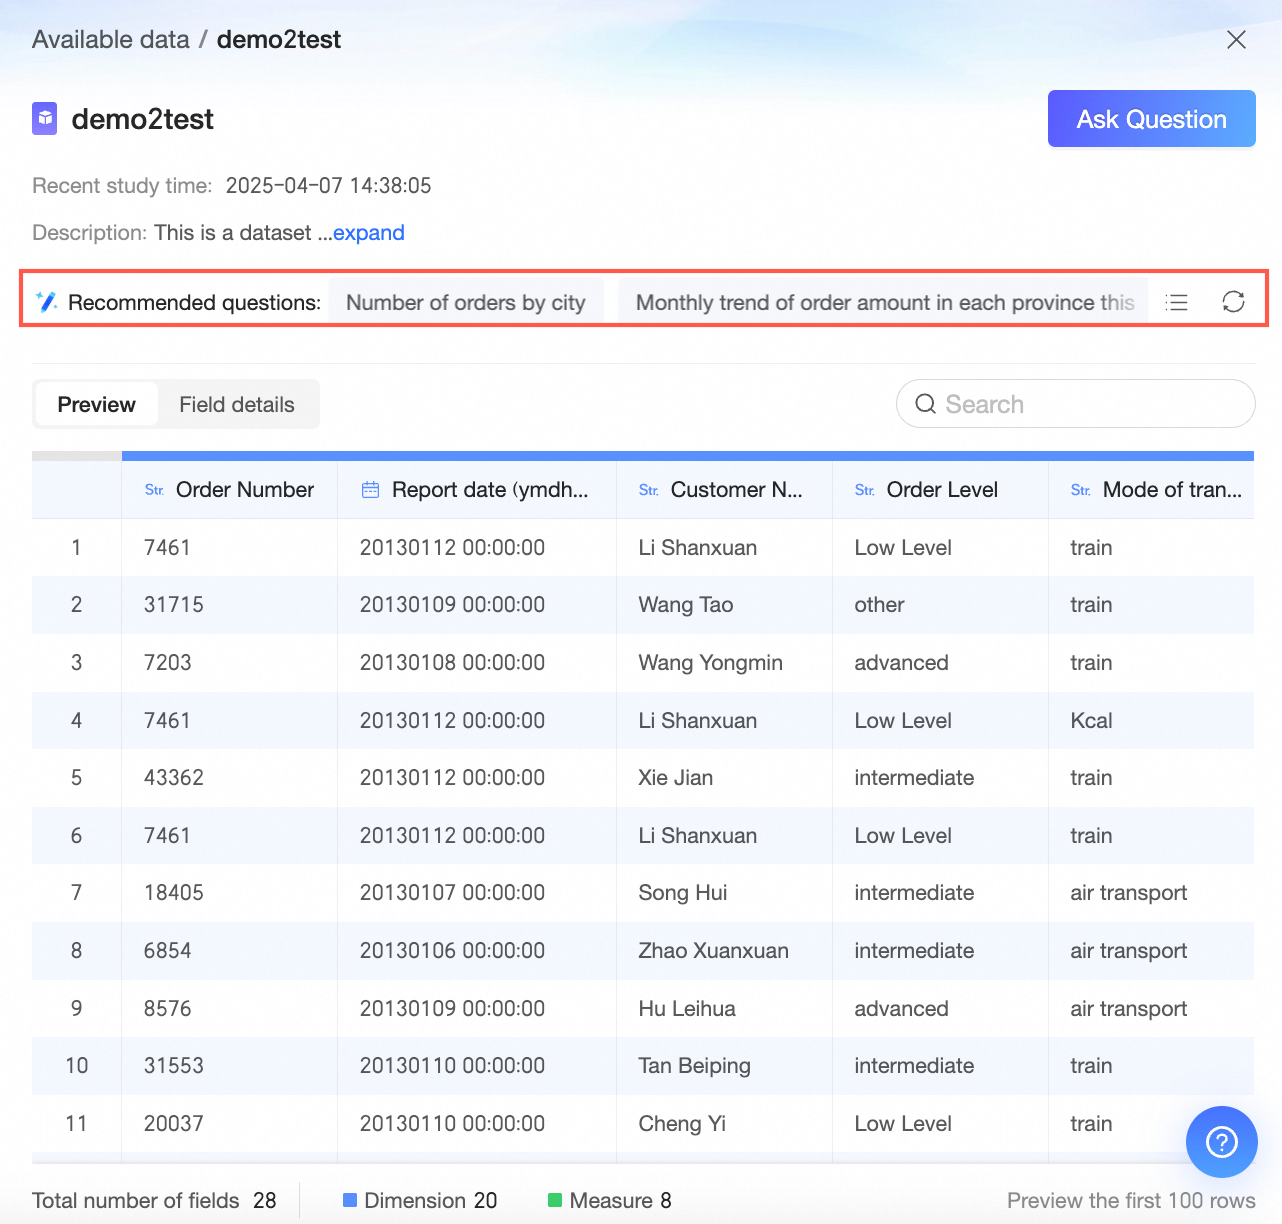
Quick Questions
-
Ask
Start asking questions about the current dataset.
-
-
Click Ask (②) to open the Q&A interface for the current dataset.
-
-
After selecting a dataset, you can click the
icon next to its name to preview its data fields, including key metrics and analysis dimensions.Click the icon again to collapse the field view.
-
During your conversation, you can preview data and switch datasets.
-
Preview data
Click the
icon next to the selected dataset name to open the data preview. -
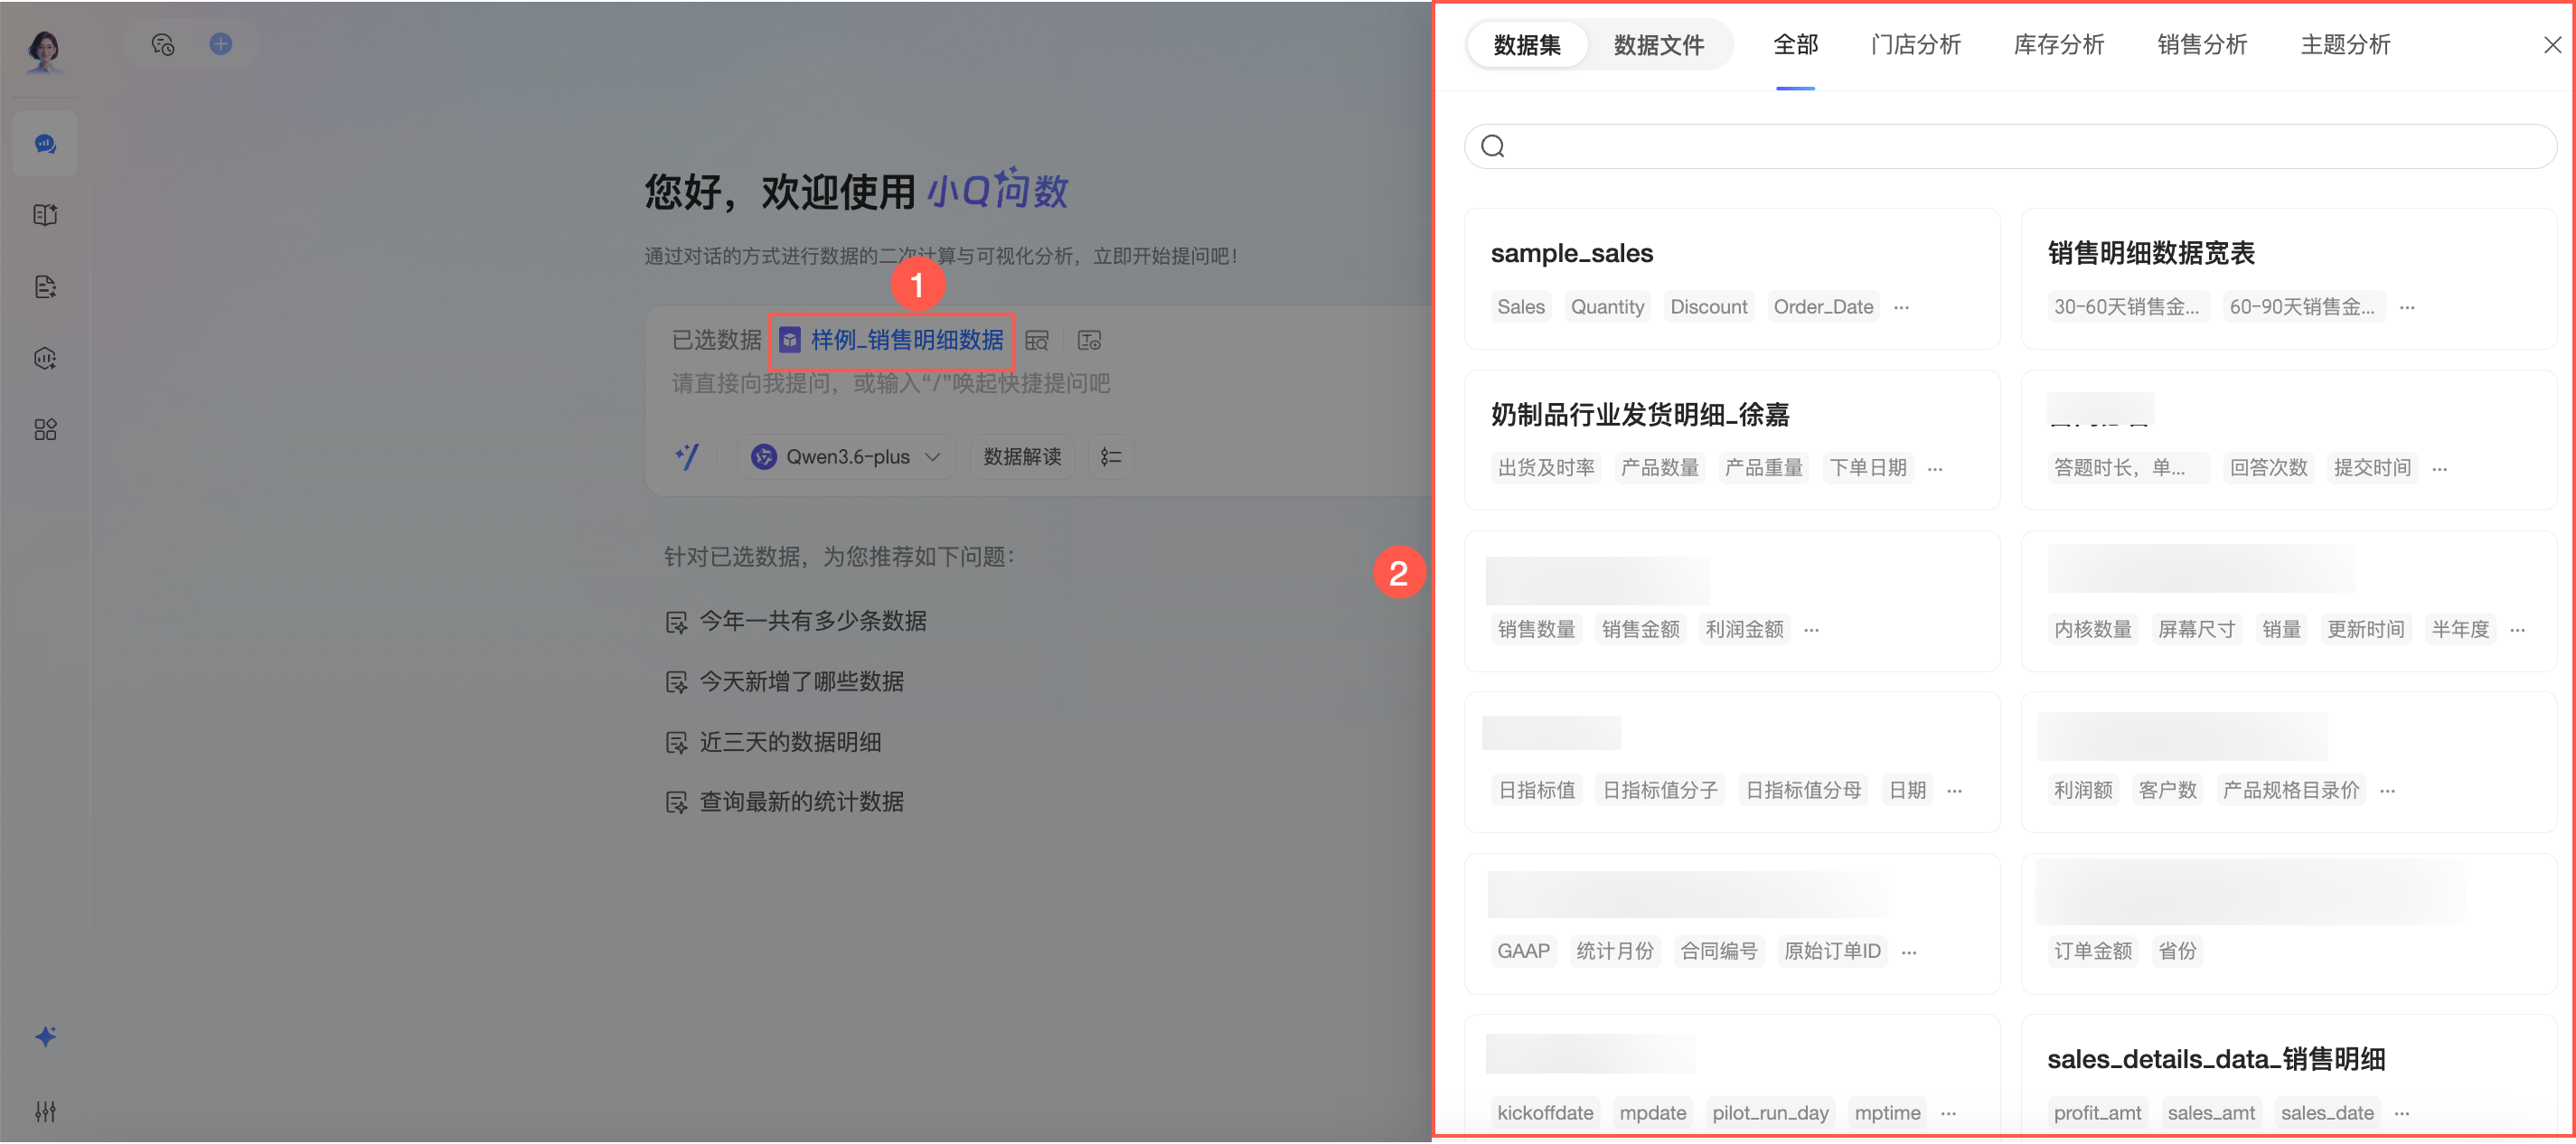
Switch datasets
-
Click the name of the selected dataset to view available datasets.
-
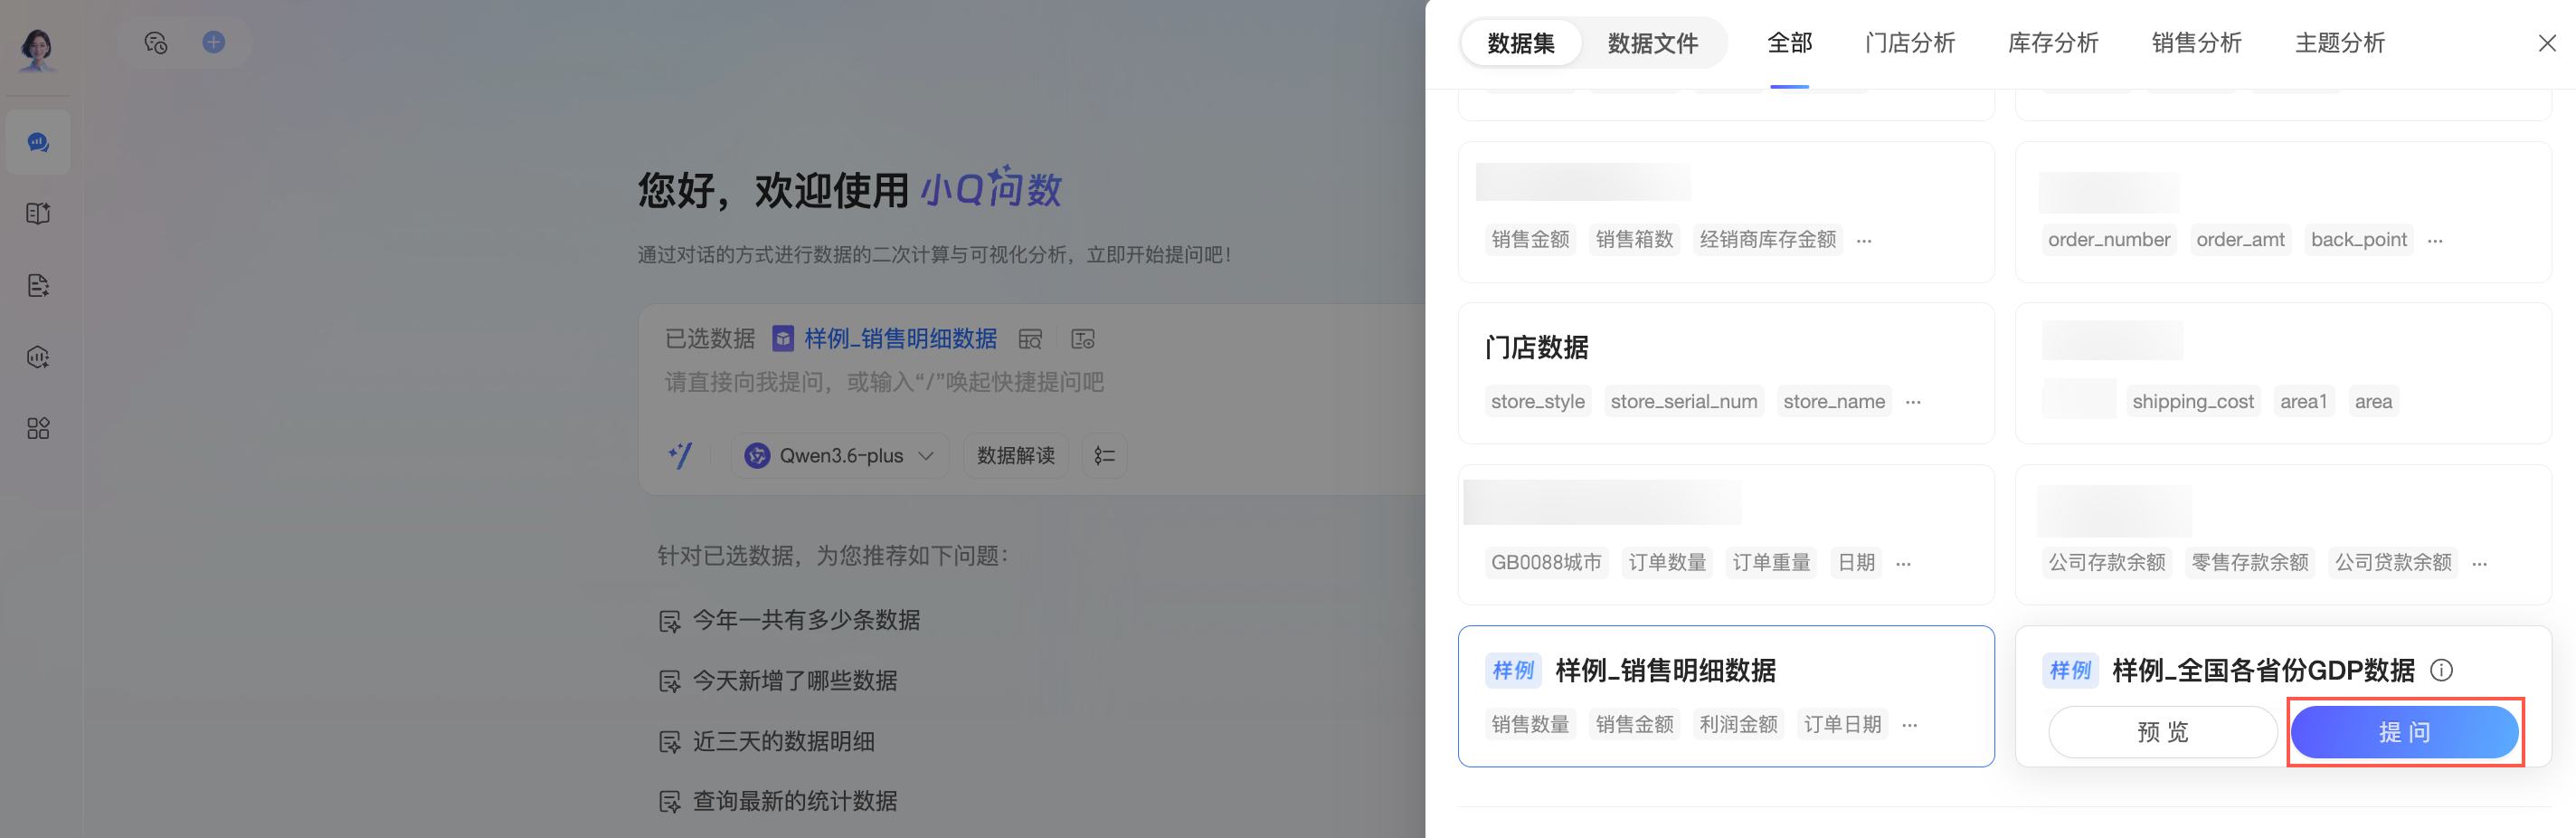
Hover over a target dataset and click Ask to switch to it.
You can also Preview the target dataset before clicking Ask.
-
-
 icon next to its name to preview its data fields, including key metrics and analysis dimensions.

 icon next to the selected dataset name to open the data preview.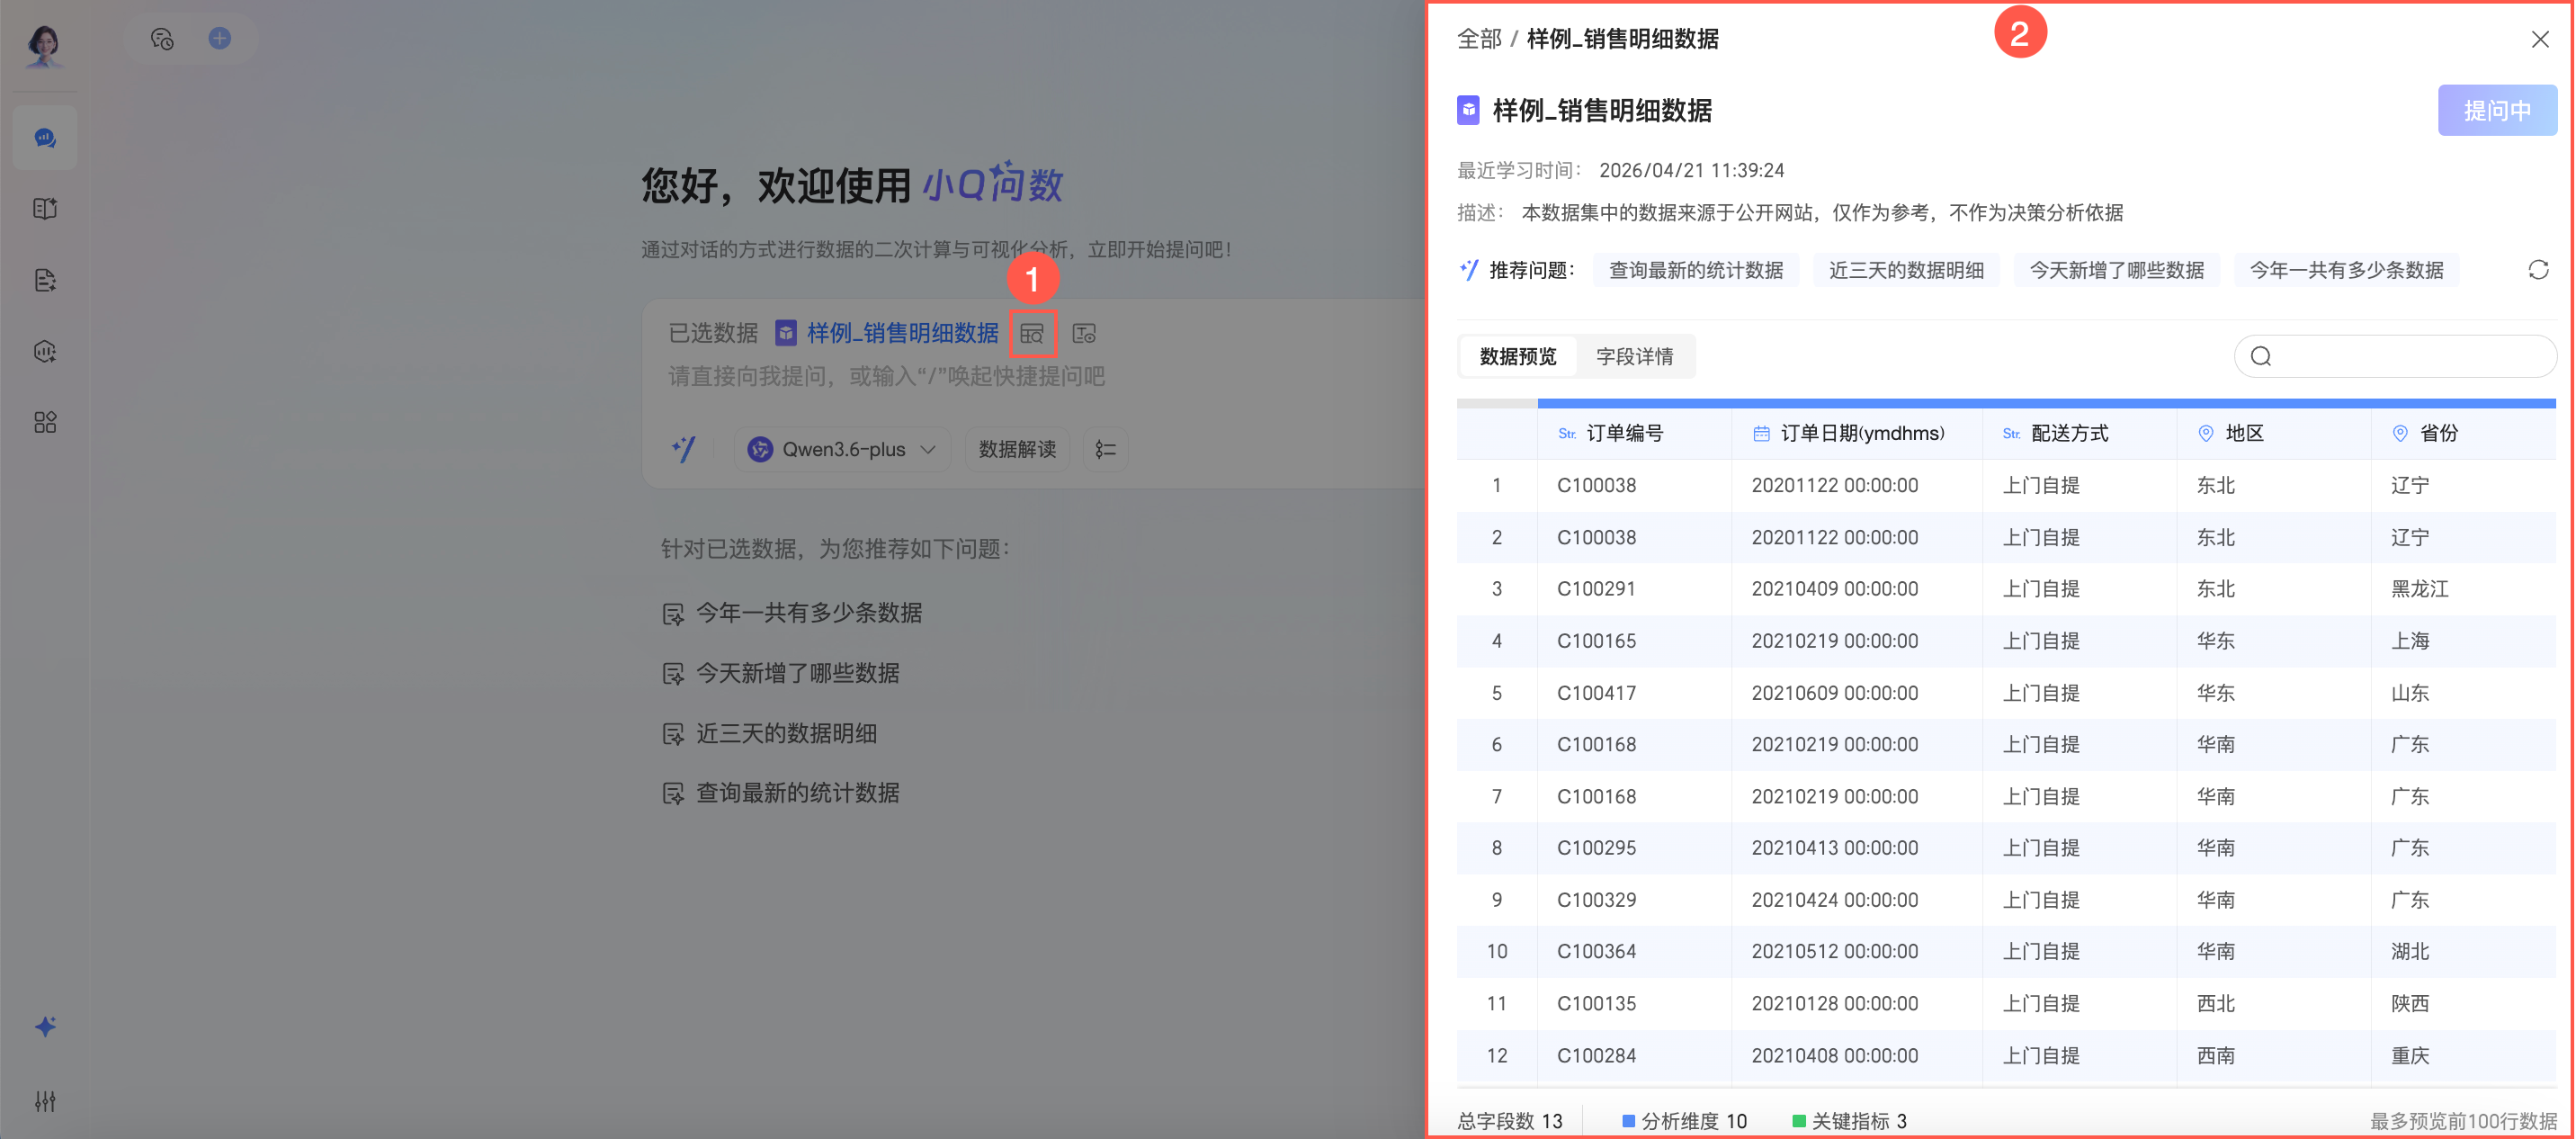
Select multiple datasets
If your question requires data from multiple datasets, you can select and query them together.
This section only describes the steps for selecting multiple datasets. For other operations, see Select a single dataset.
-
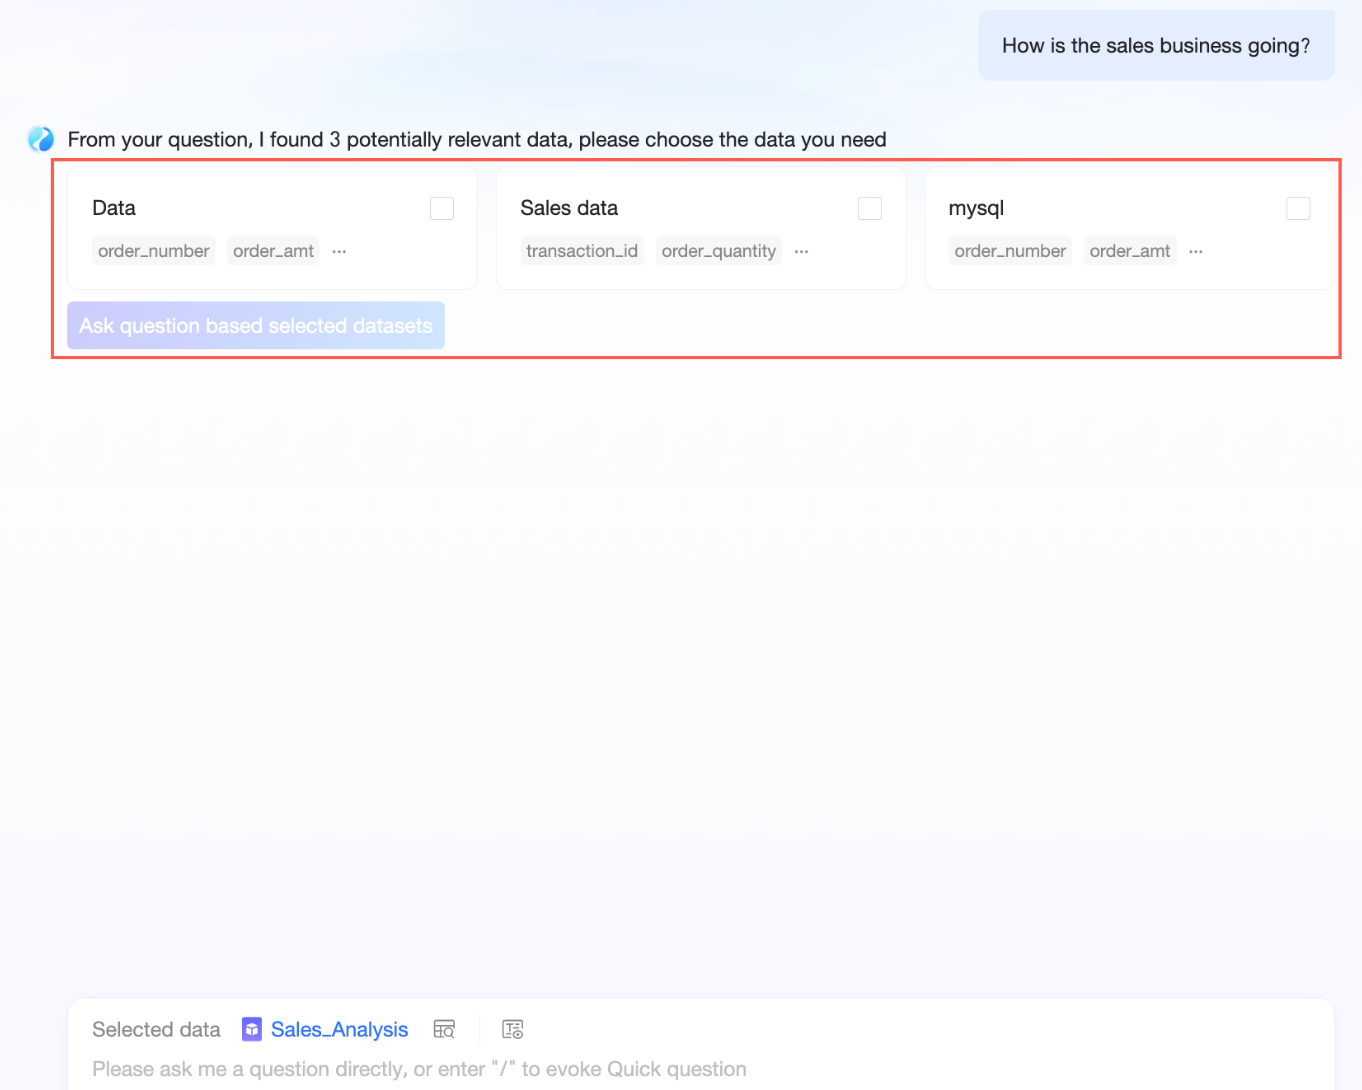
Enter your question.
The system displays potentially relevant datasets. You can select the ones you need.
-
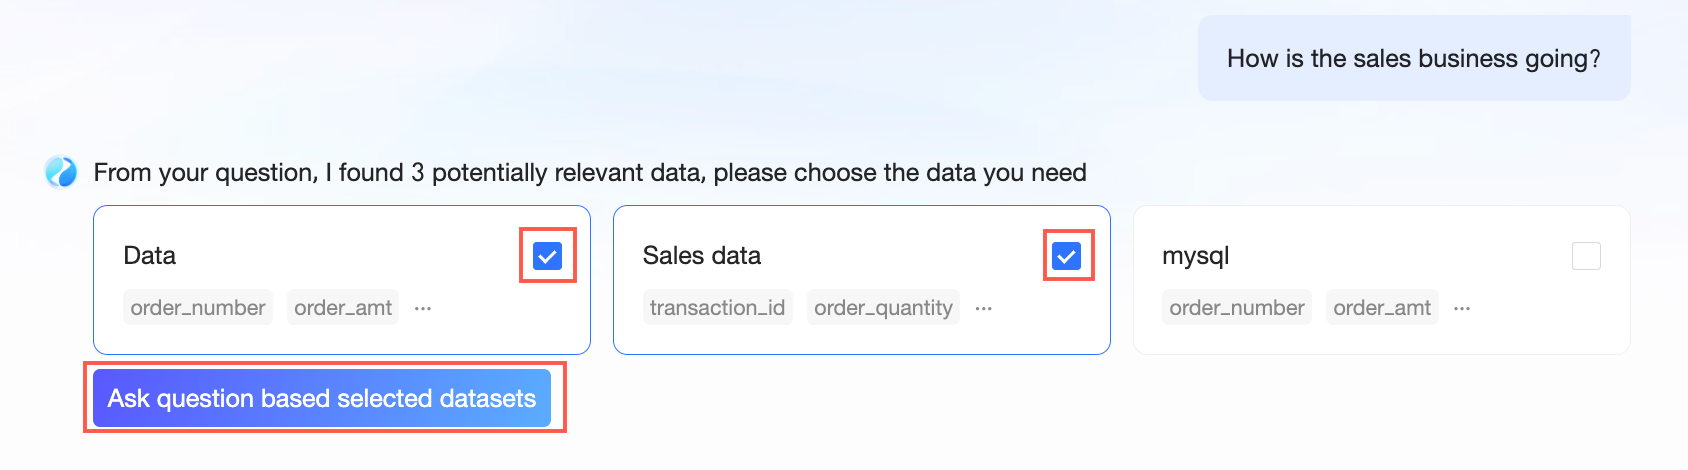
Select the checkboxes for multiple datasets and click Ask based on the selected data.
-
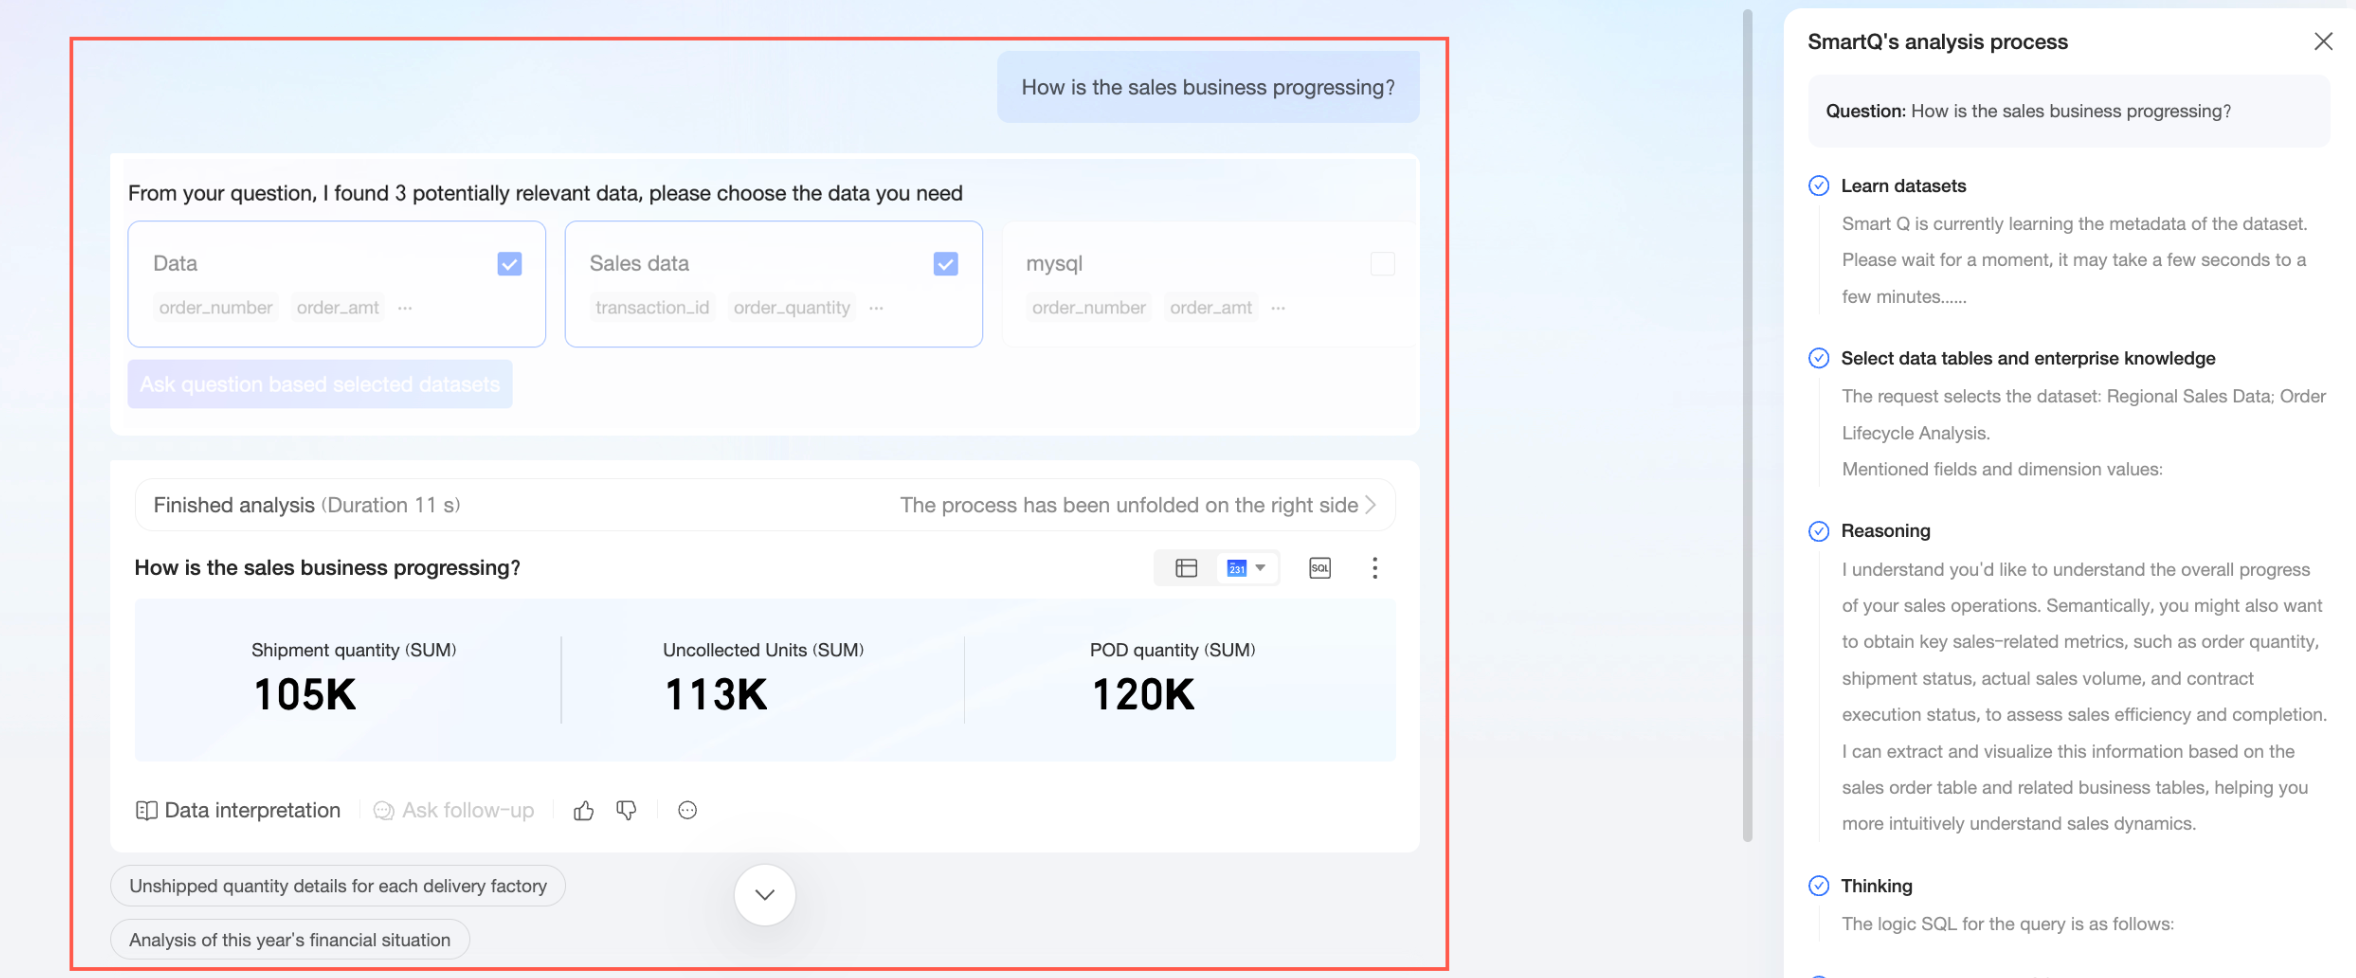
View the analysis result.
Ask questions and get answers
Intelligent Data Assistant Q supports various inference and data interpretation modes. This example uses the Qwen3.6-plus large model for inference without data interpretation. For results from other modes, see Inference and interpretation modes.
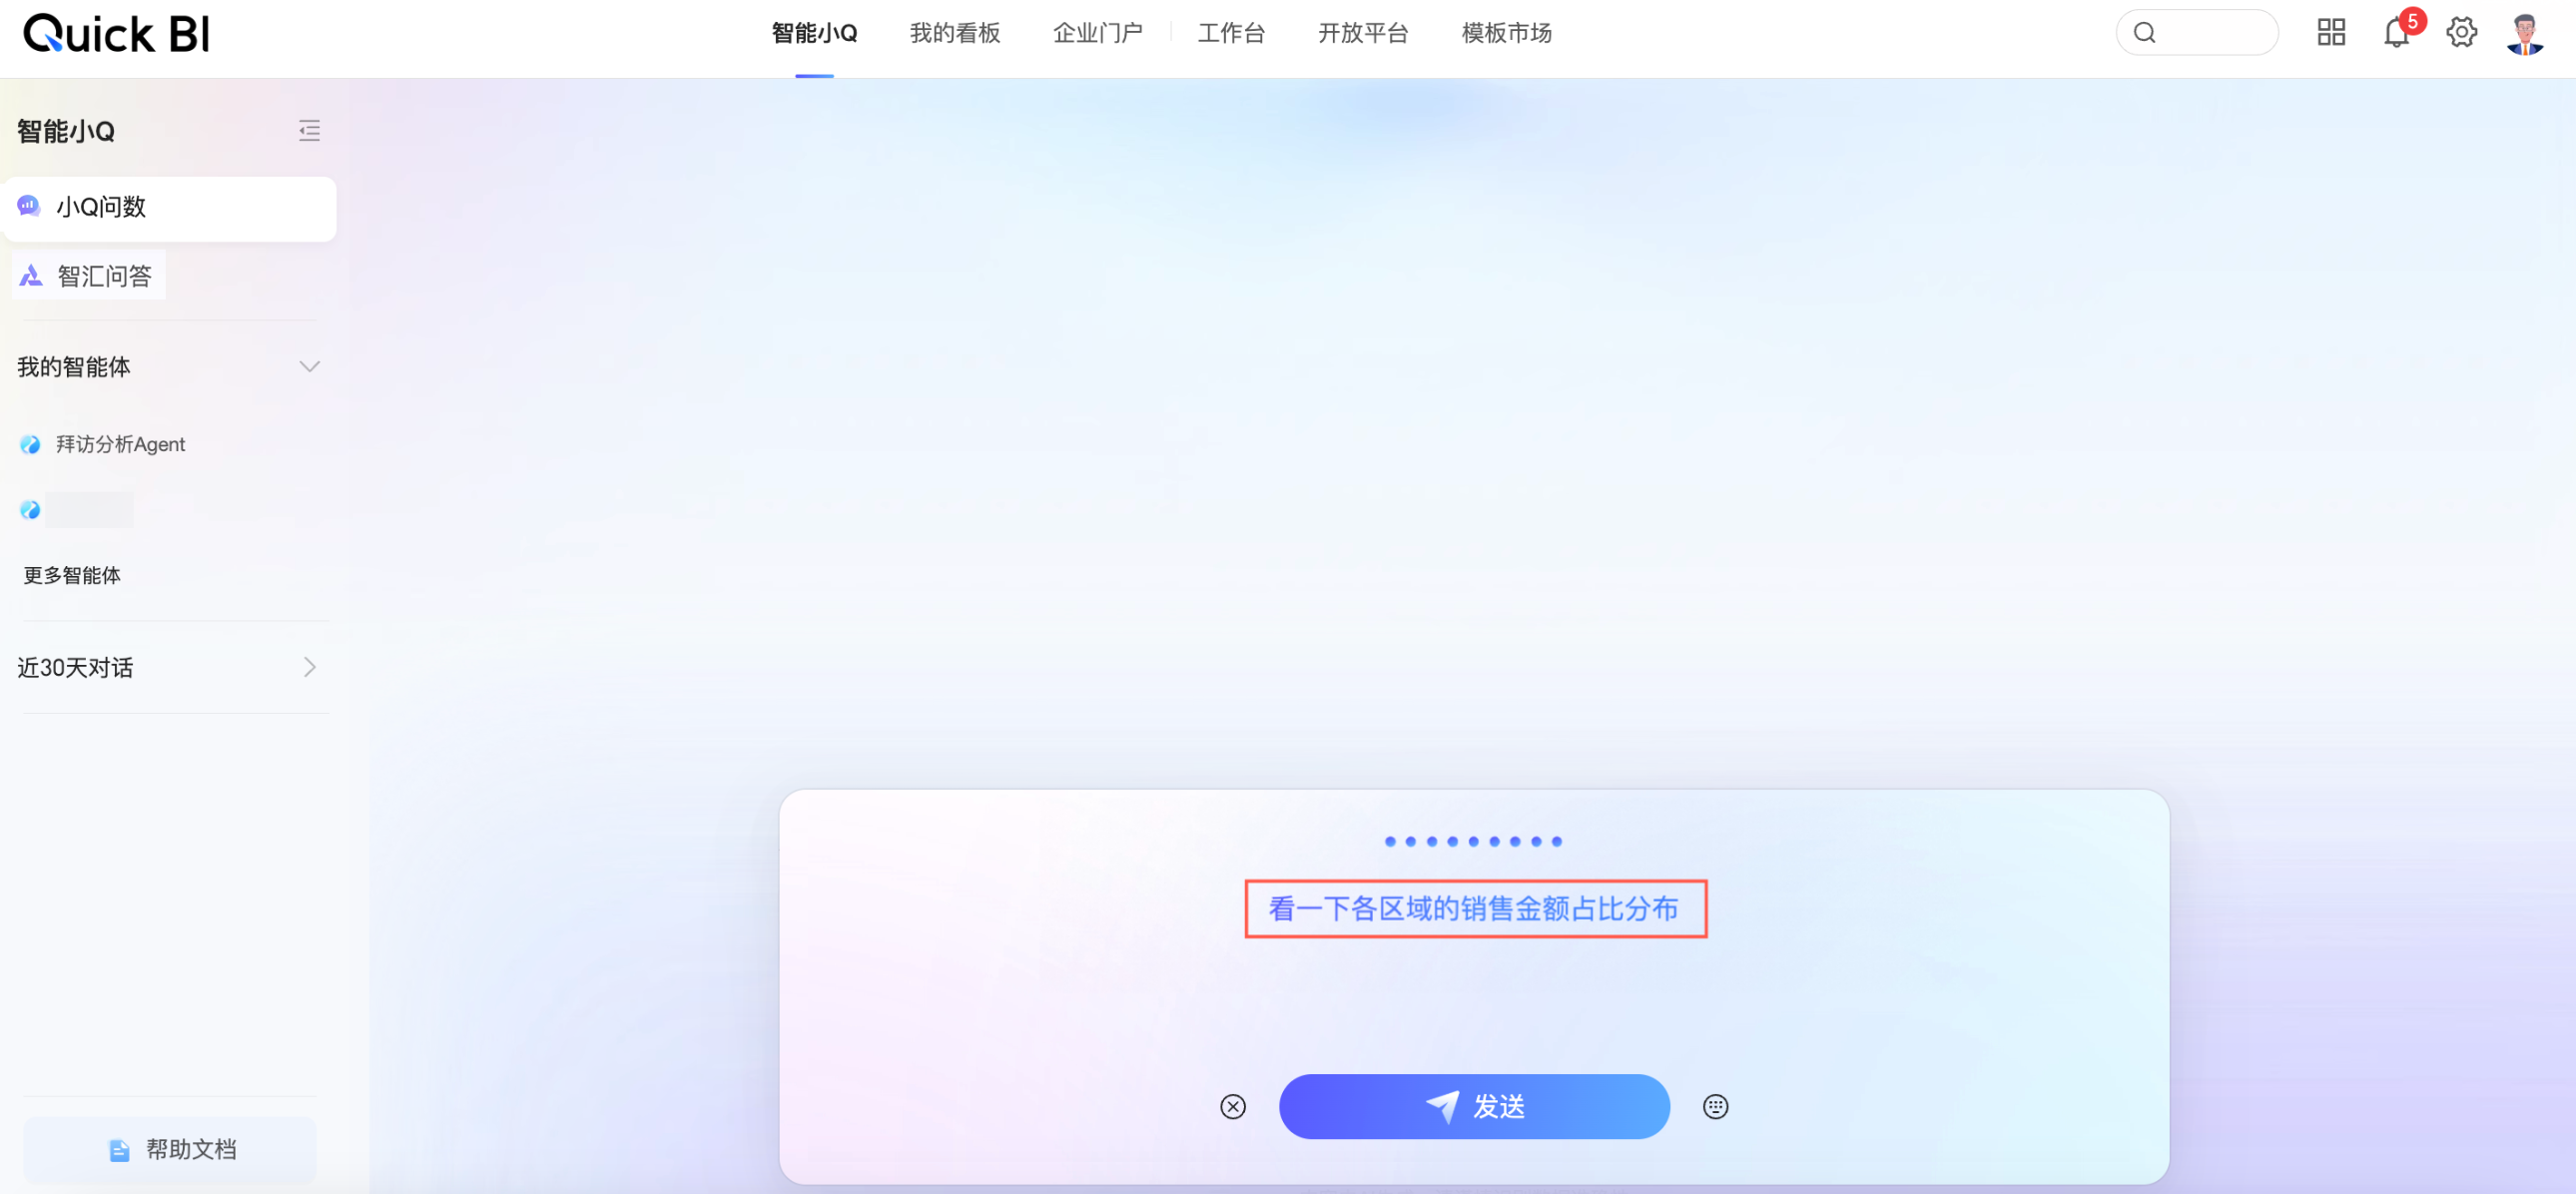
Enter a question in the chat box and send it. You can type questions directly, use quick questions, or use voice input.
Enter a question directly
-
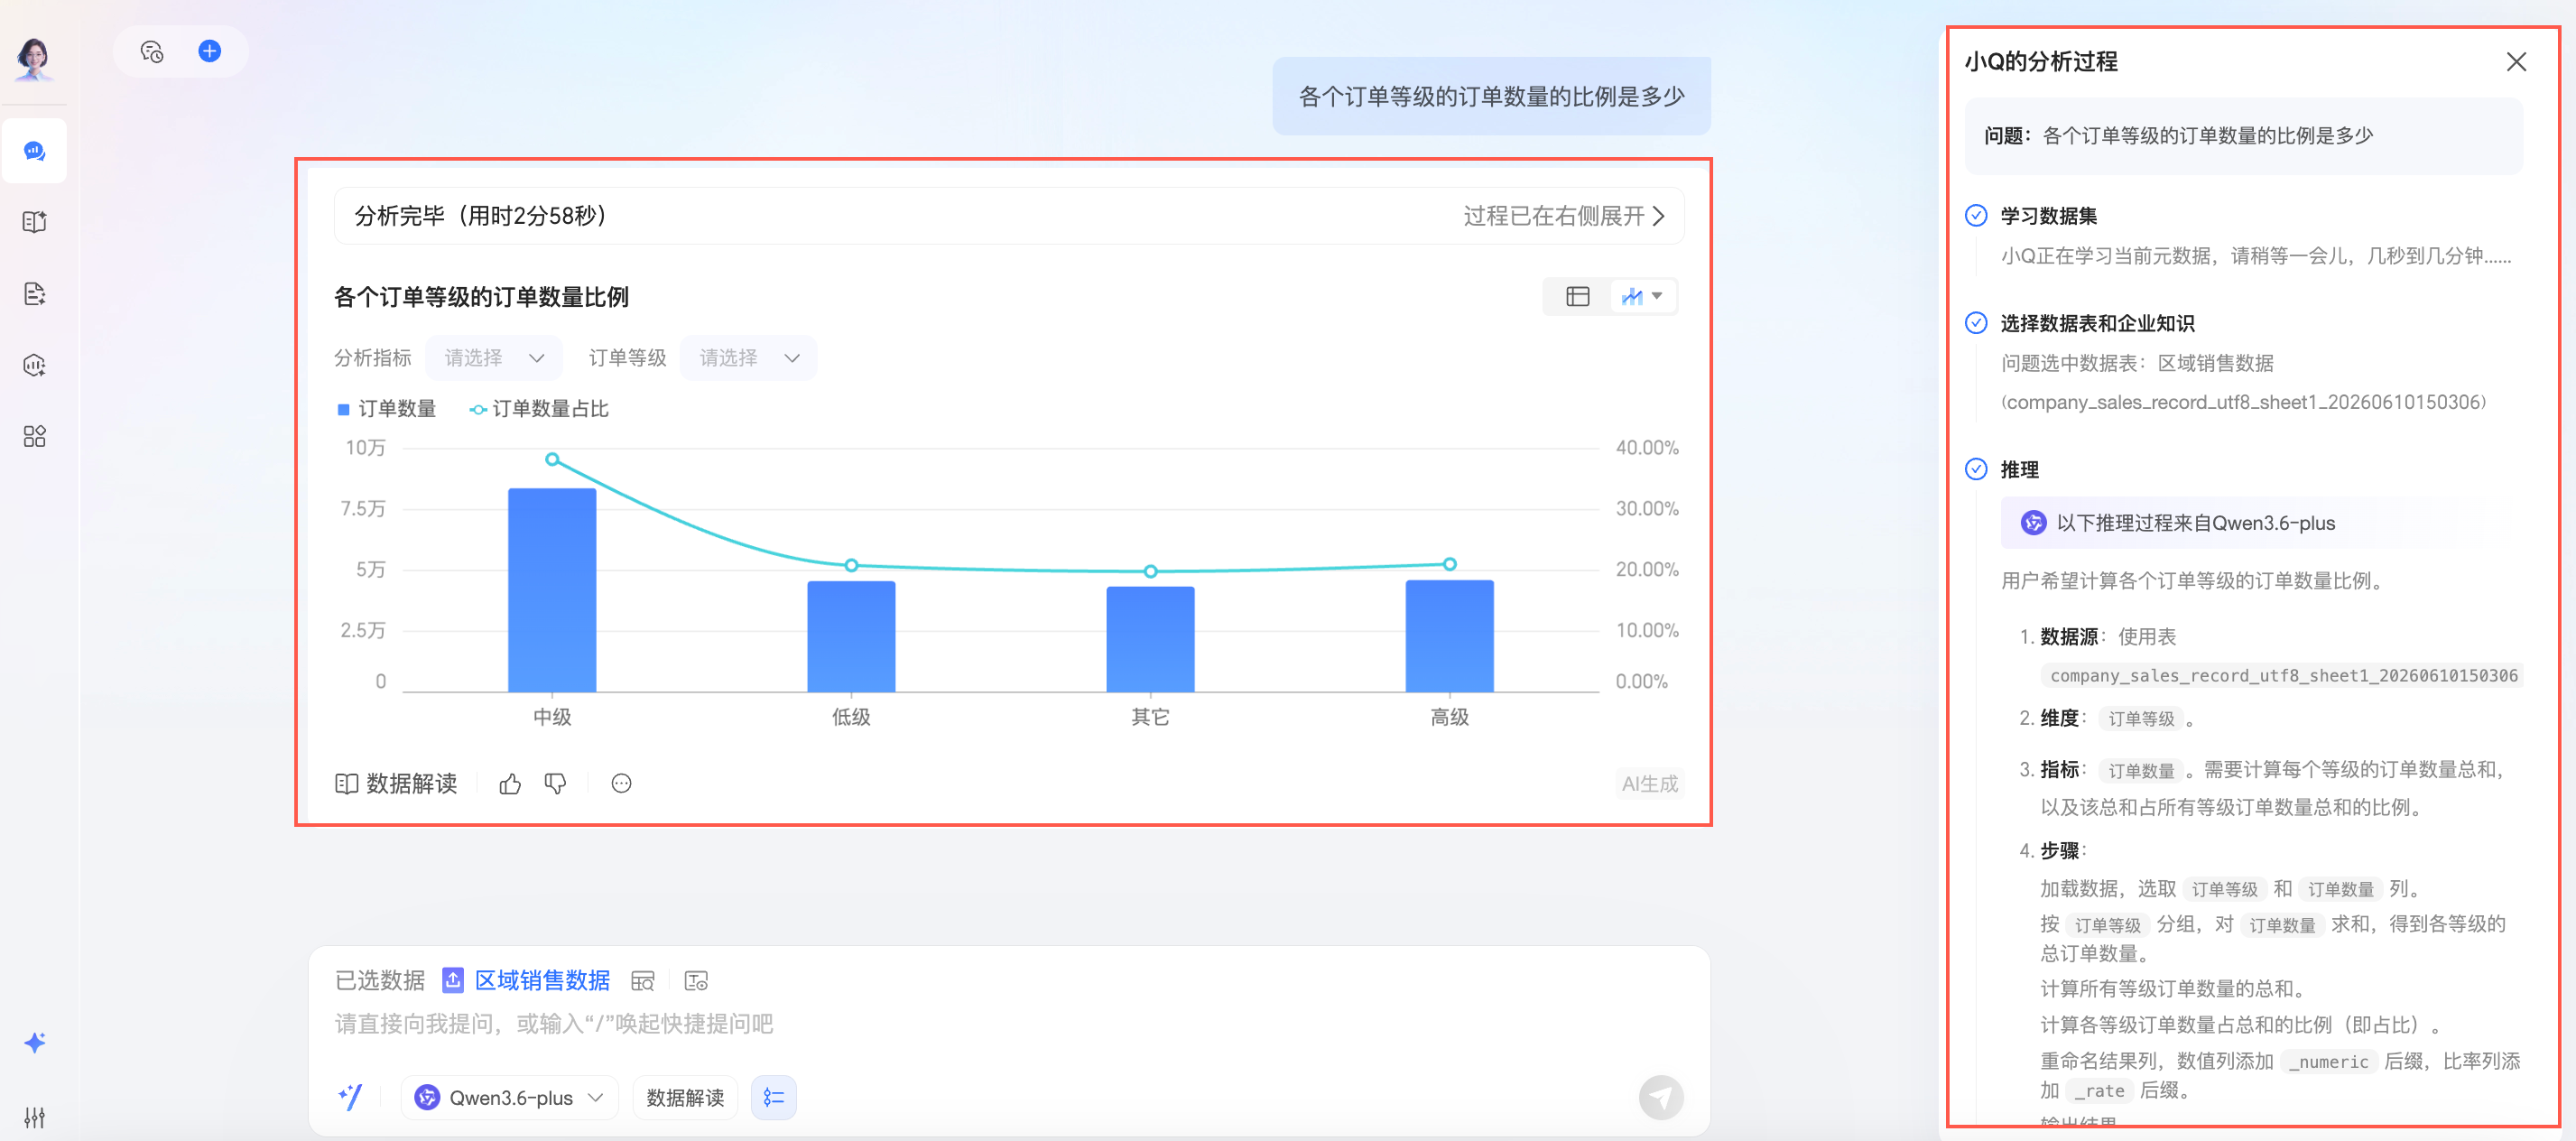
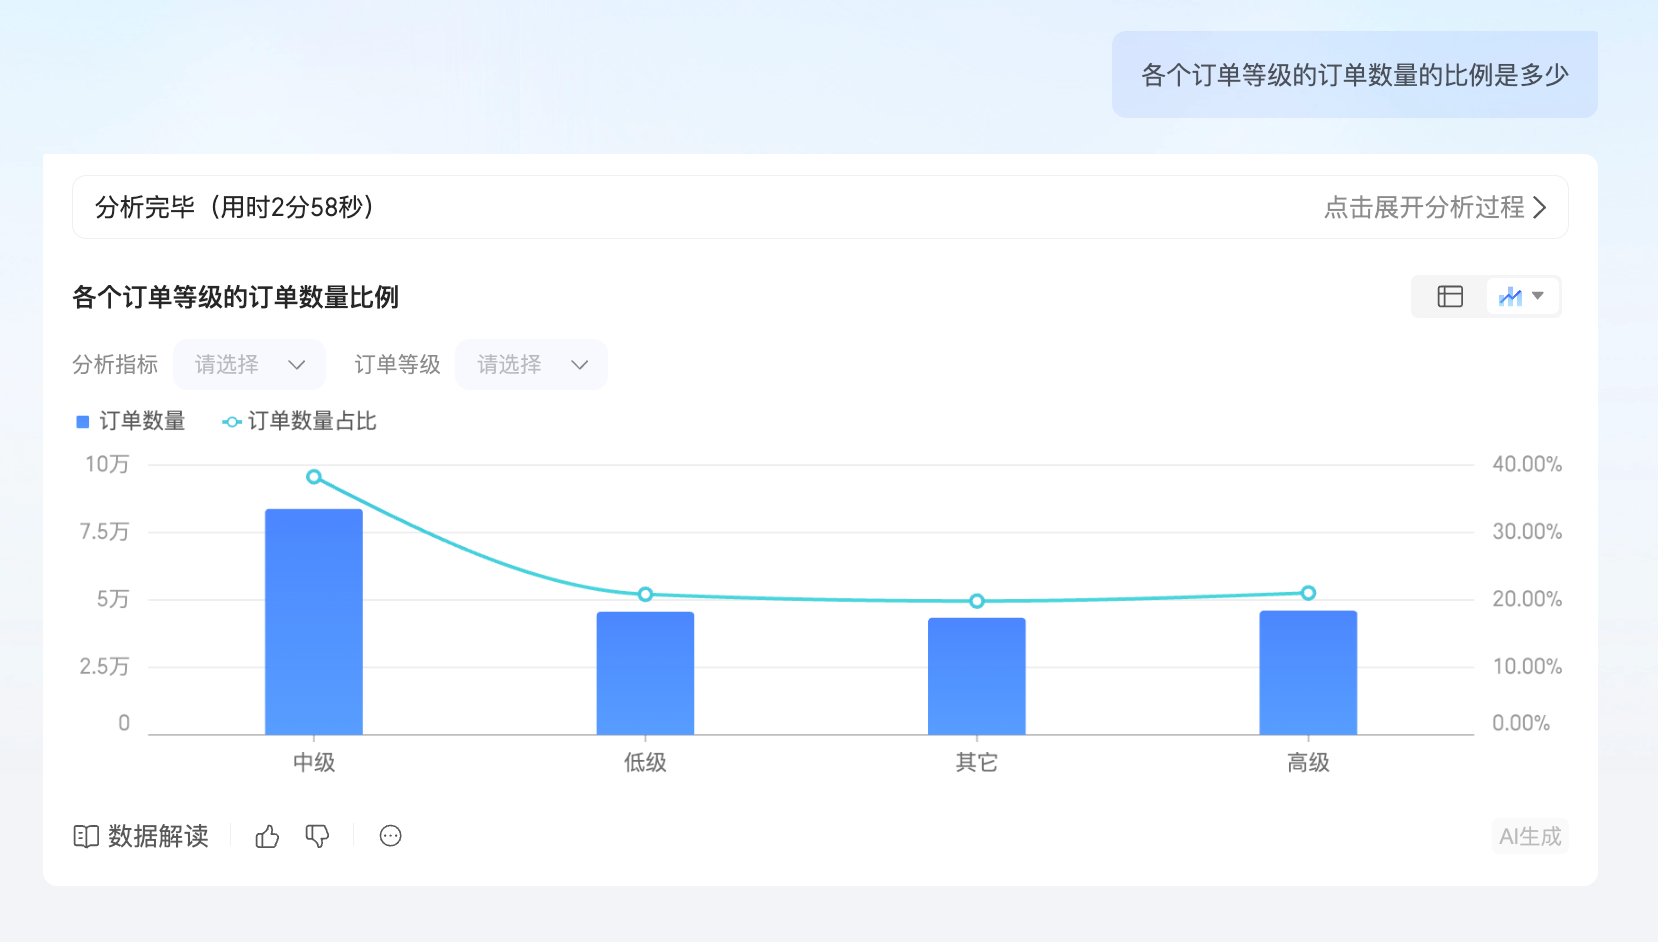
For example, if you enter "What is the proportion of orders for each order level?" and send it, the system returns a data analysis result and displays the analysis process on the right.
If you do not need to see the analysis process, click the
icon on the right to hide it.When hidden, only the chart appears.
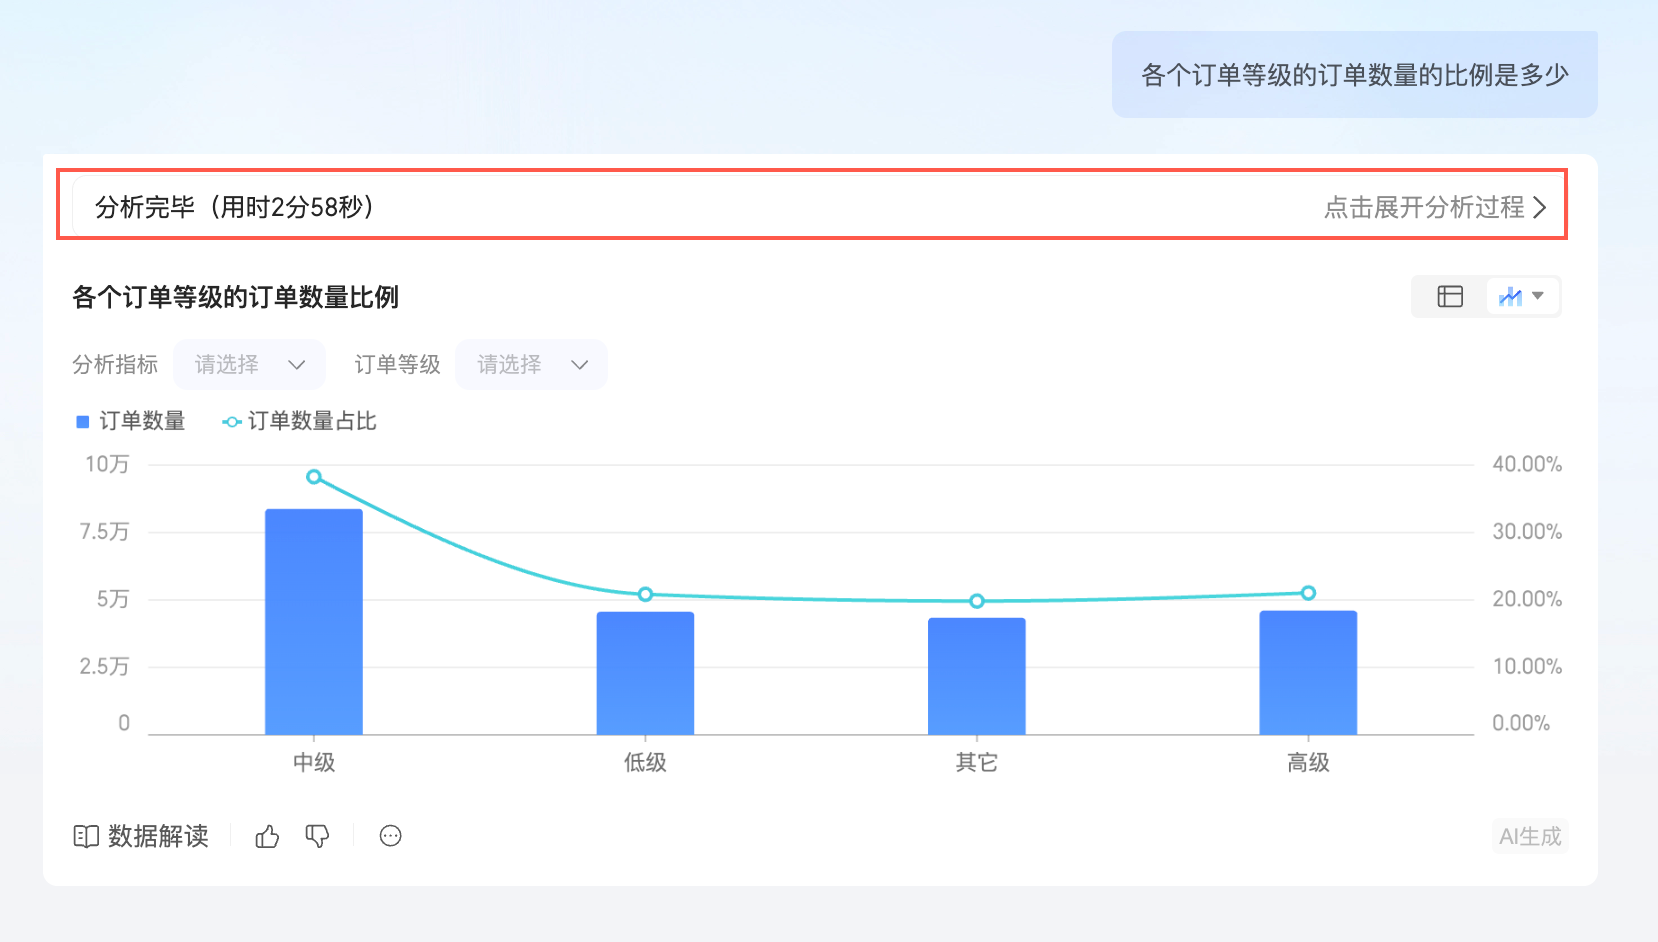
You can click Analysis Complete to expand the analysis process again.
-
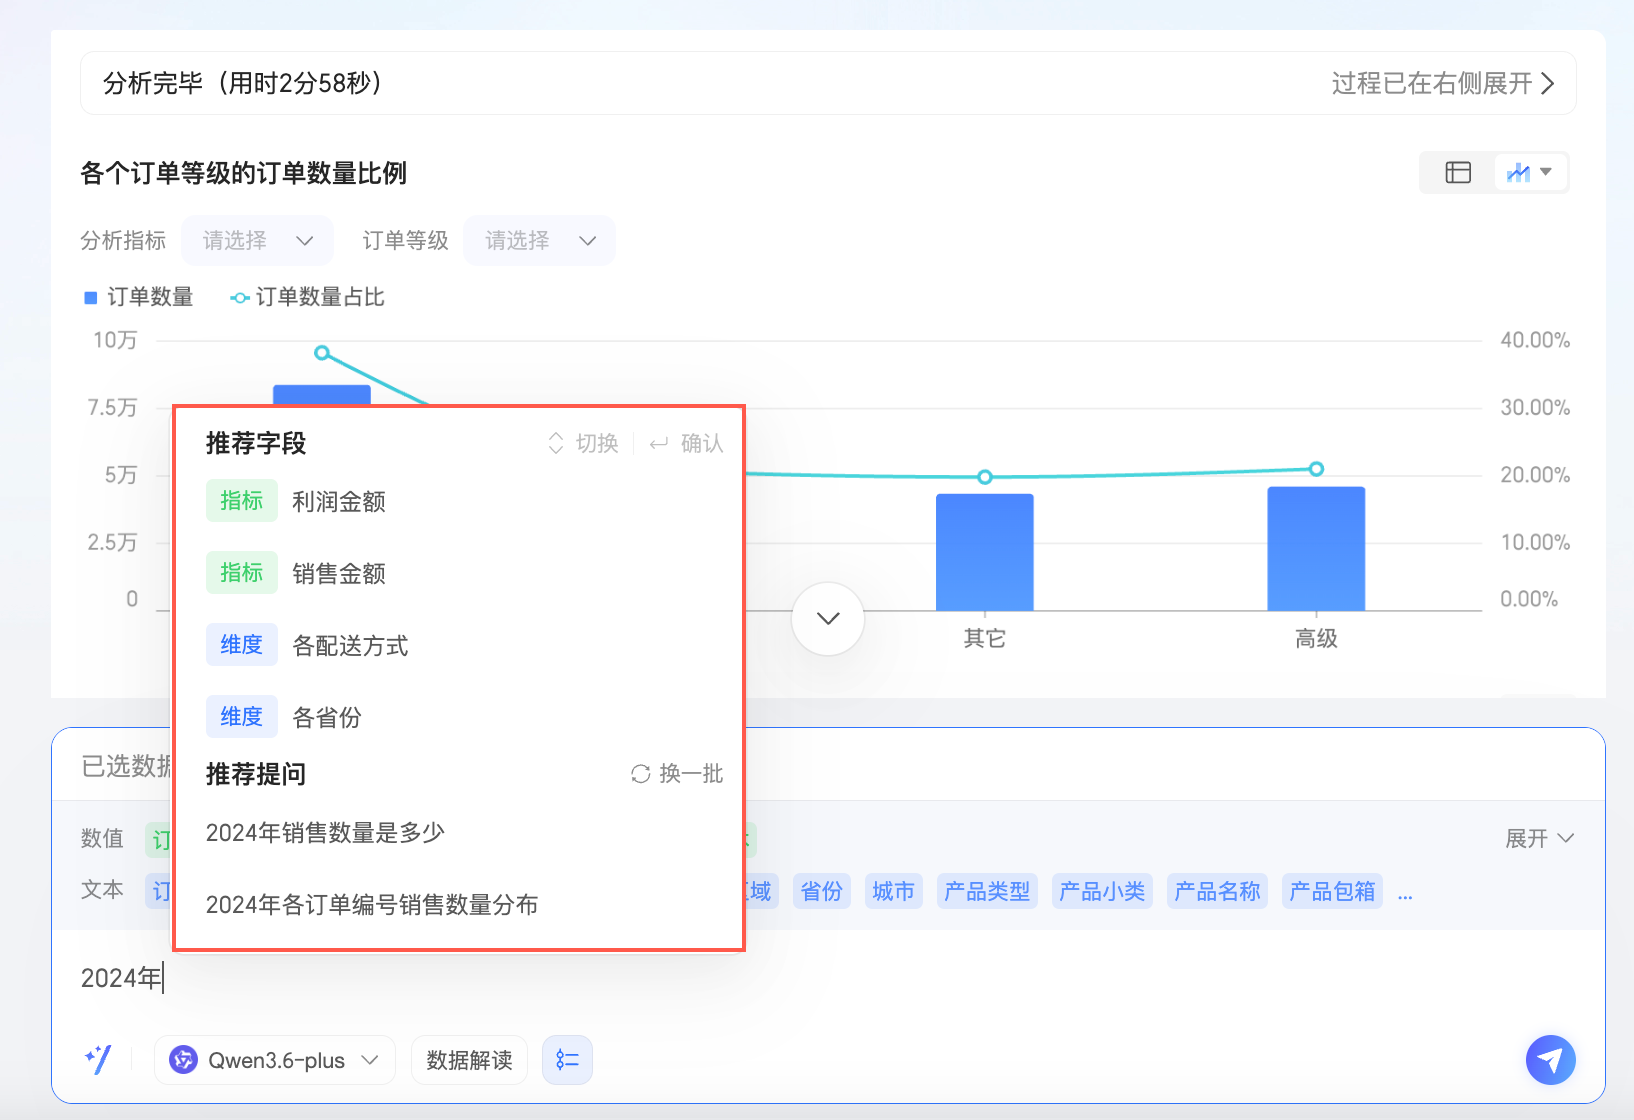
As you type, the system may suggest recommended fields and recommended questions. For example, typing "2024" might display the following suggestions, which you can select based on your needs.
 icon on the right to hide it.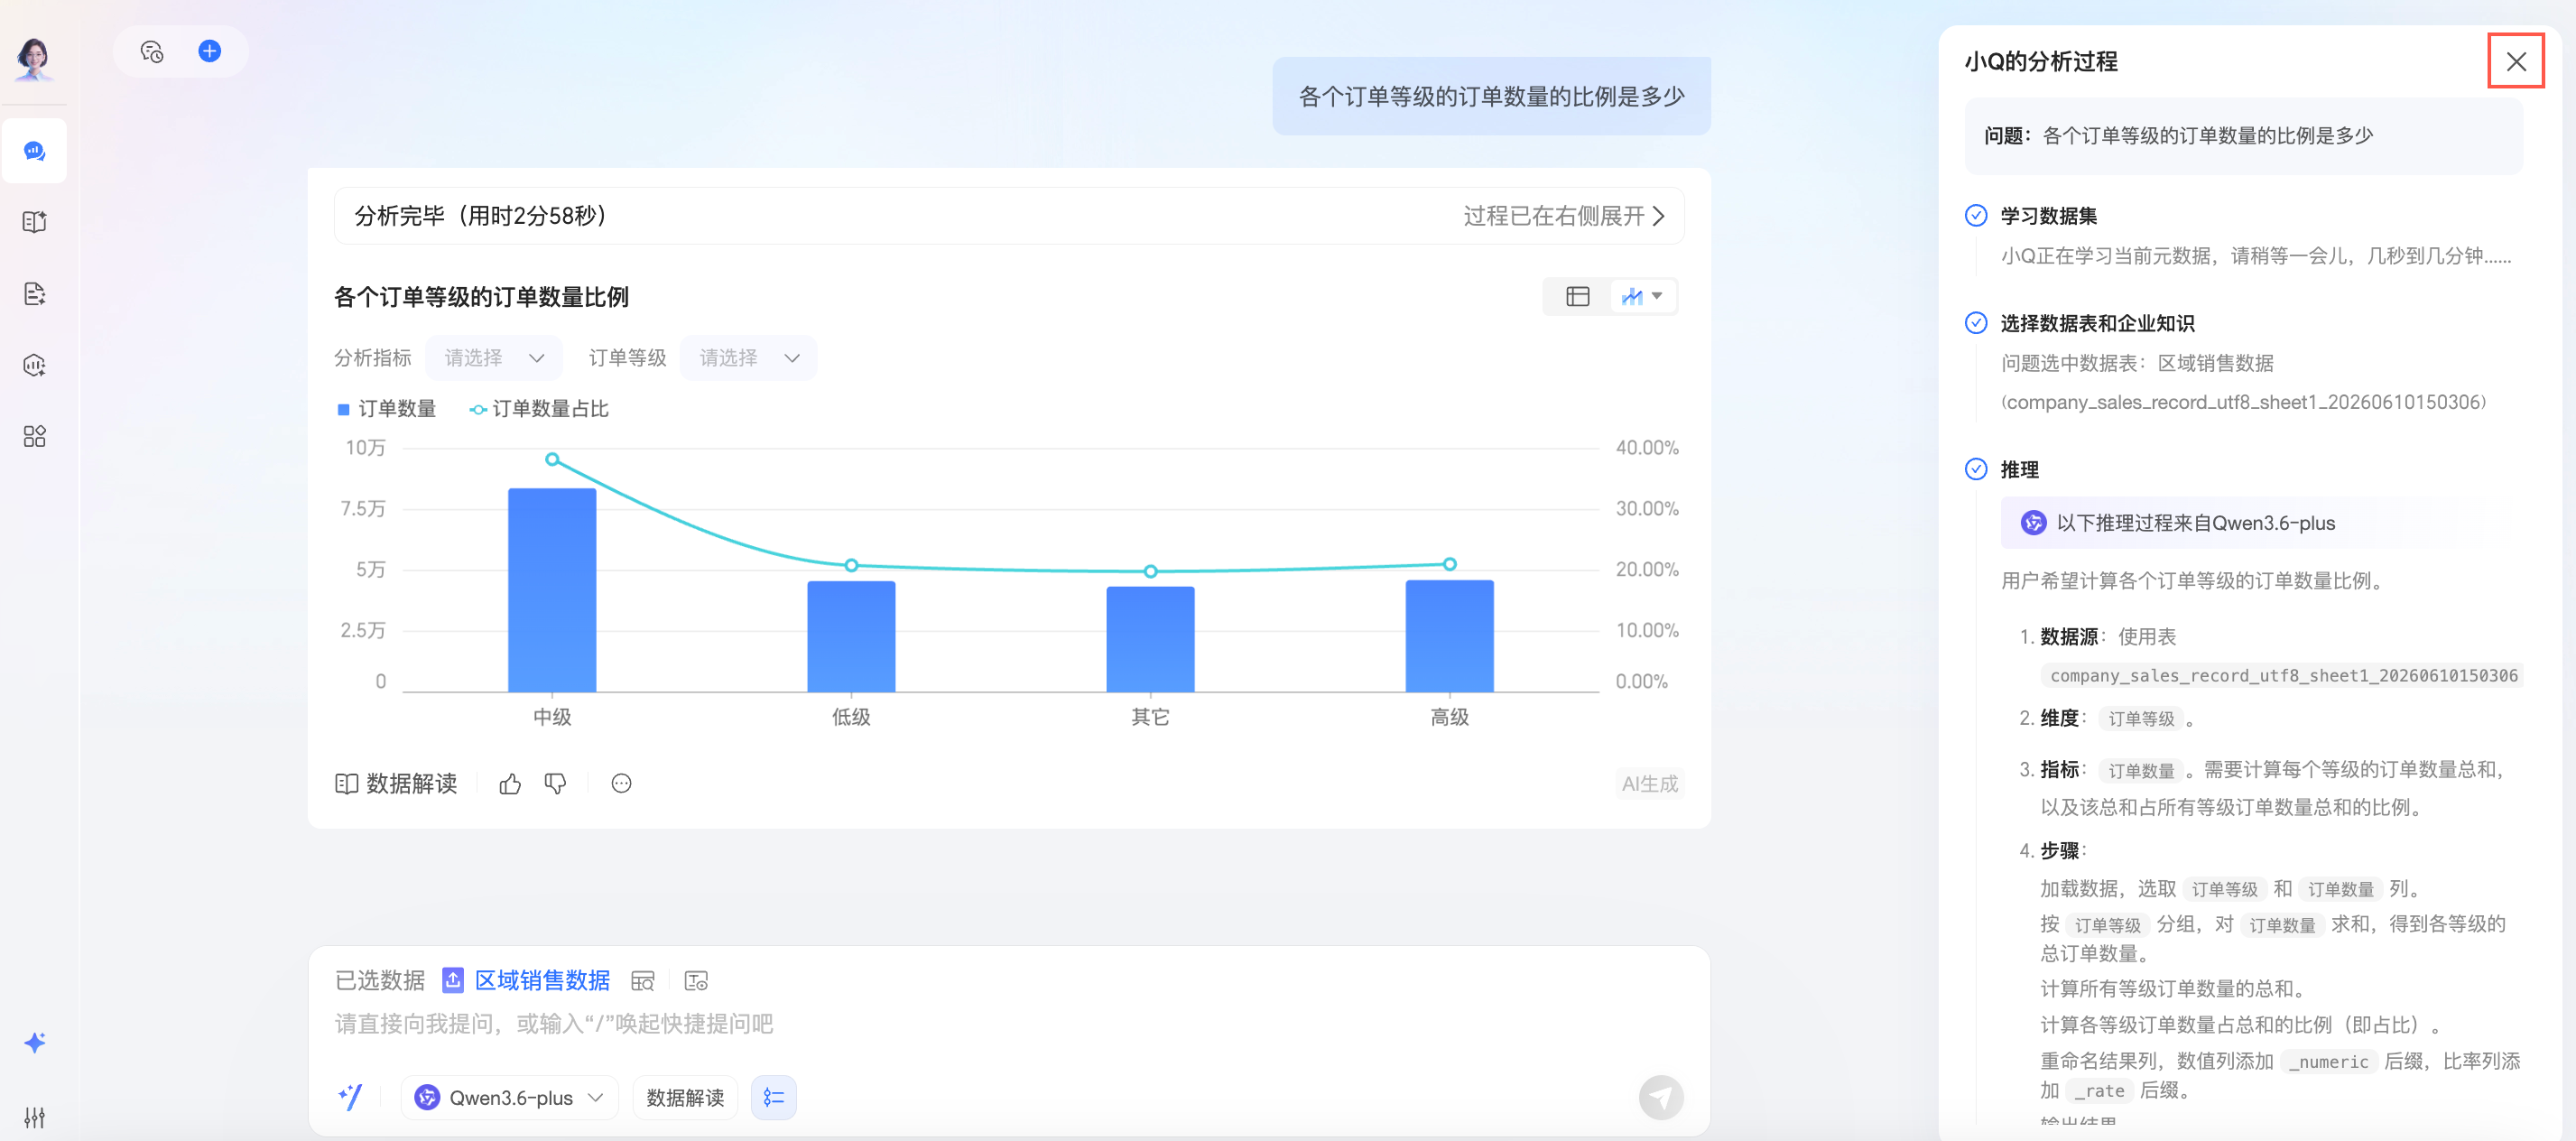
Question clarification
When enabled, Xiao Q asks a clarifying question for ambiguous queries, such as those missing a time or metric element or containing multiple possible metrics, to confirm the required information before providing a more accurate answer. For more information, see Enable Clarifying Questions.
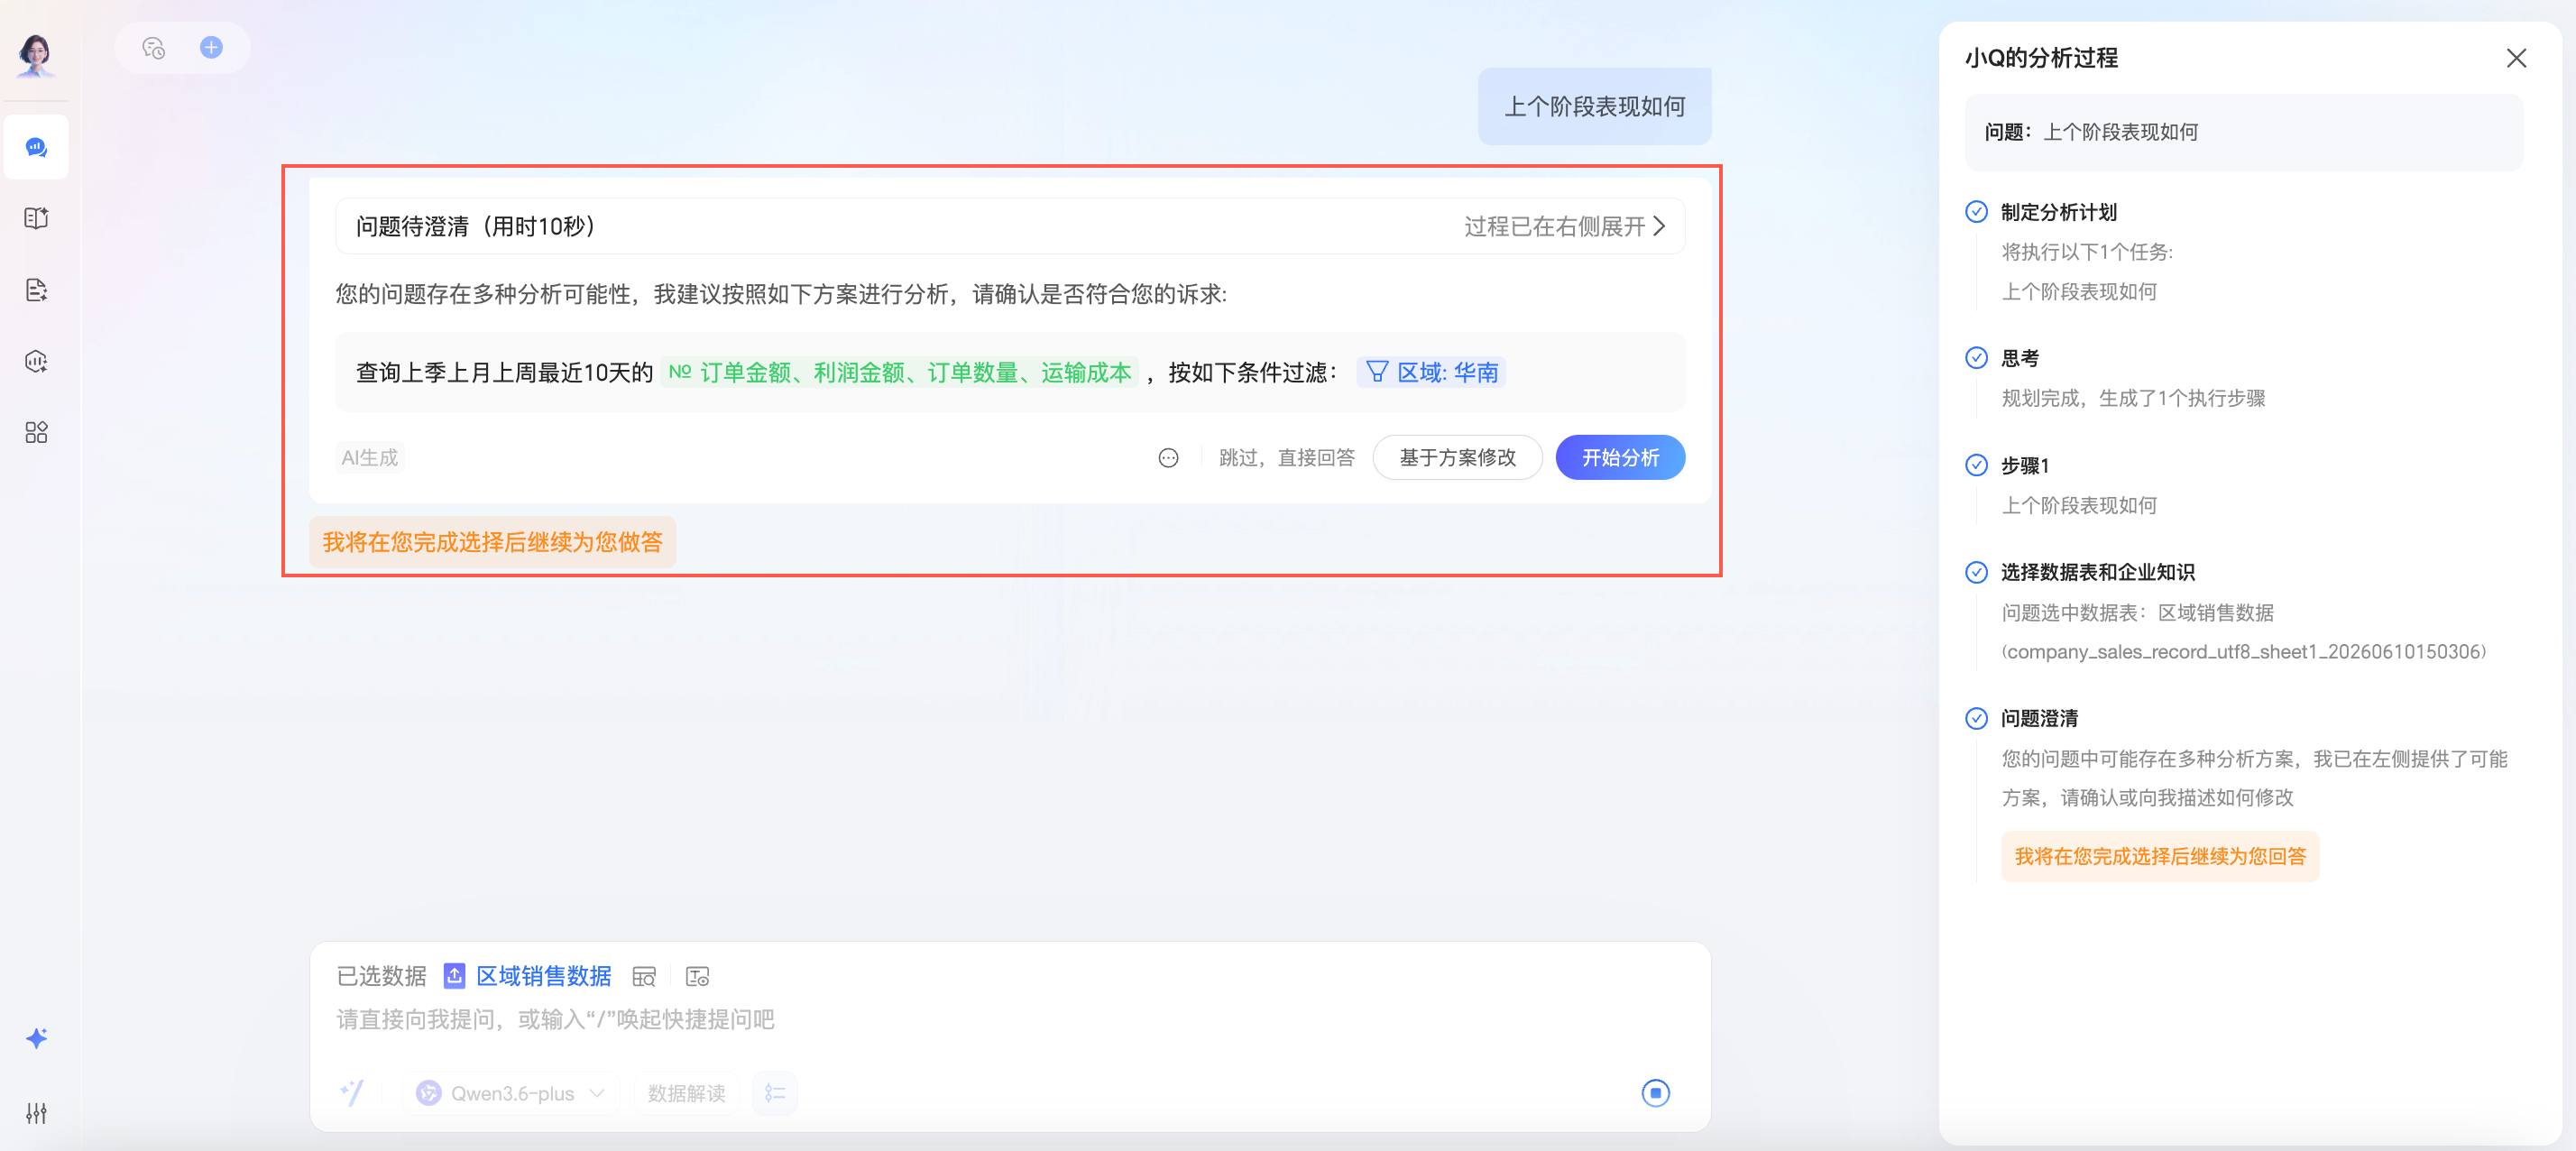
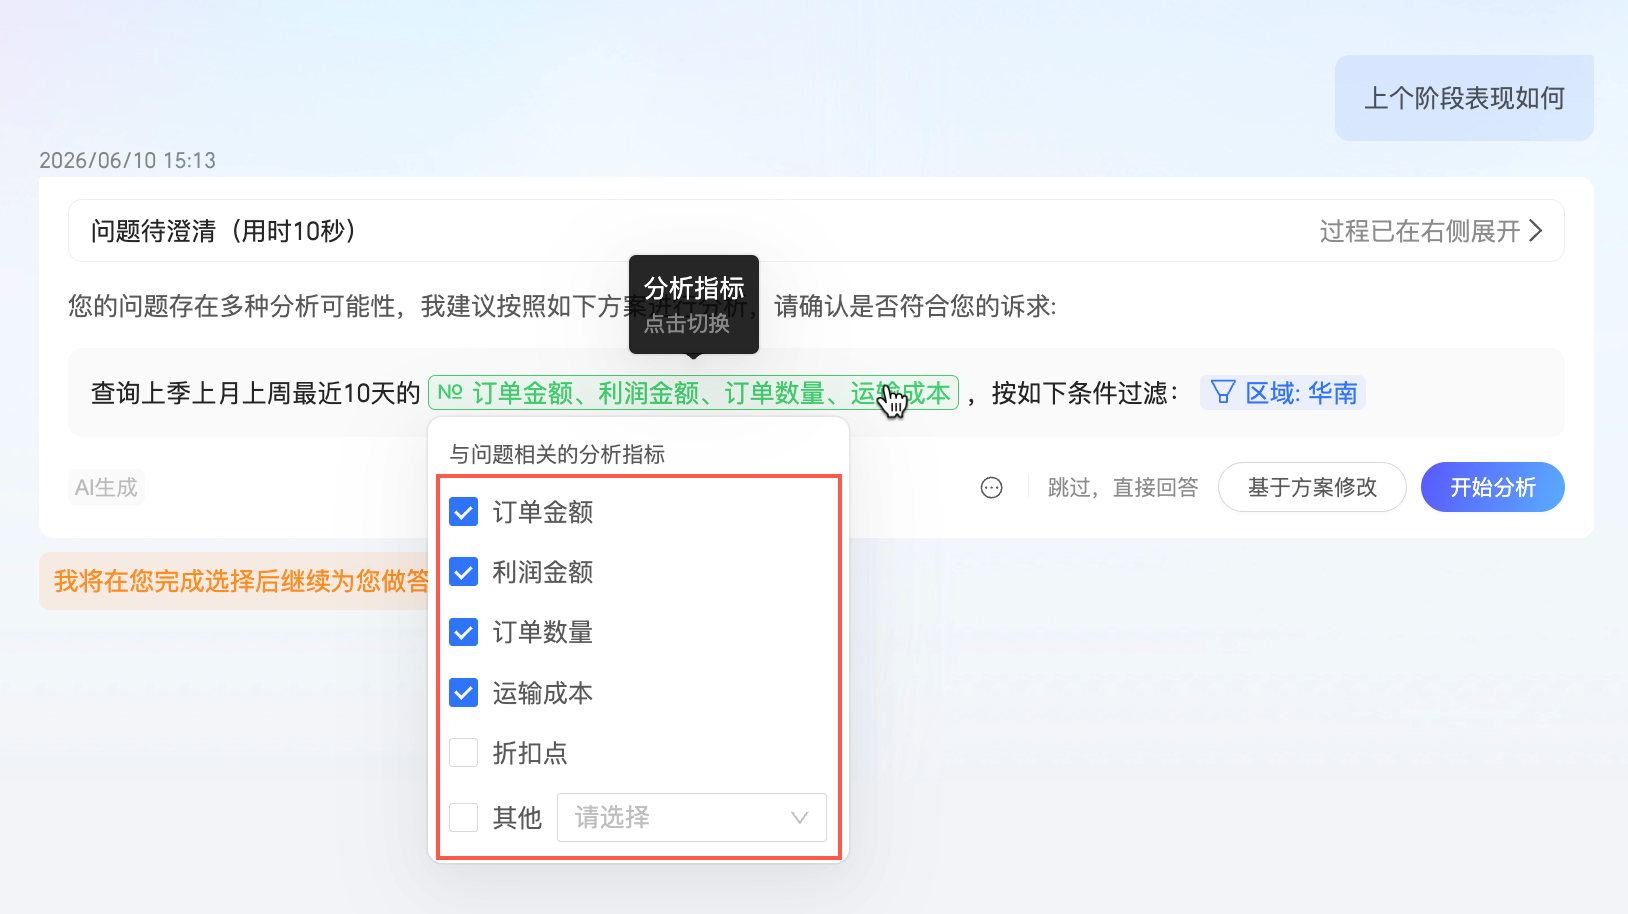
In the question clarification prompt, you can switch the time period and analysis metric, then click Start Analysis.
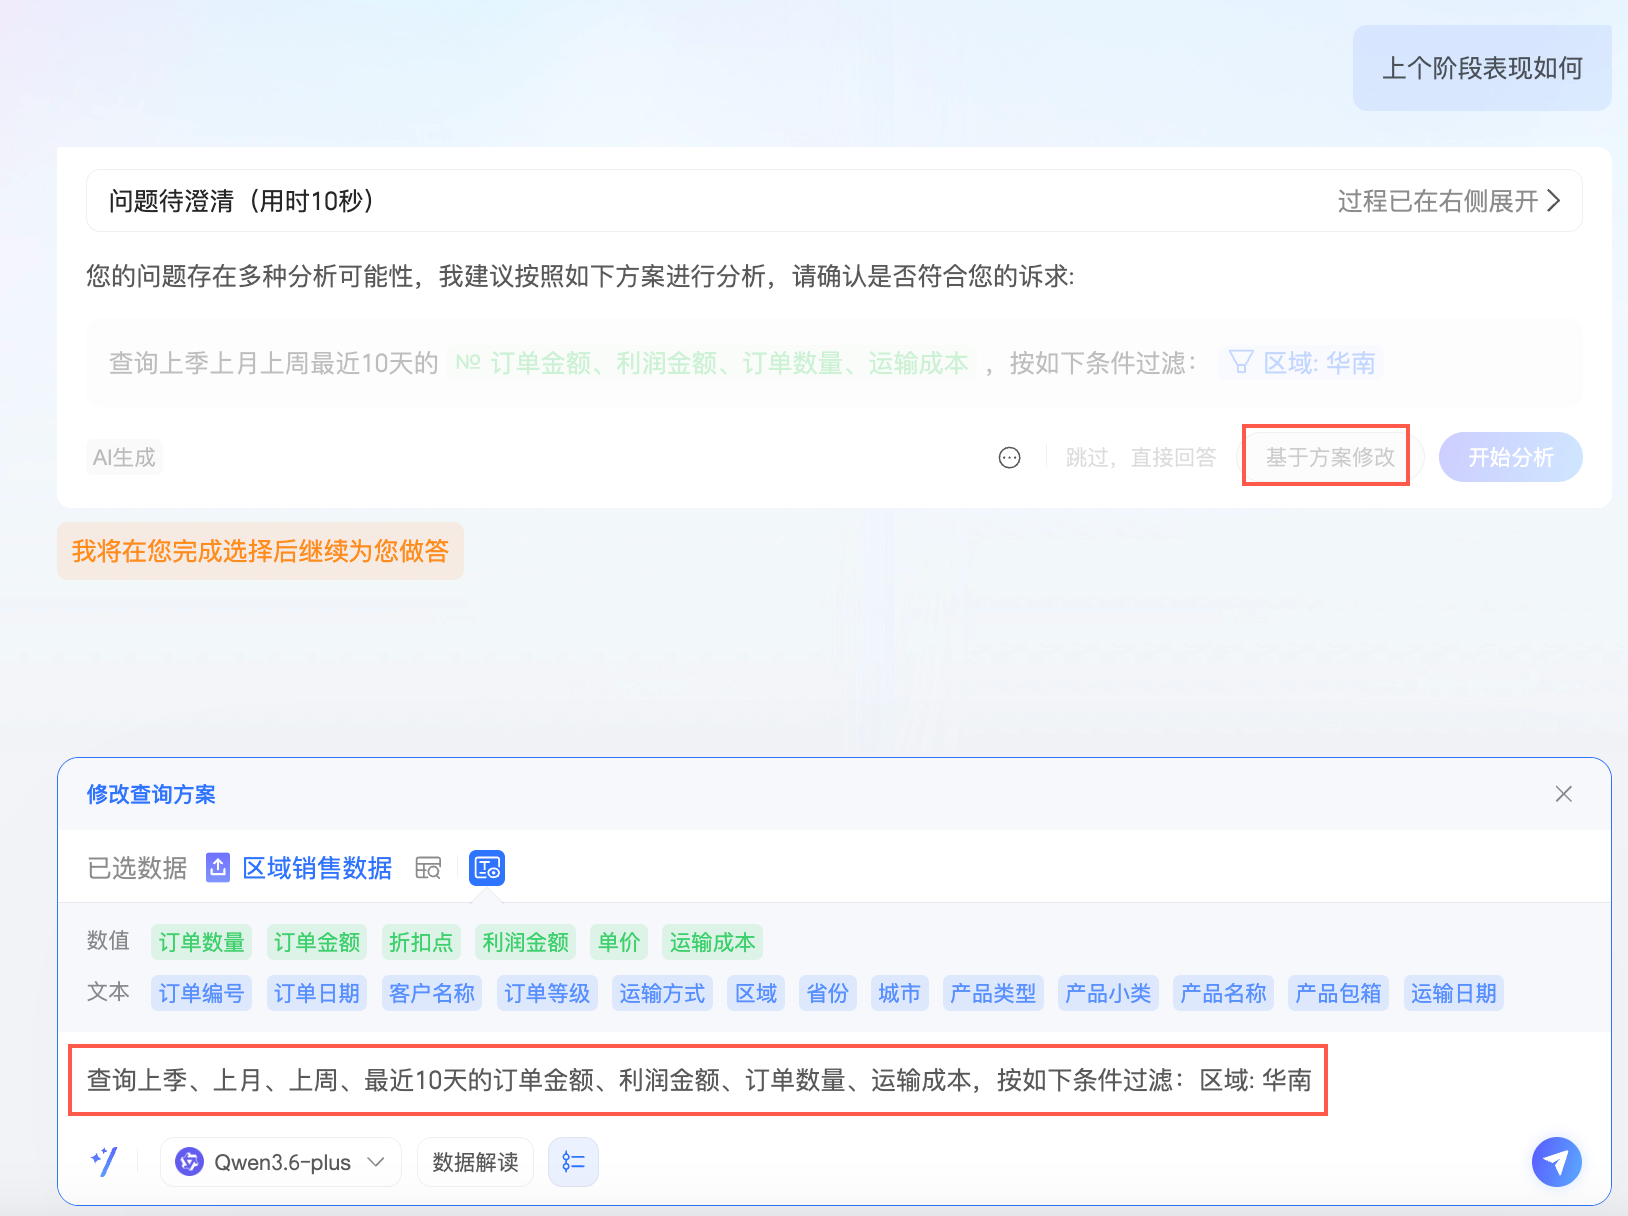
You can also choose to Modify Based on the Plan to refine the question.
Alternatively, you can select Skip, answer directly to bypass the clarification.
Favorite question
-
You can favorite up to 30 questions.
-
This feature is not available for questions asked using an uploaded data file.
-
Click the
icon to the left of a question to favorite the question.After you favorite a question, you can access it from Quick Questions.
If no dataset is selected, you can click a favorited question to ask it directly.
-
Click the
icon again to remove the question from your favorites.
 icon to the left of a question to favorite the question.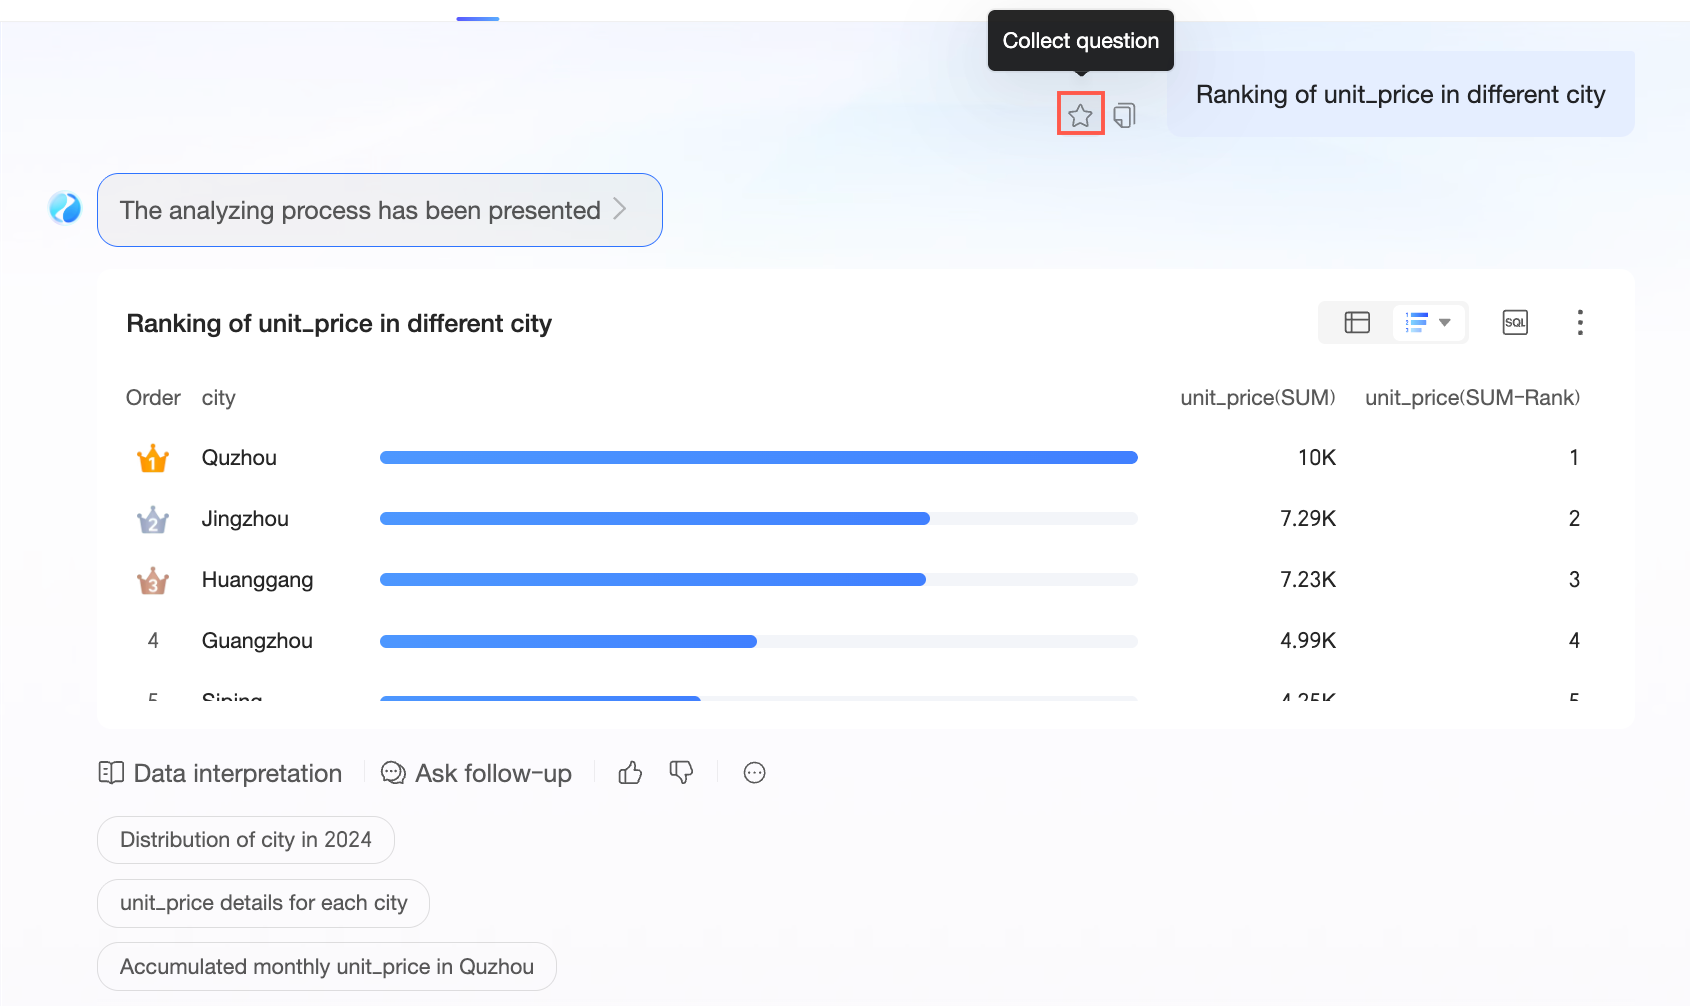
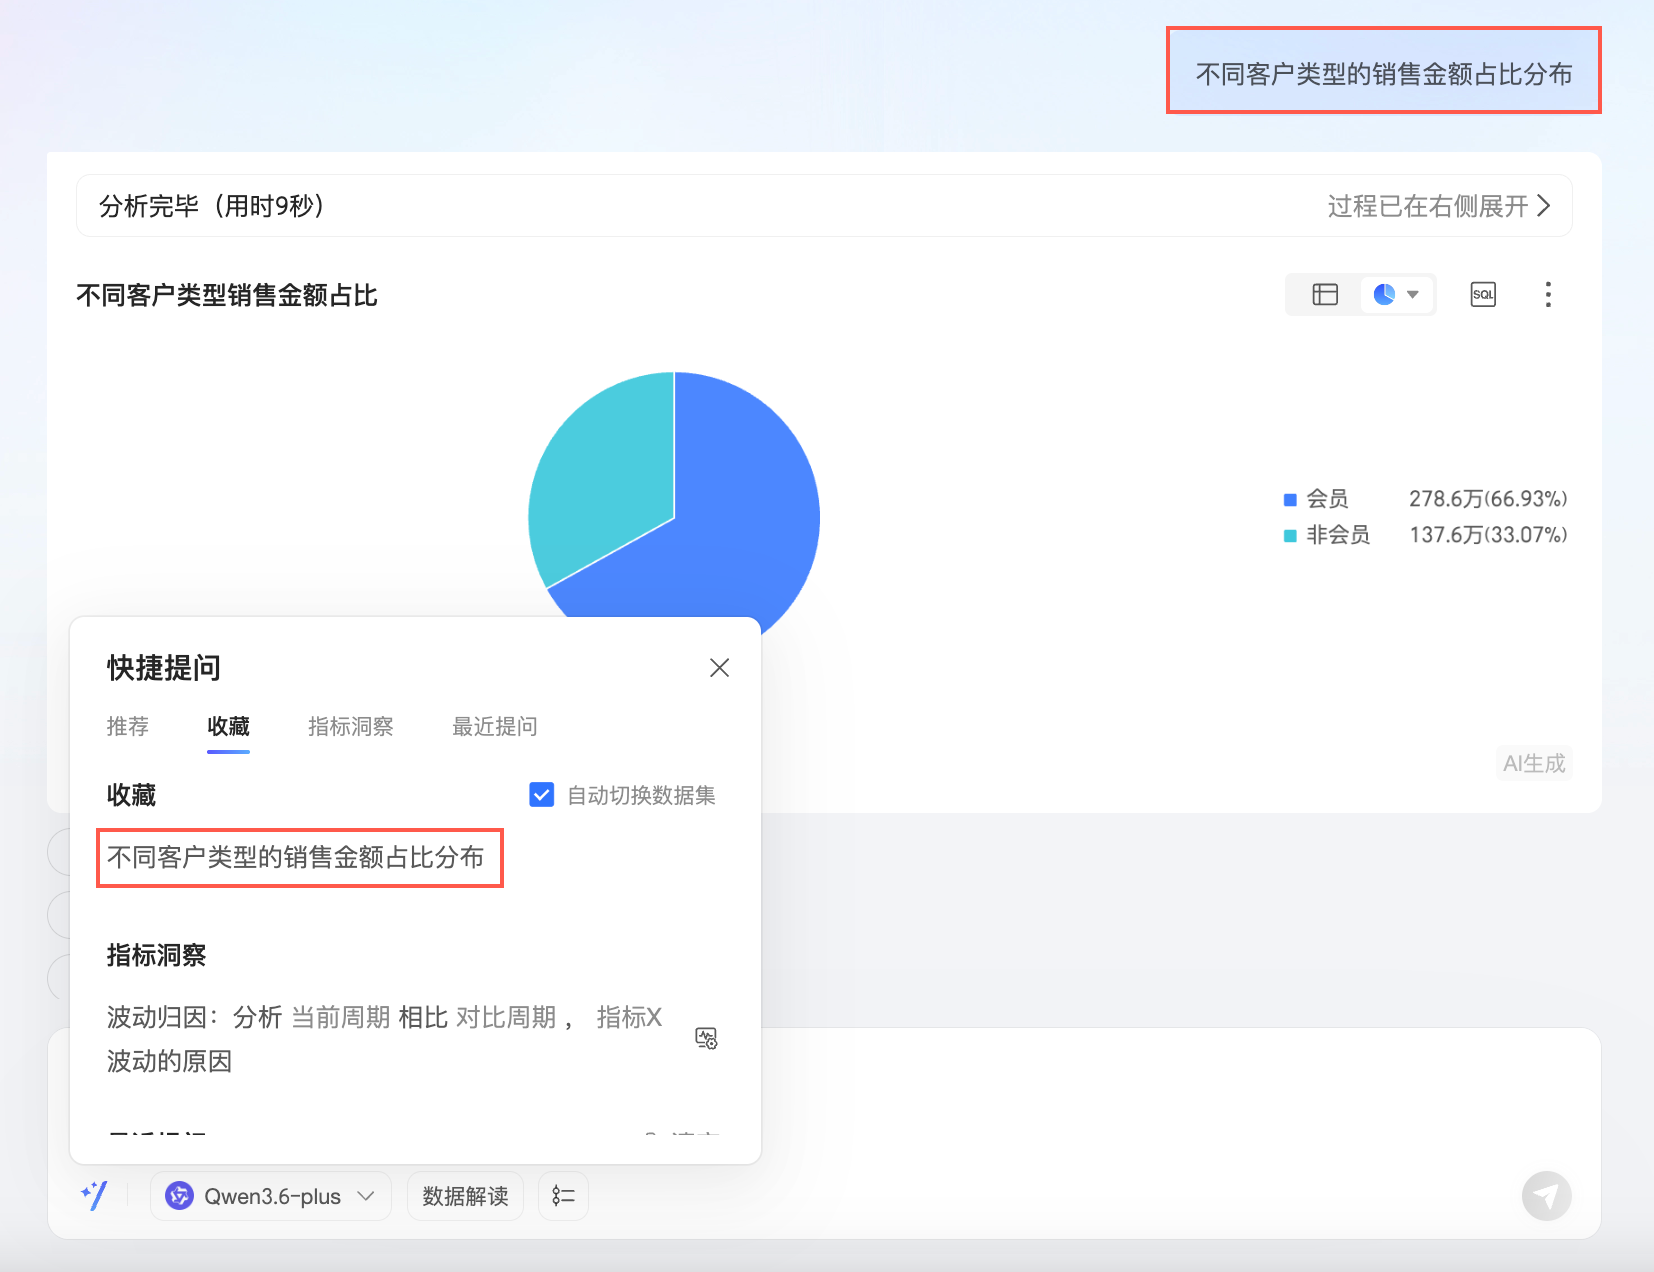
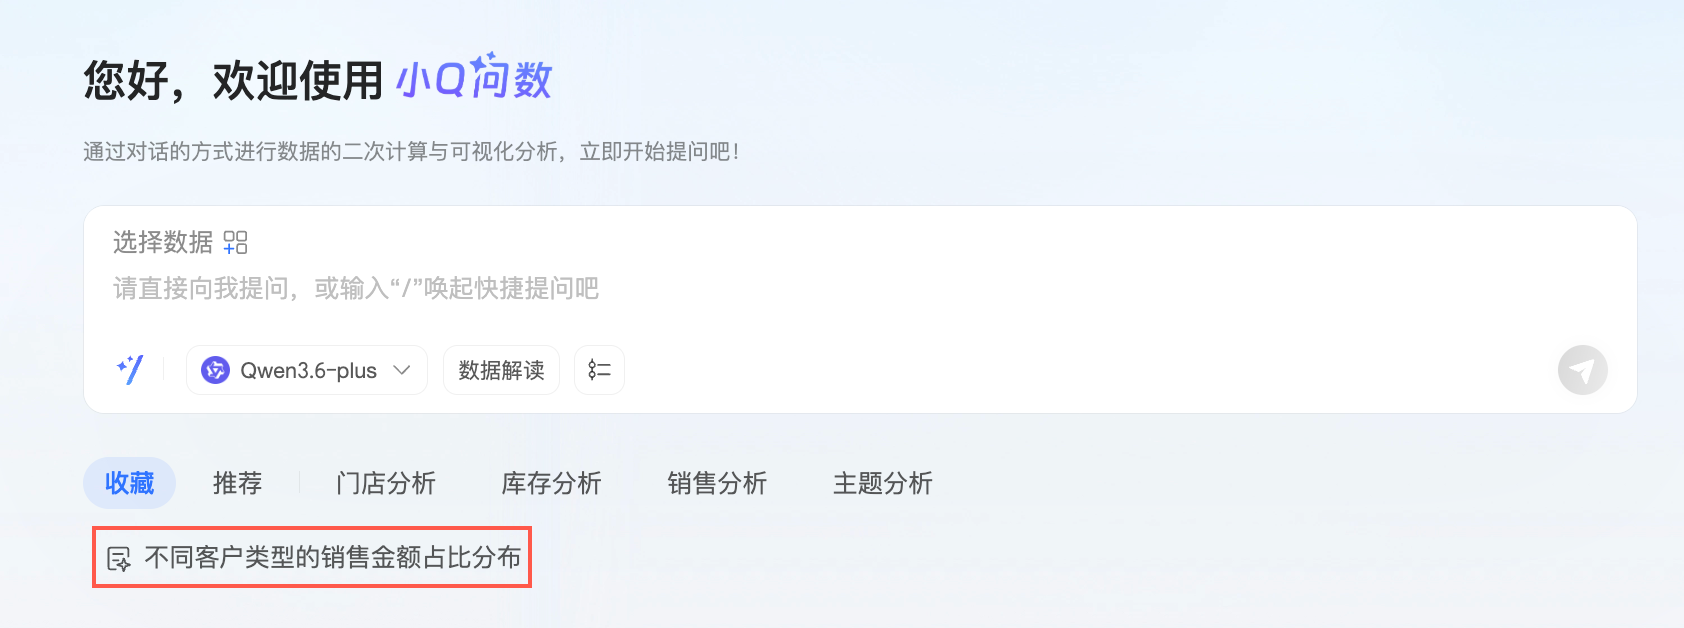
 icon again to remove the question from your favorites.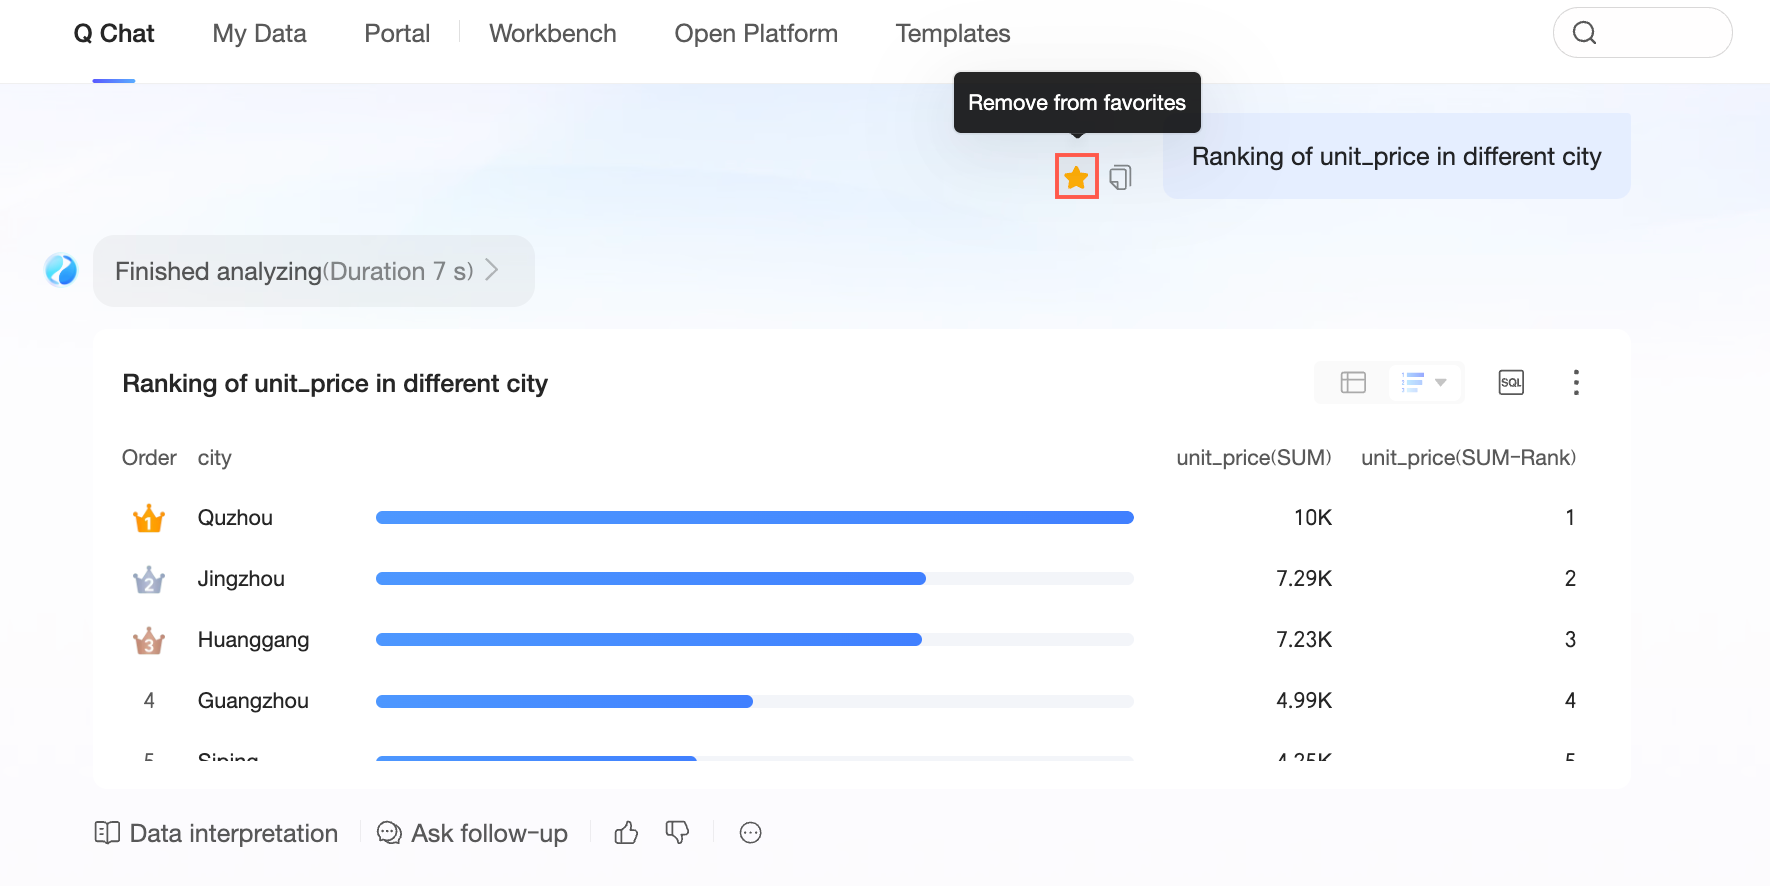
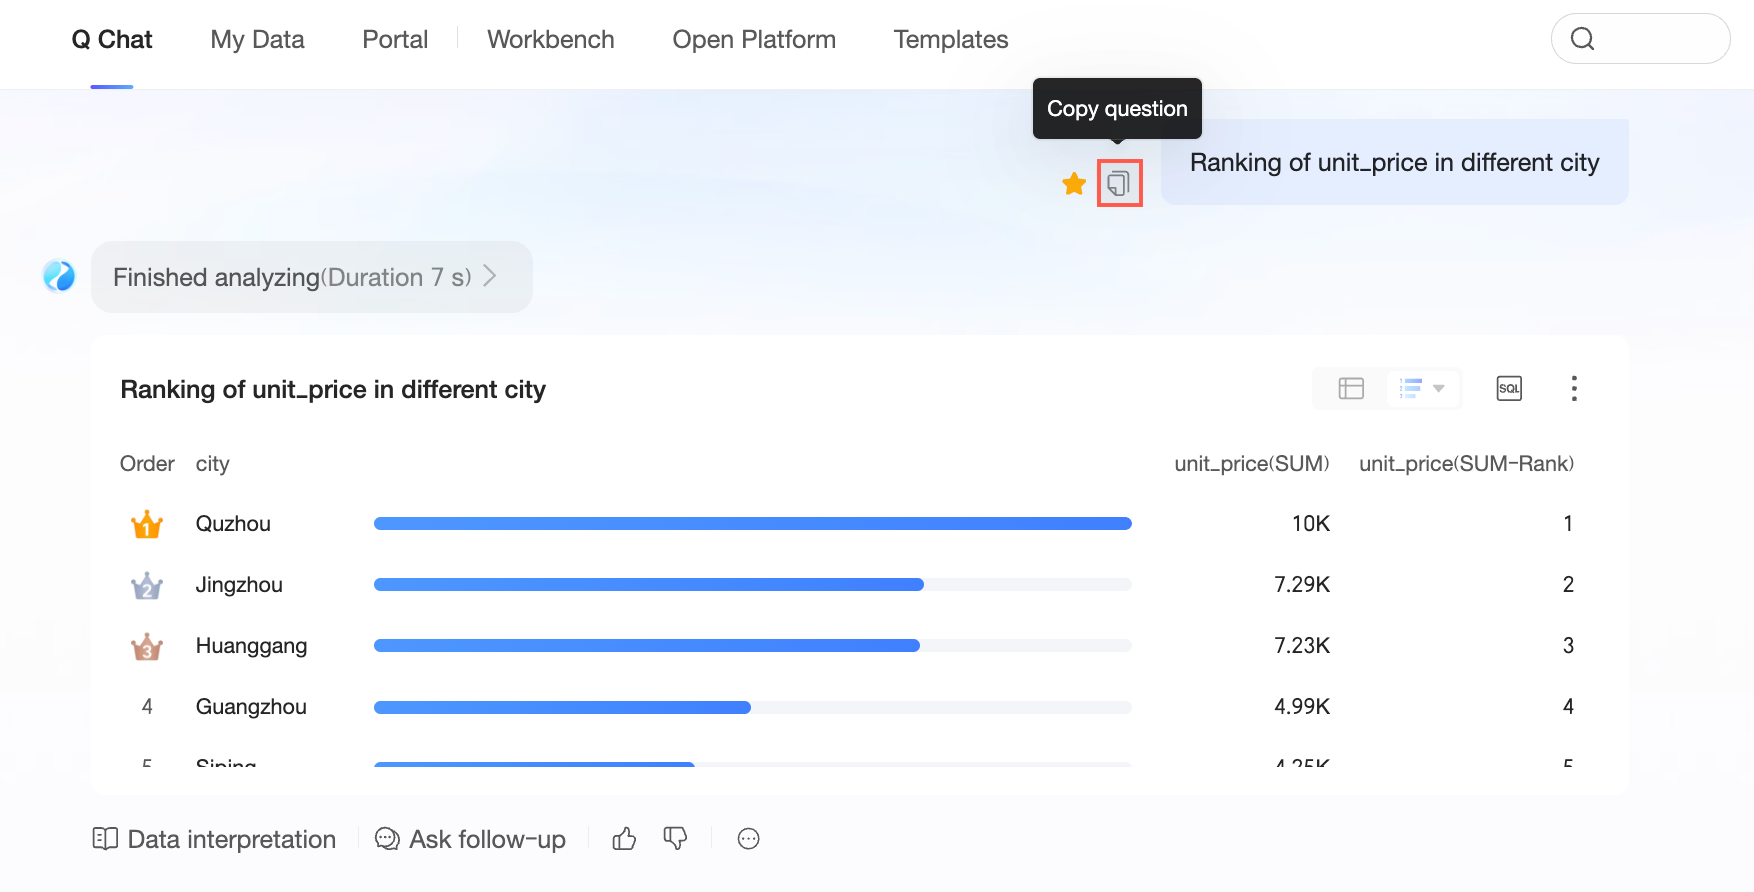
Copy question
Click the  icon to the left of a question to copy the question.
Quick questions
-
You can click the
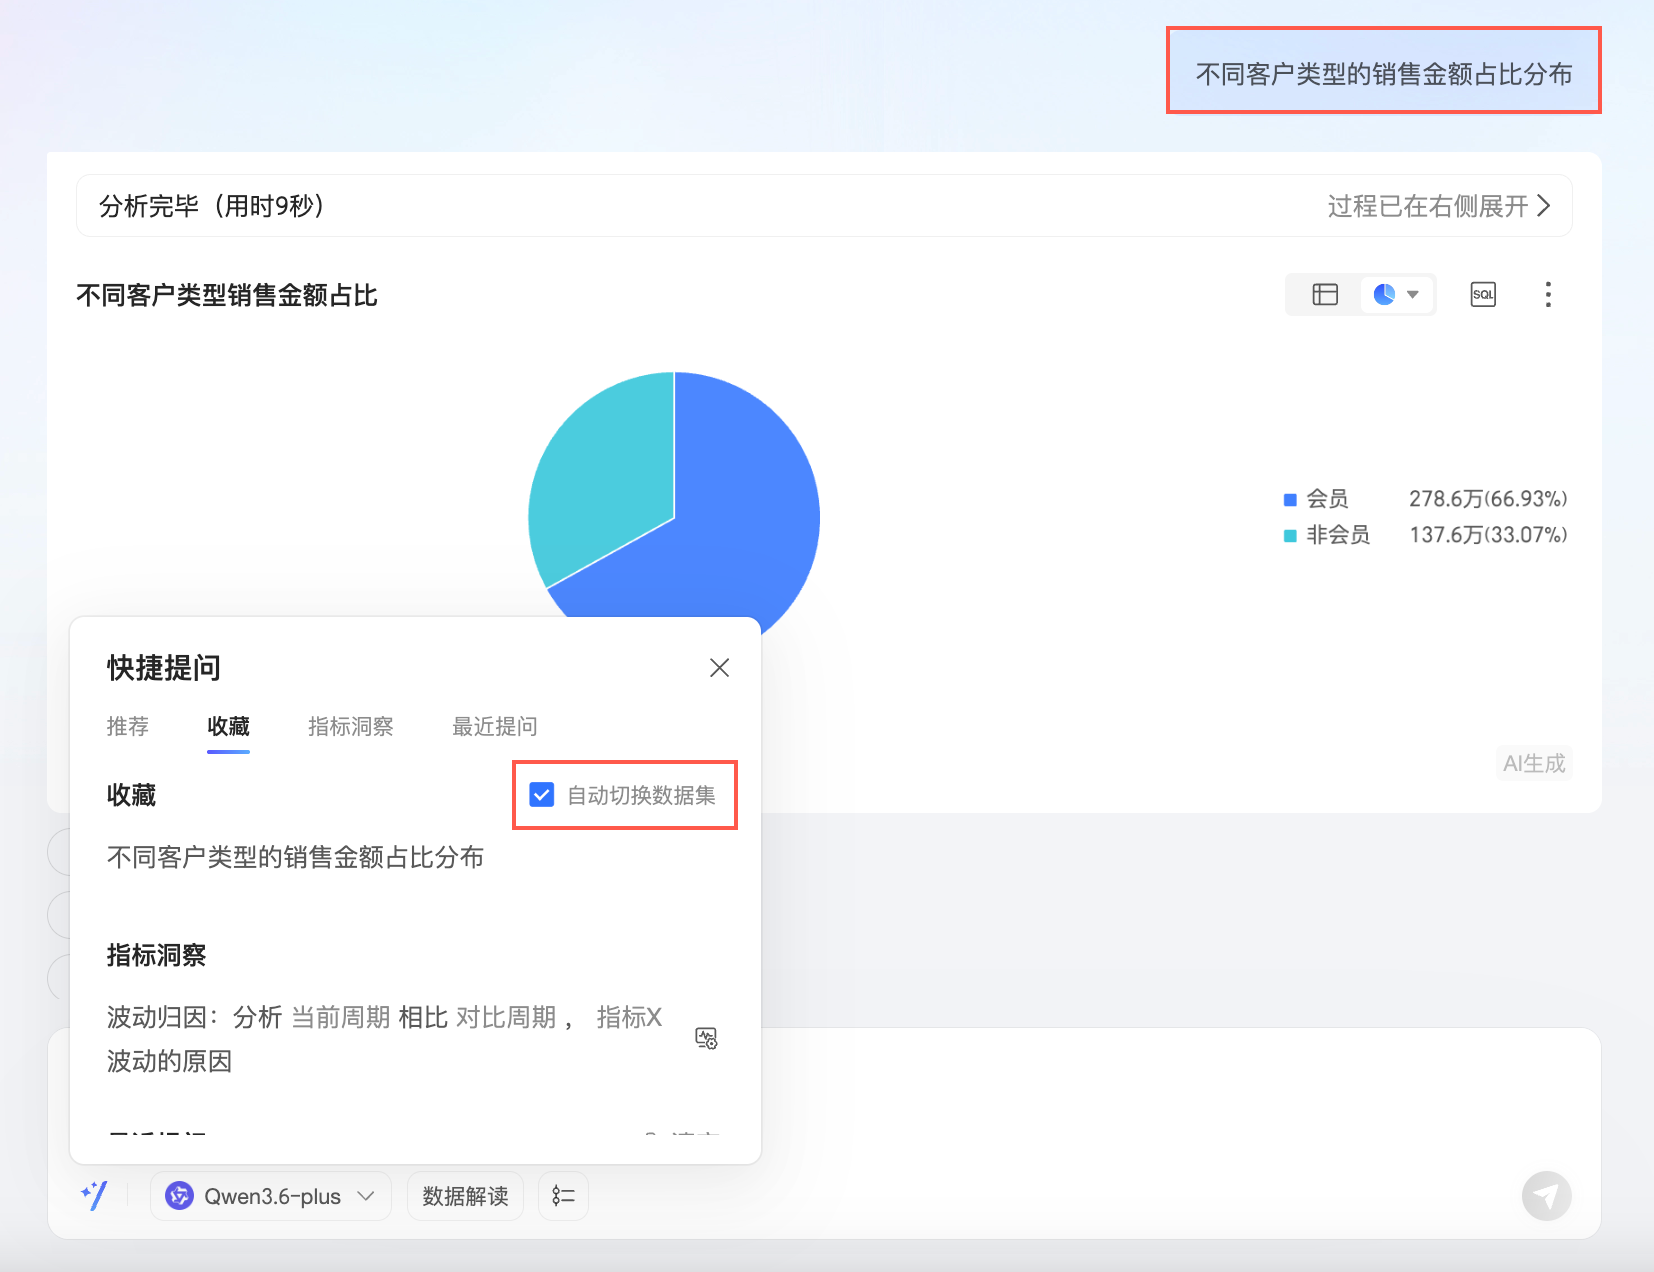
icon in the lower-left corner of the question box to access the Quick Questions panel. From there, you can ask questions from the Recommended, Favorites, or Recently used tabs.For questions in your Favorites, you can select Automatically switch datasets. This option is enabled by default. When enabled, clicking a favorited question switches to its associated dataset before asking. If disabled, the question is asked against the currently selected dataset.
-
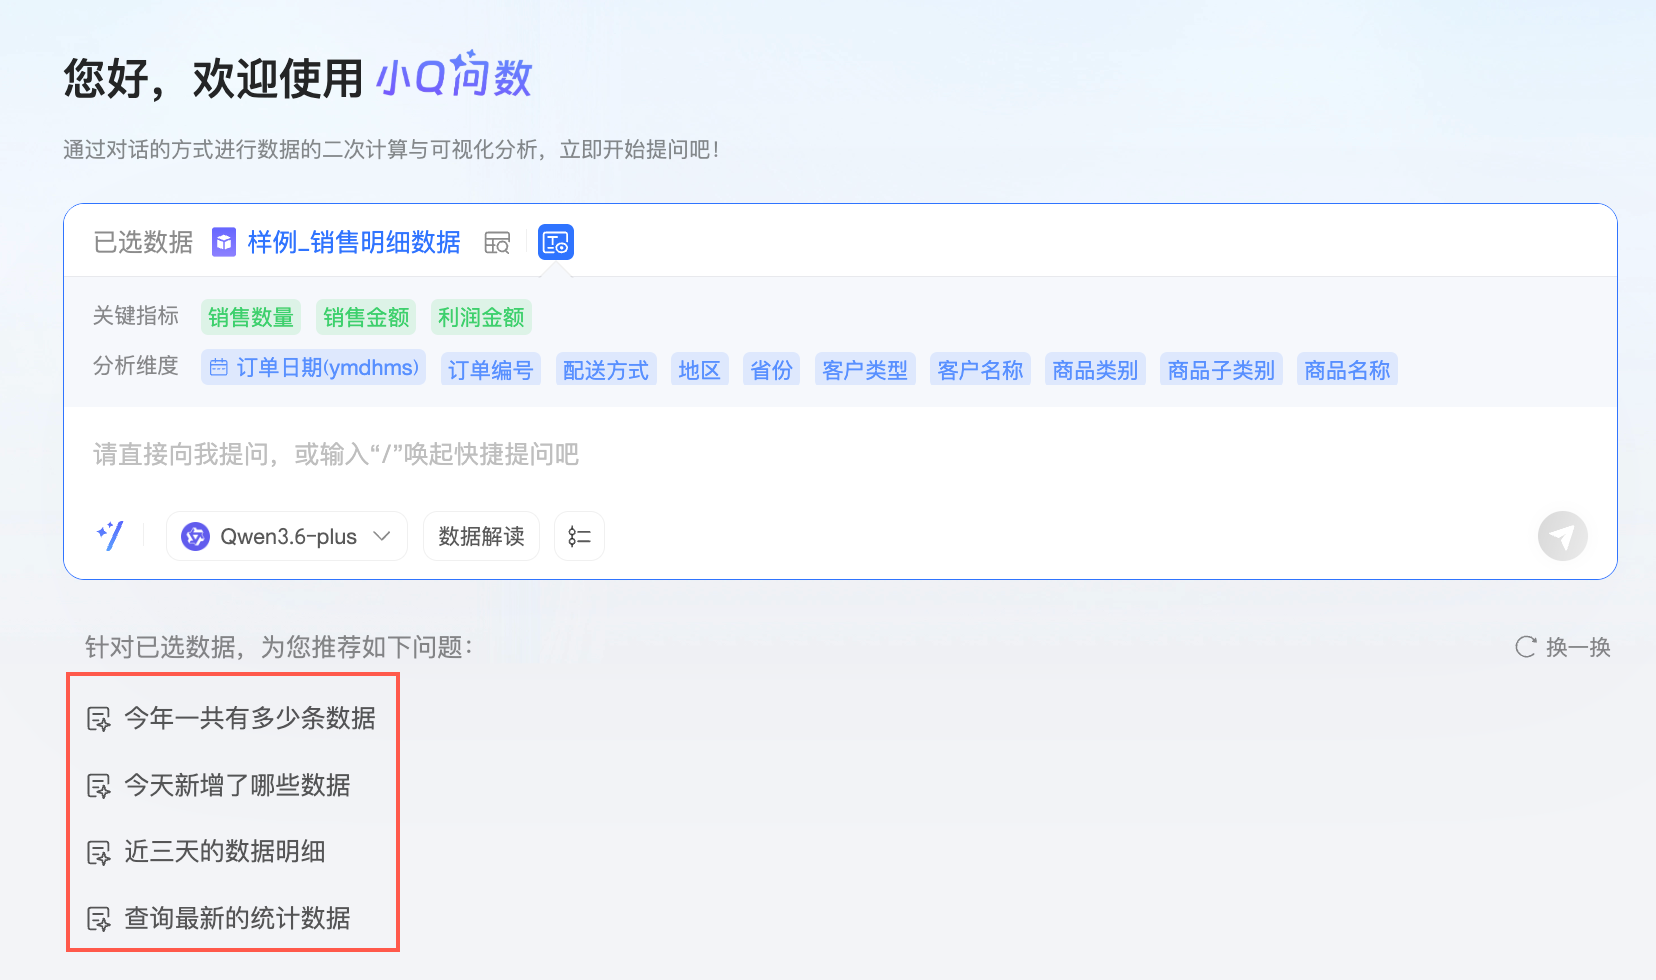
You can also click a recommended question directly below the question box.
Click the
icon to refresh the list of recommended questions. -
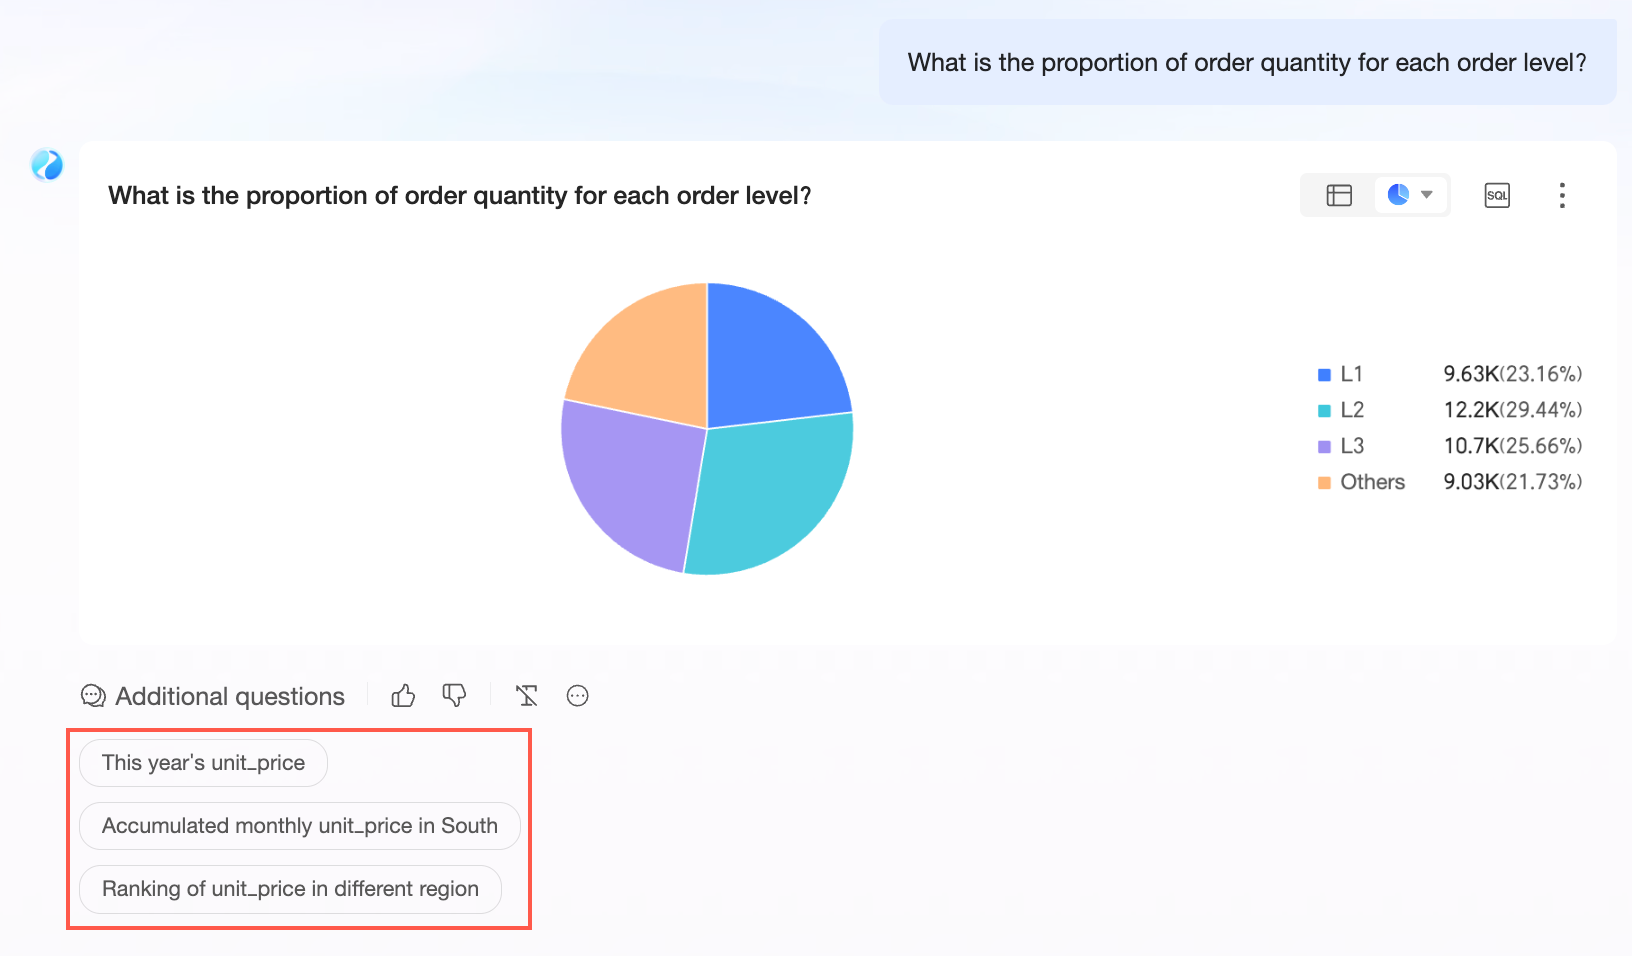
After each conversational turn, you can also select one of the three recommended questions below the chart to continue your analysis.
 icon in the lower-left corner of the question box to access the Quick Questions panel. From there, you can ask questions from the Recommended, Favorites, or Recently used tabs.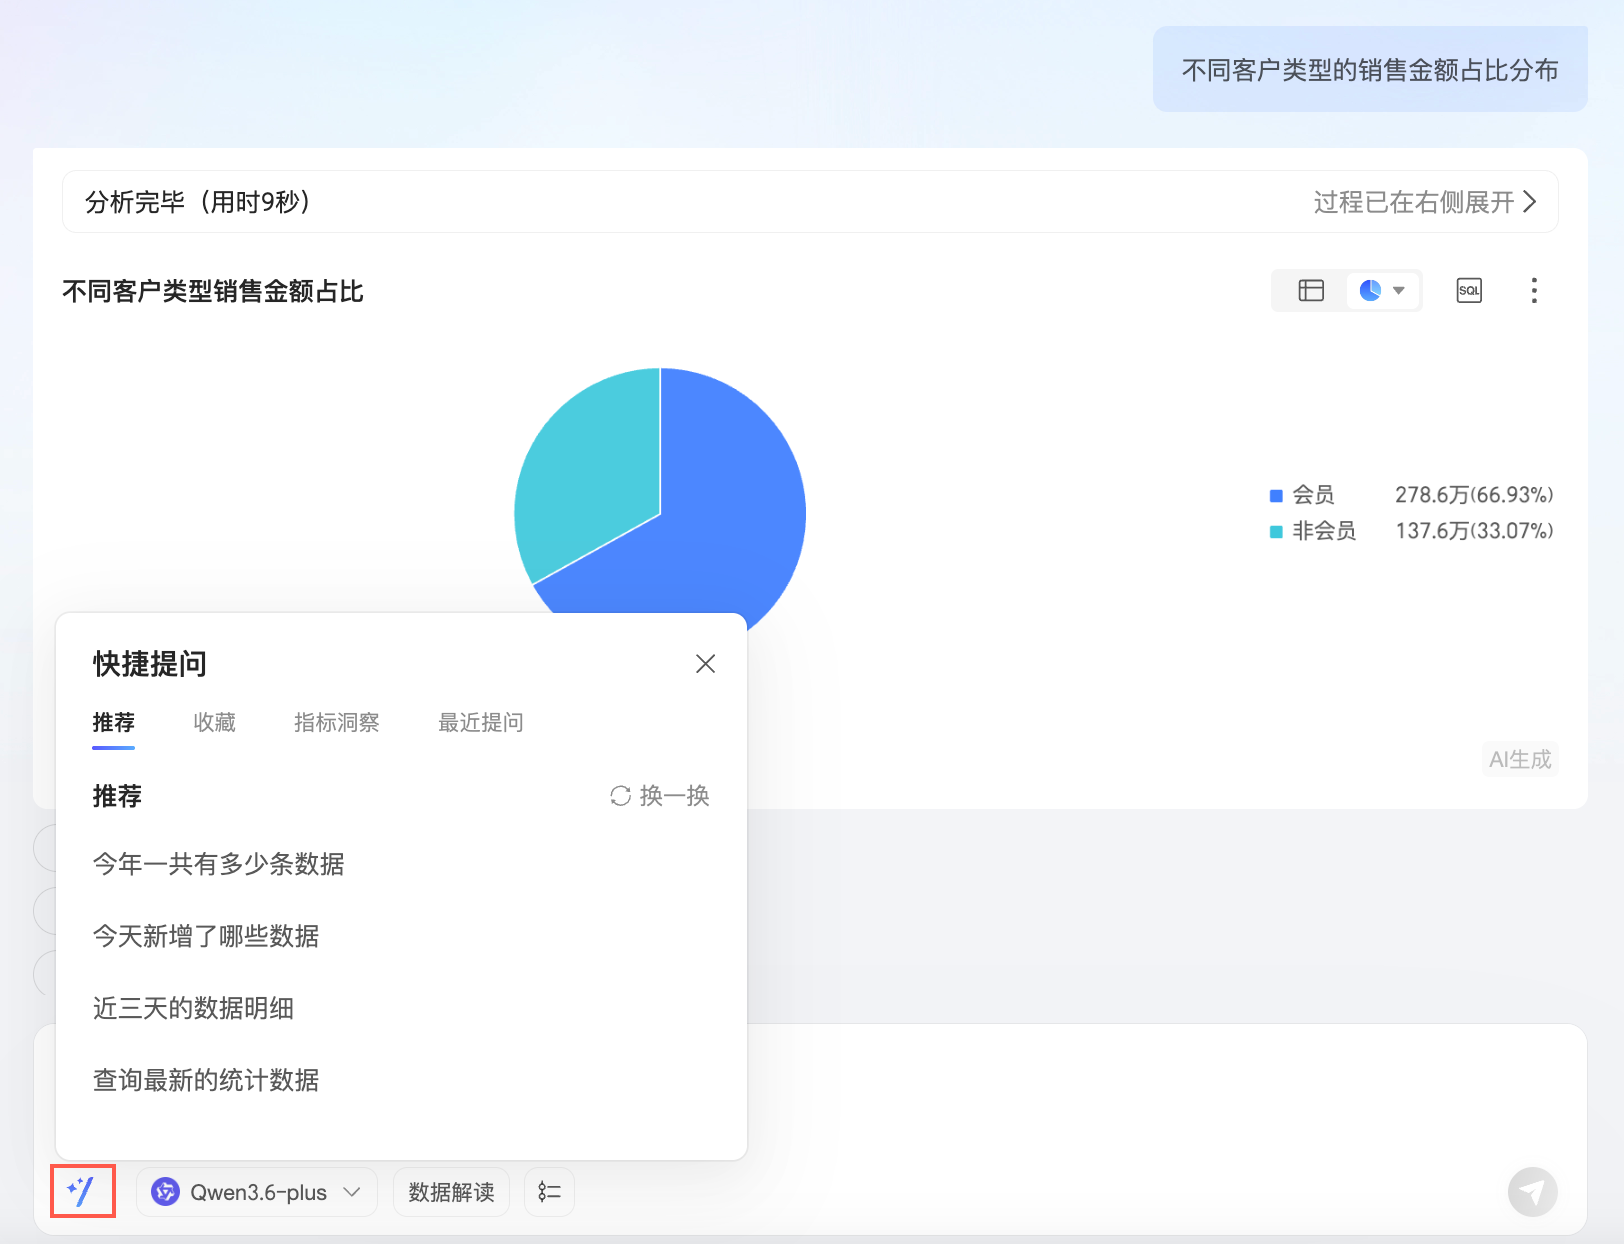
 icon to refresh the list of recommended questions.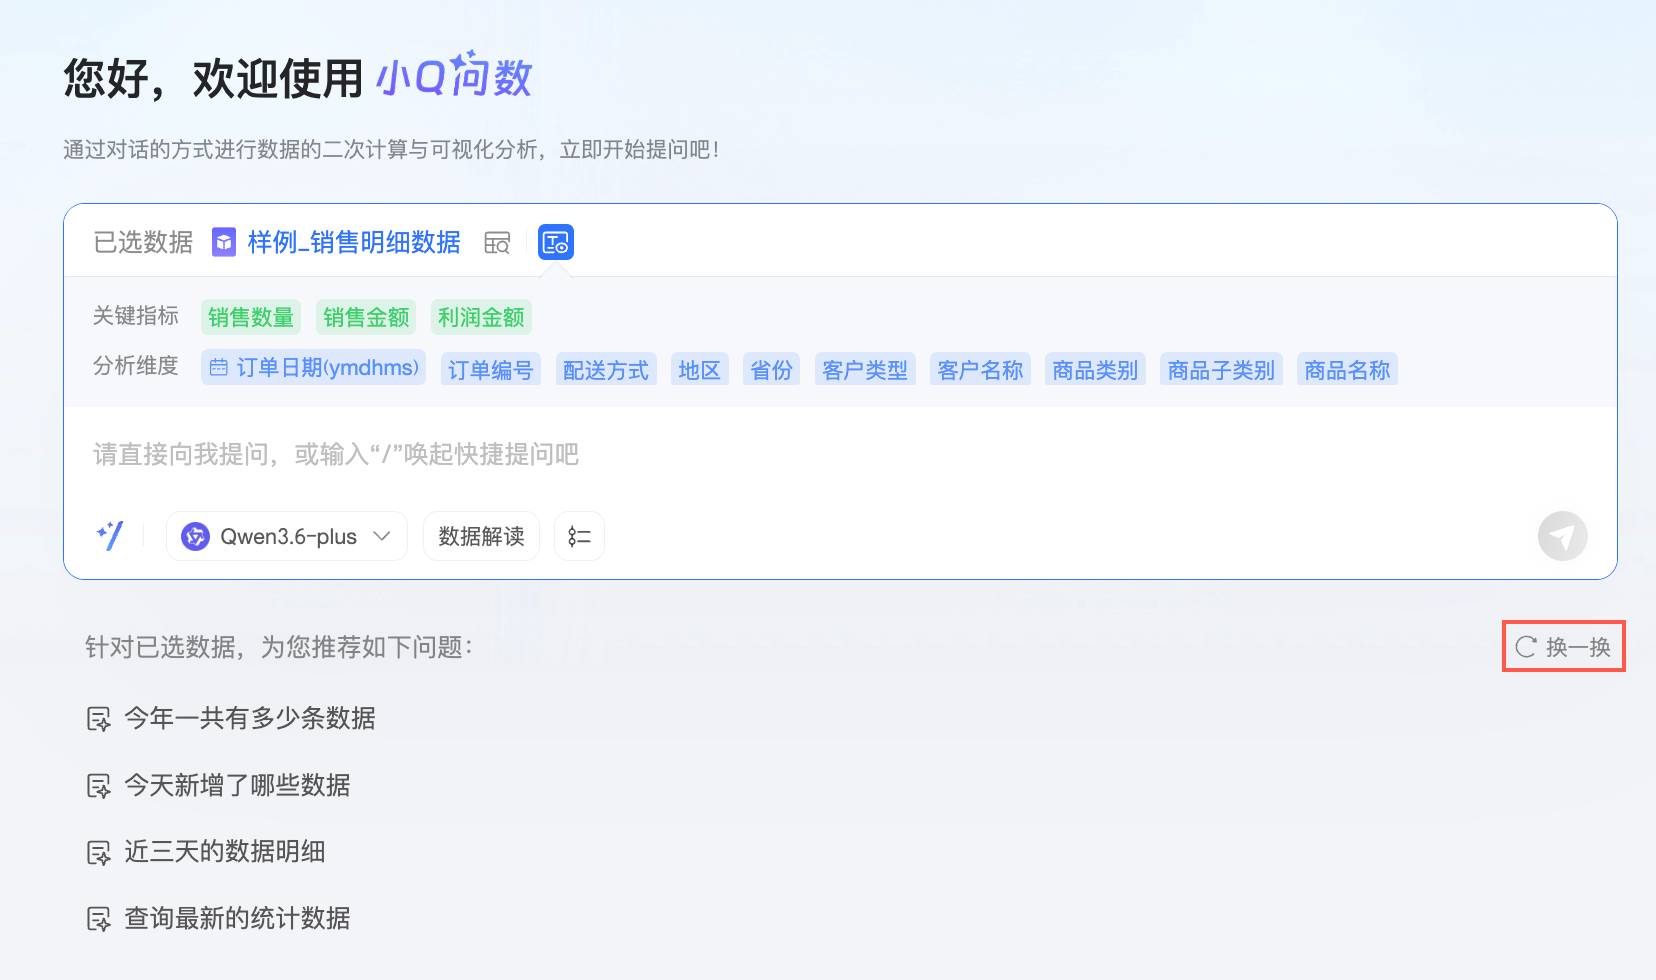
Voice input
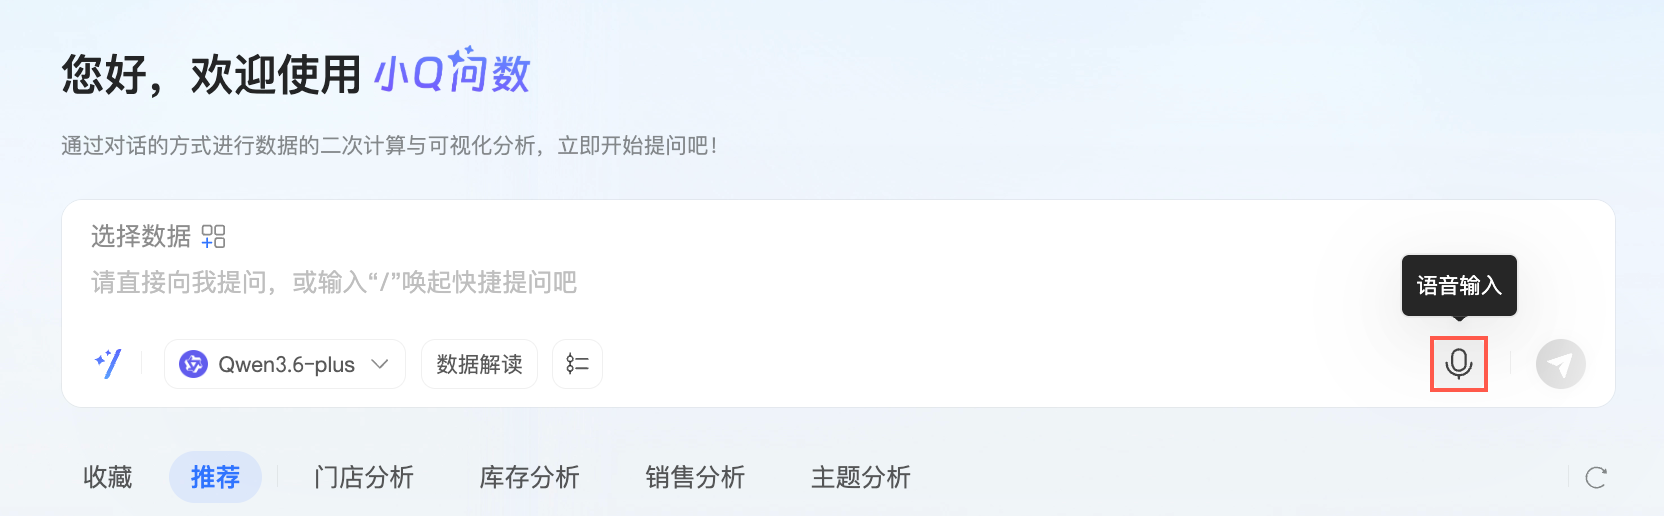
After enabling the voice Q&A switch, you can ask questions using voice input.

-
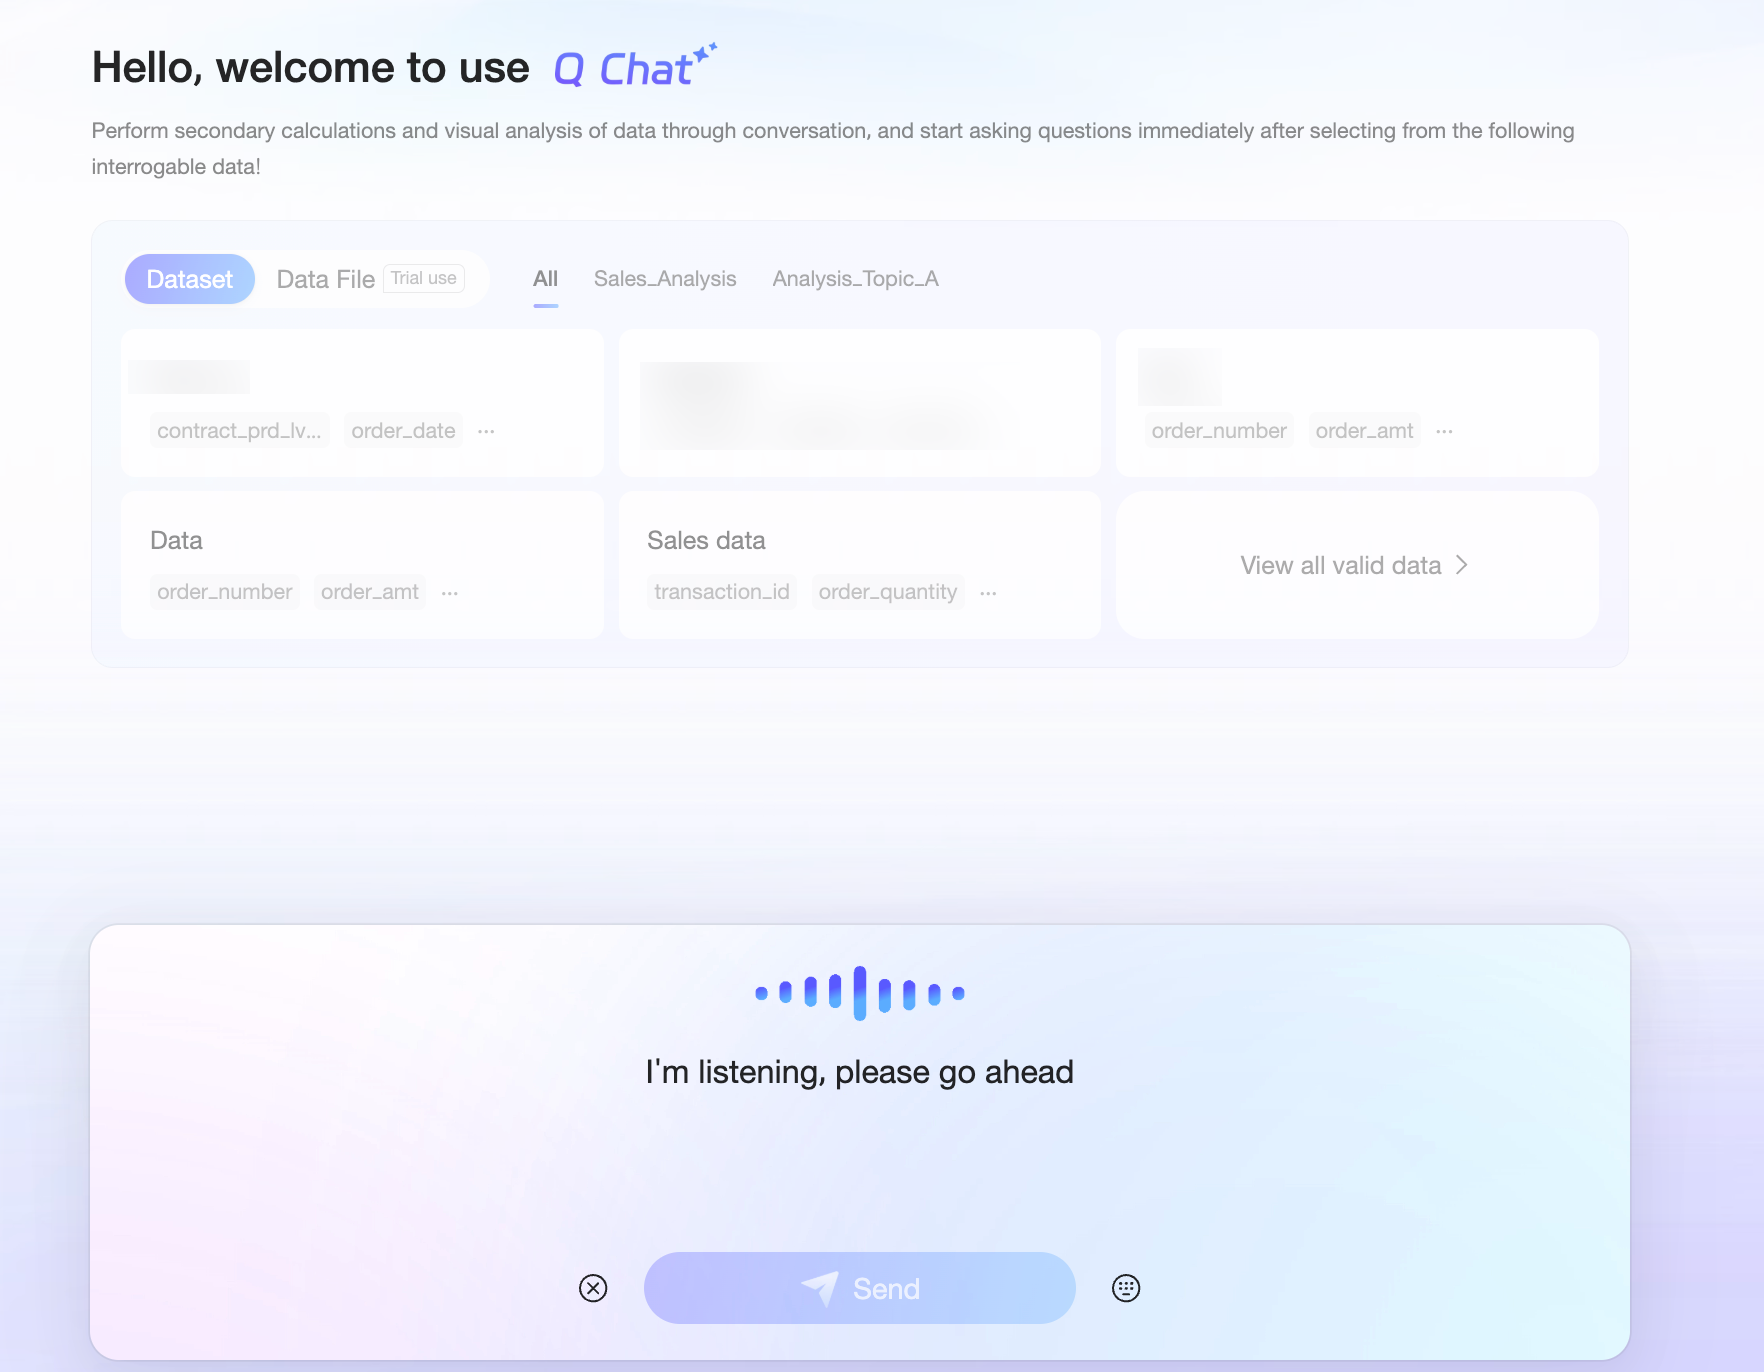
Click the Voice Input icon to open the voice conversation interface.
-
In the voice conversation interface, ask your question.
-
The system transcribes your voice into text.
You can click the
icon on the left to cancel the input or click the icon on the right to switch to typing. -
Click Send or press Enter. The system returns a data analysis result.
 icon on the left to
  icon on the right to switch to typing.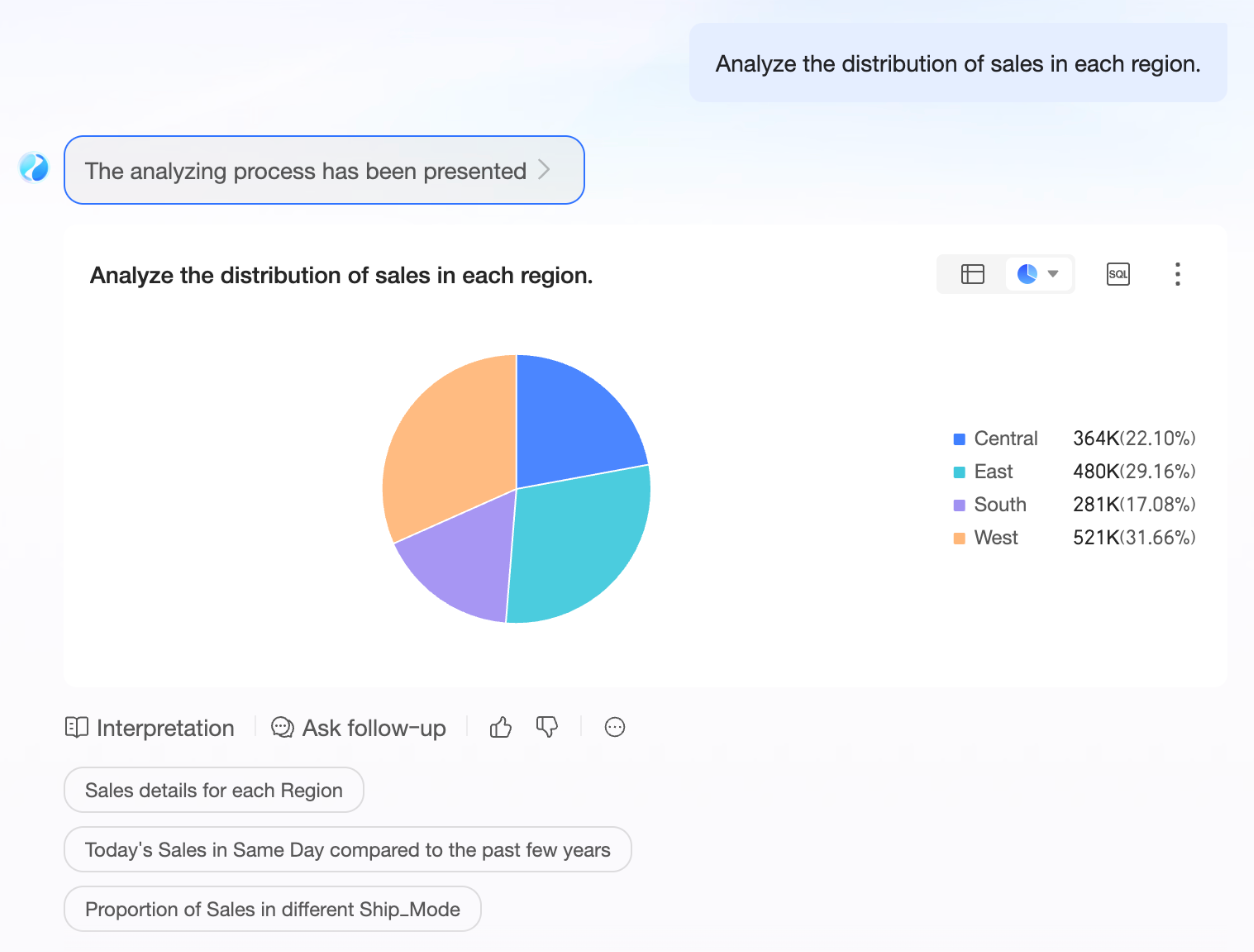
View results
The following features are available when viewing data results.
-
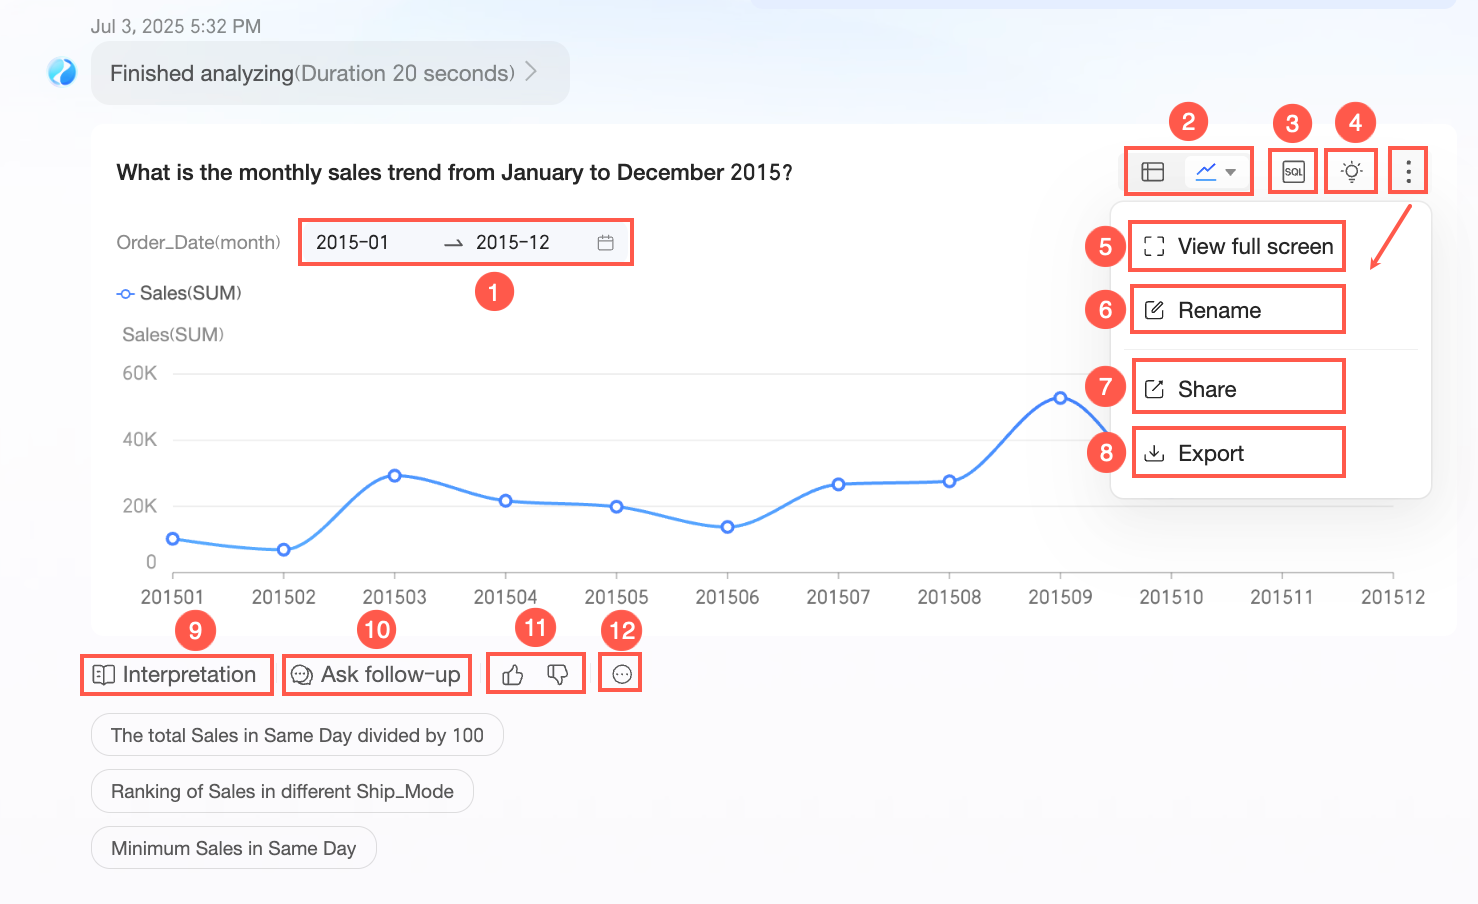
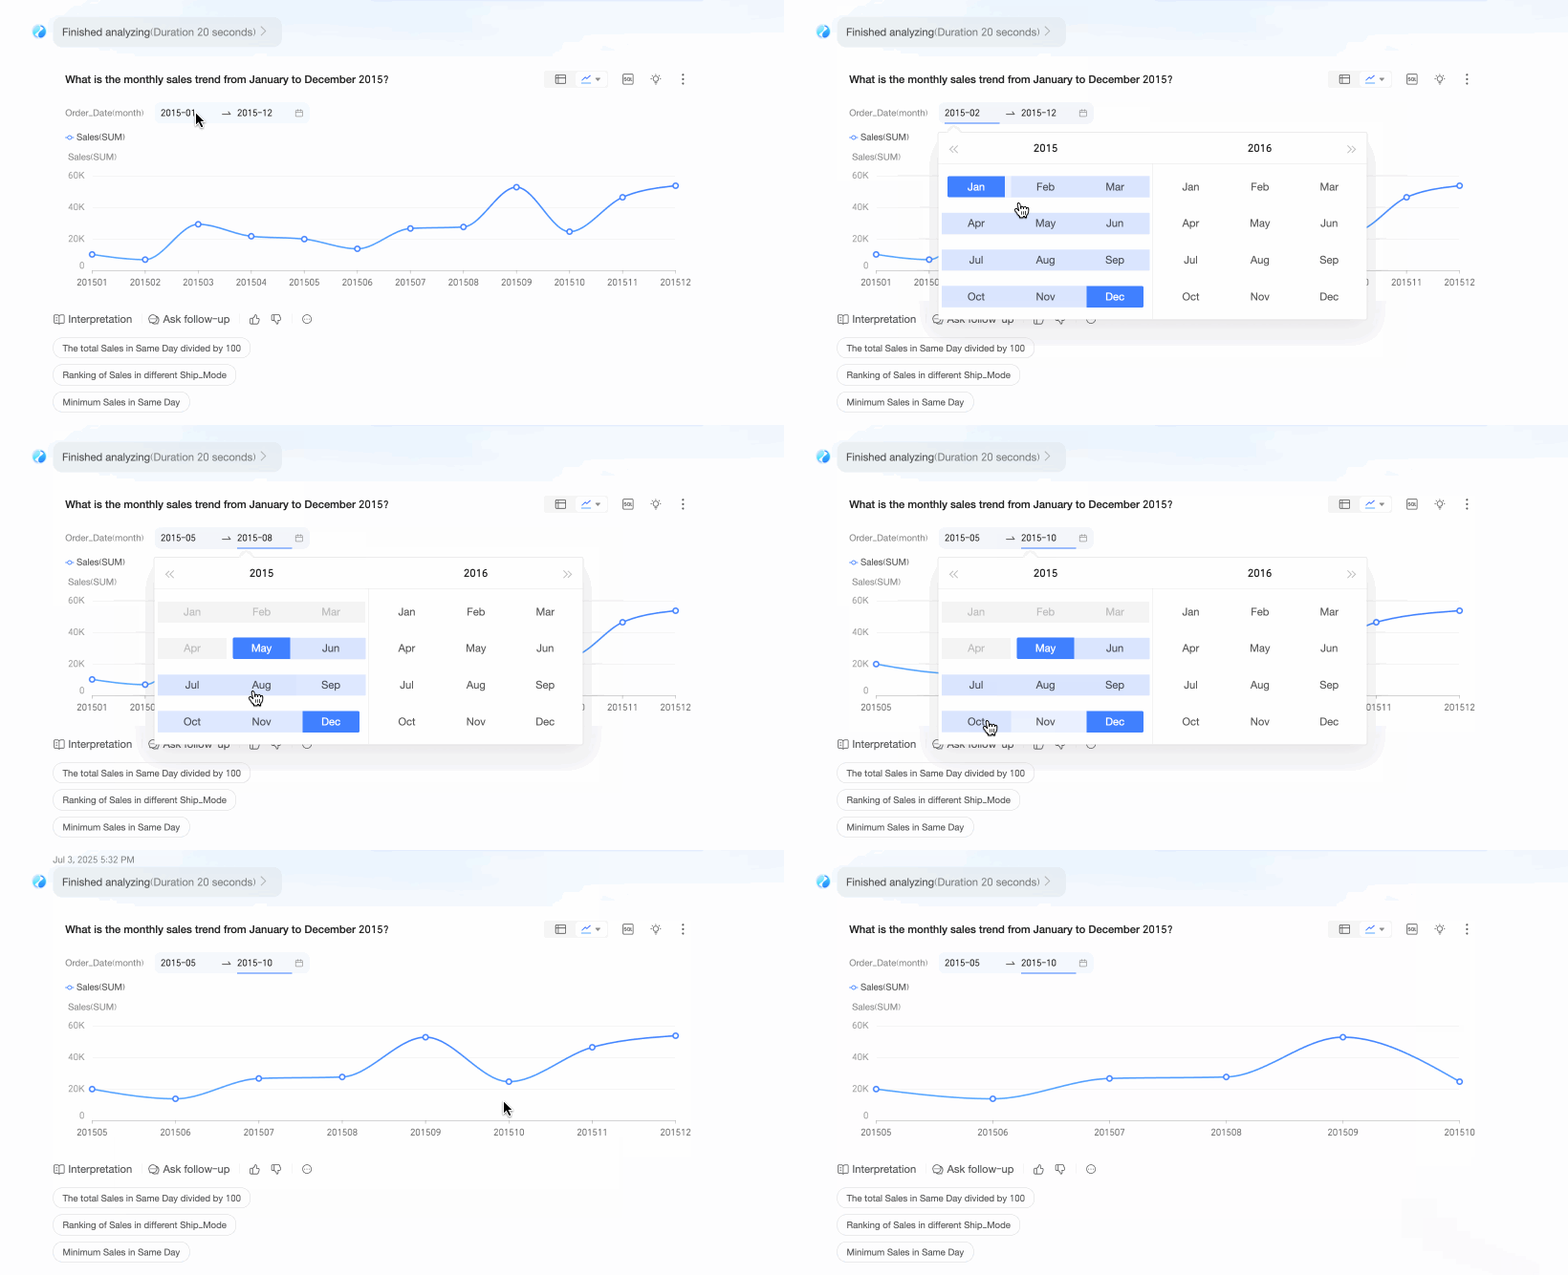
Data filtering (①): The chart displays the query conditions used for the current analysis. You can change them.
-
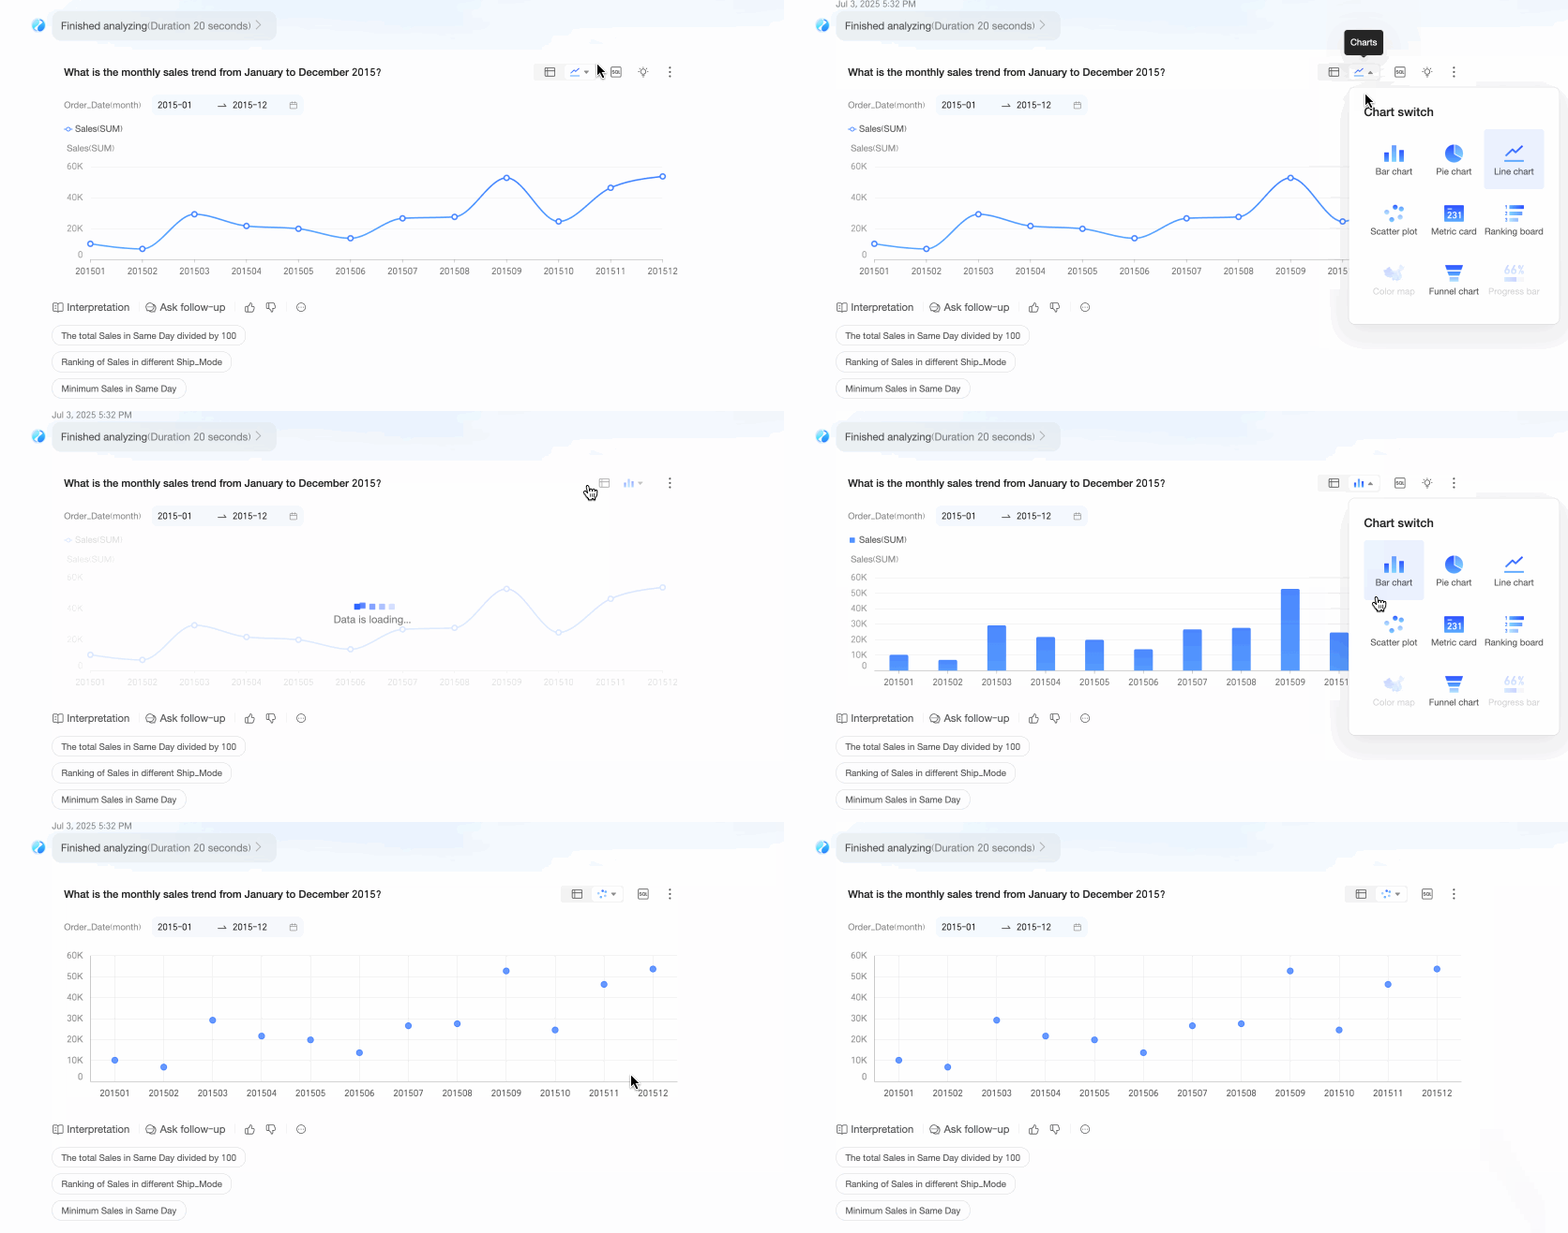
Chart switching (②): Change the chart type to one that better suits your analysis. The available chart types depend on the data.
-
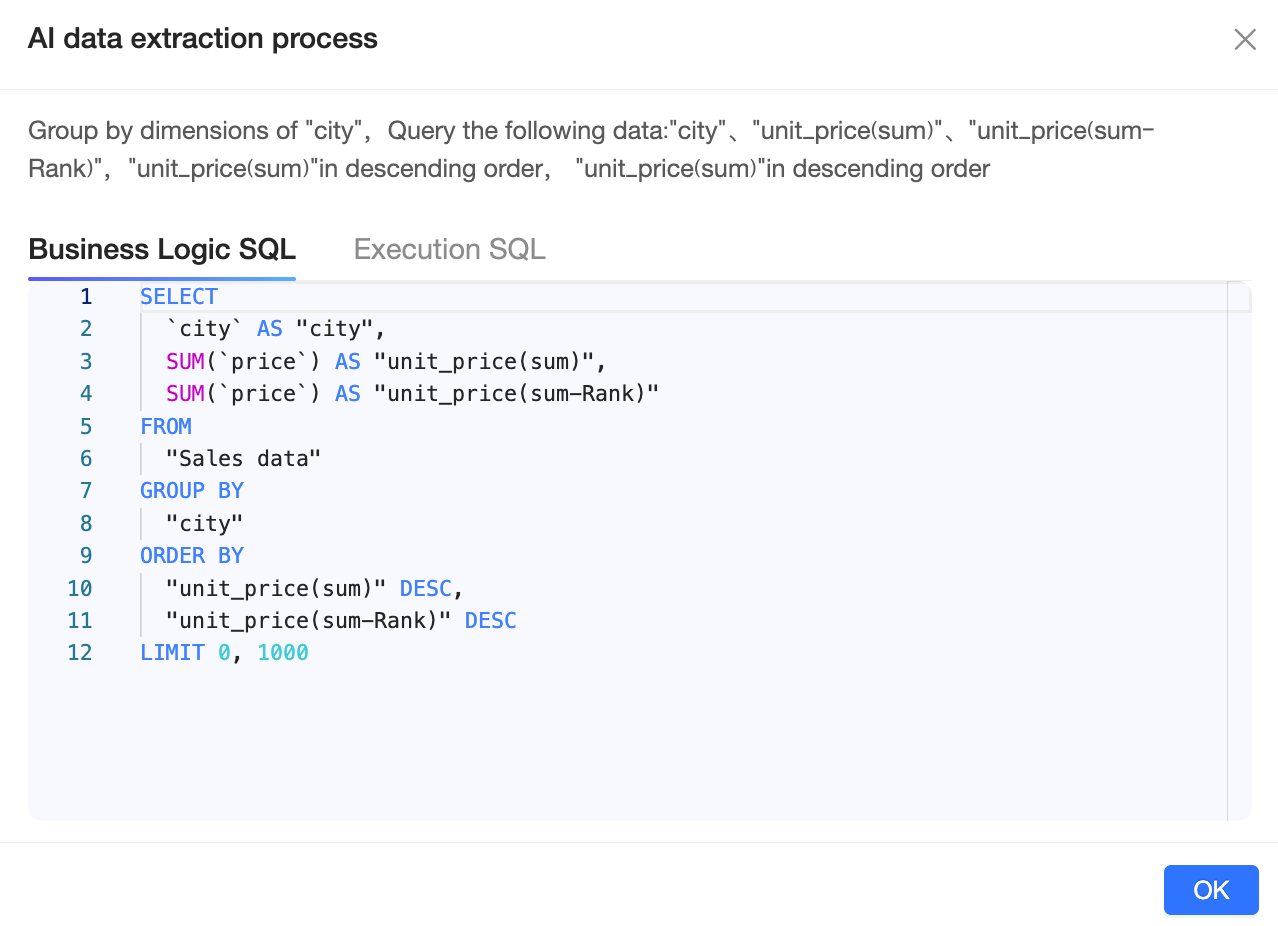
View AI data retrieval process (③): Verify that the data retrieval results meet your expectations. You can view both the business logic SQL and the executed SQL.
-
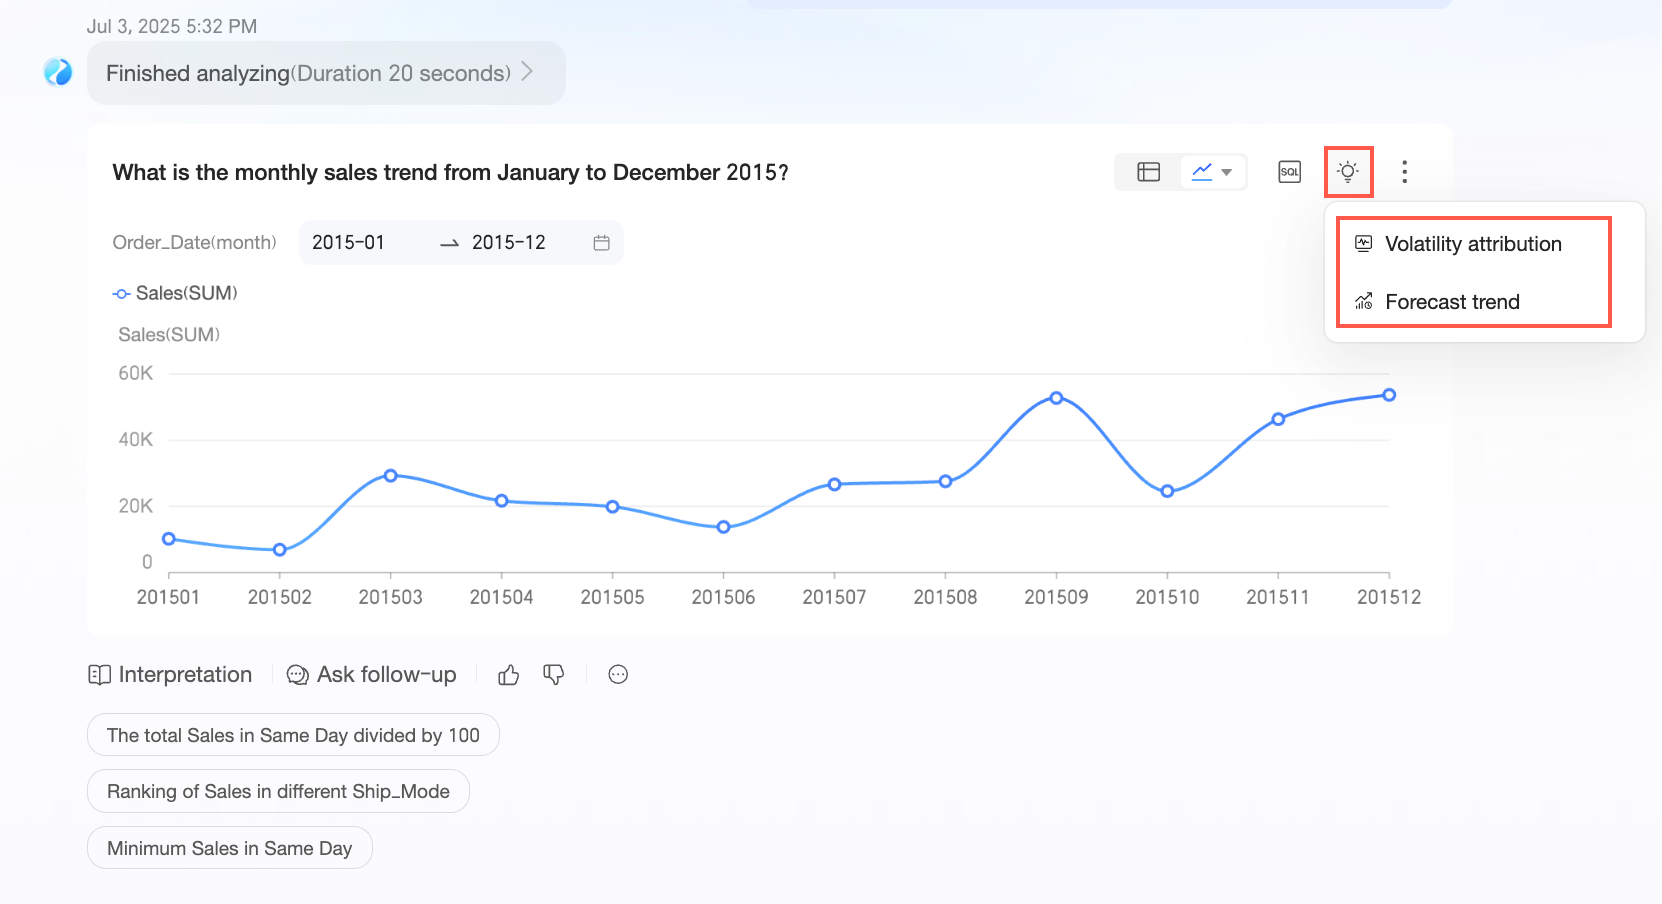
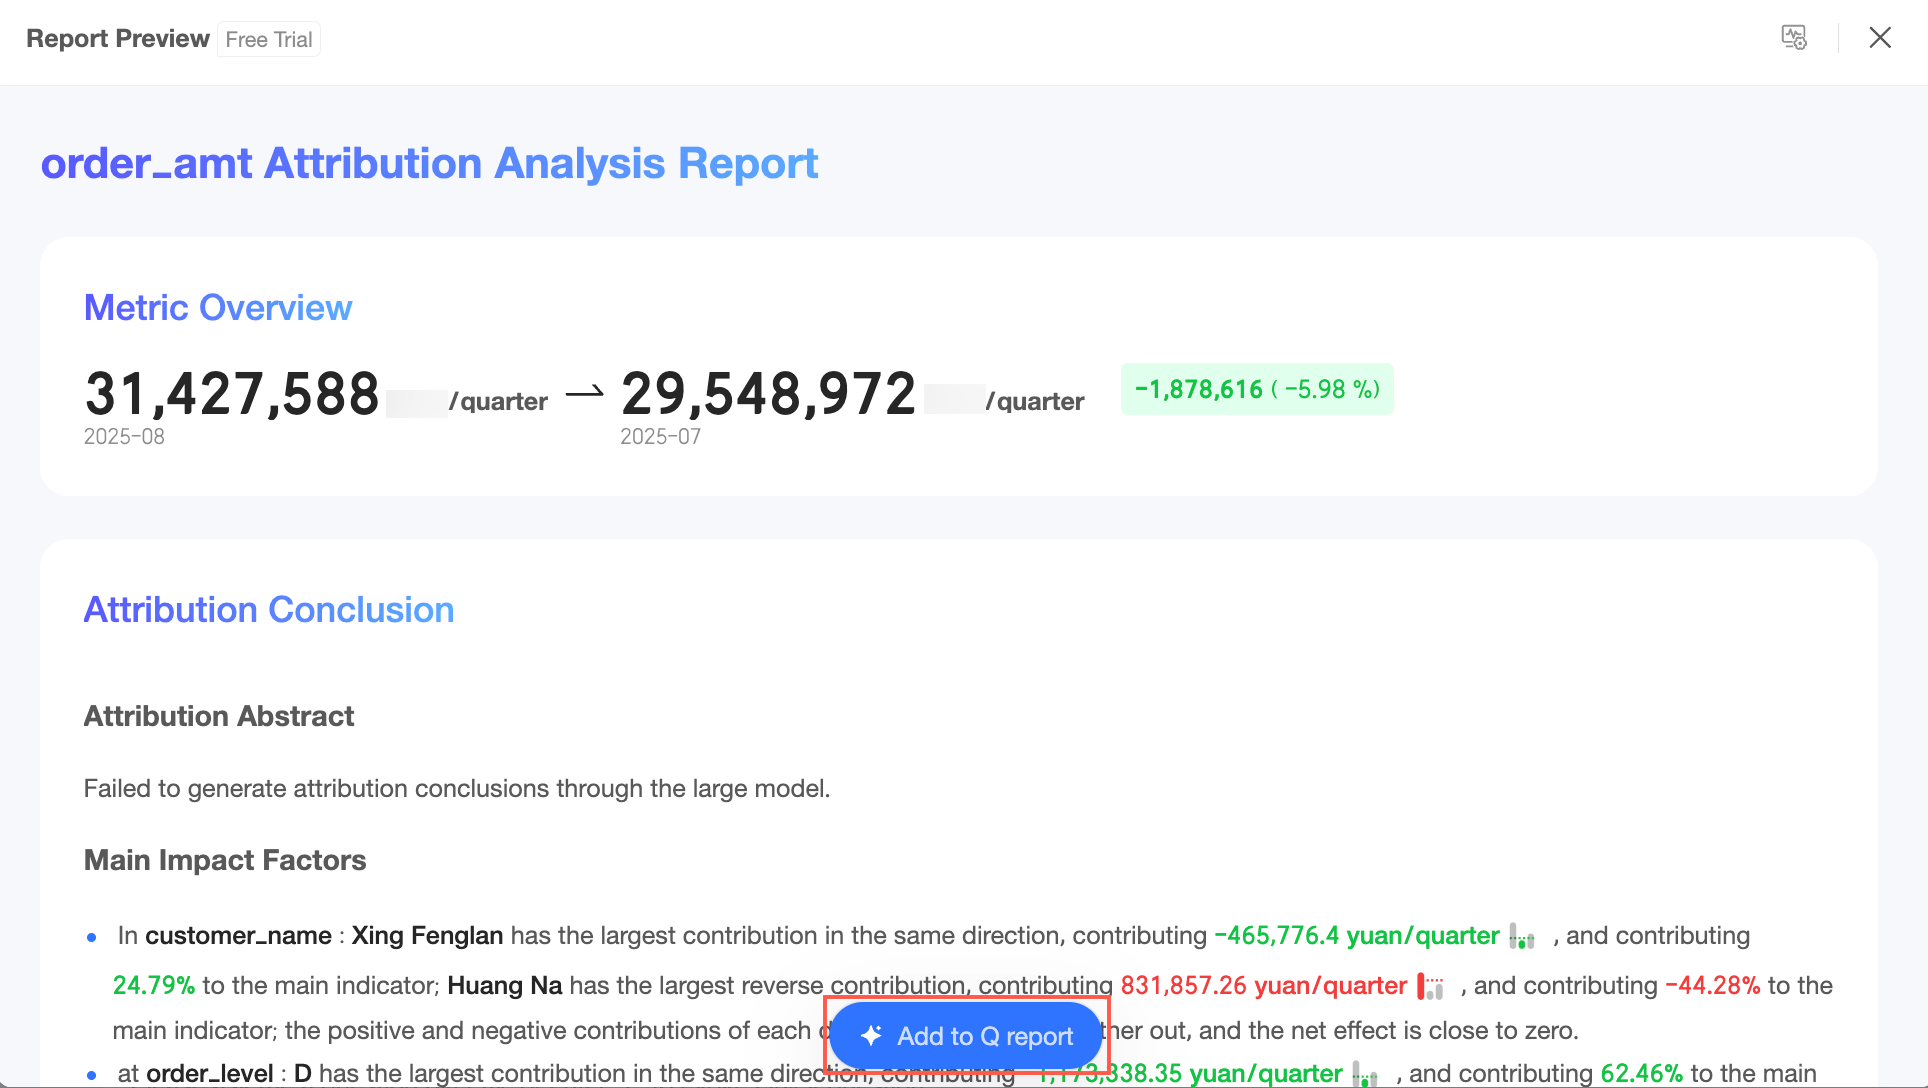
Fluctuation attribution and trend prediction (④)
-
Fluctuation attribution
NoteThe fluctuation attribution feature is available for metric dashboards and line charts that meet the following conditions:
-
Supported chart types: metric dashboards and standard line charts (not including prediction charts).
-
The chart contains exactly one dimension.
-
The dimension is a date type and there is no legend.
-
The source chart must not have any errors.
-
Line chart requirements: 1 date dimension and 1 to 3 measures.
-
Metric dashboard requirements: 1 date dimension and 1 measure.
-
Click the
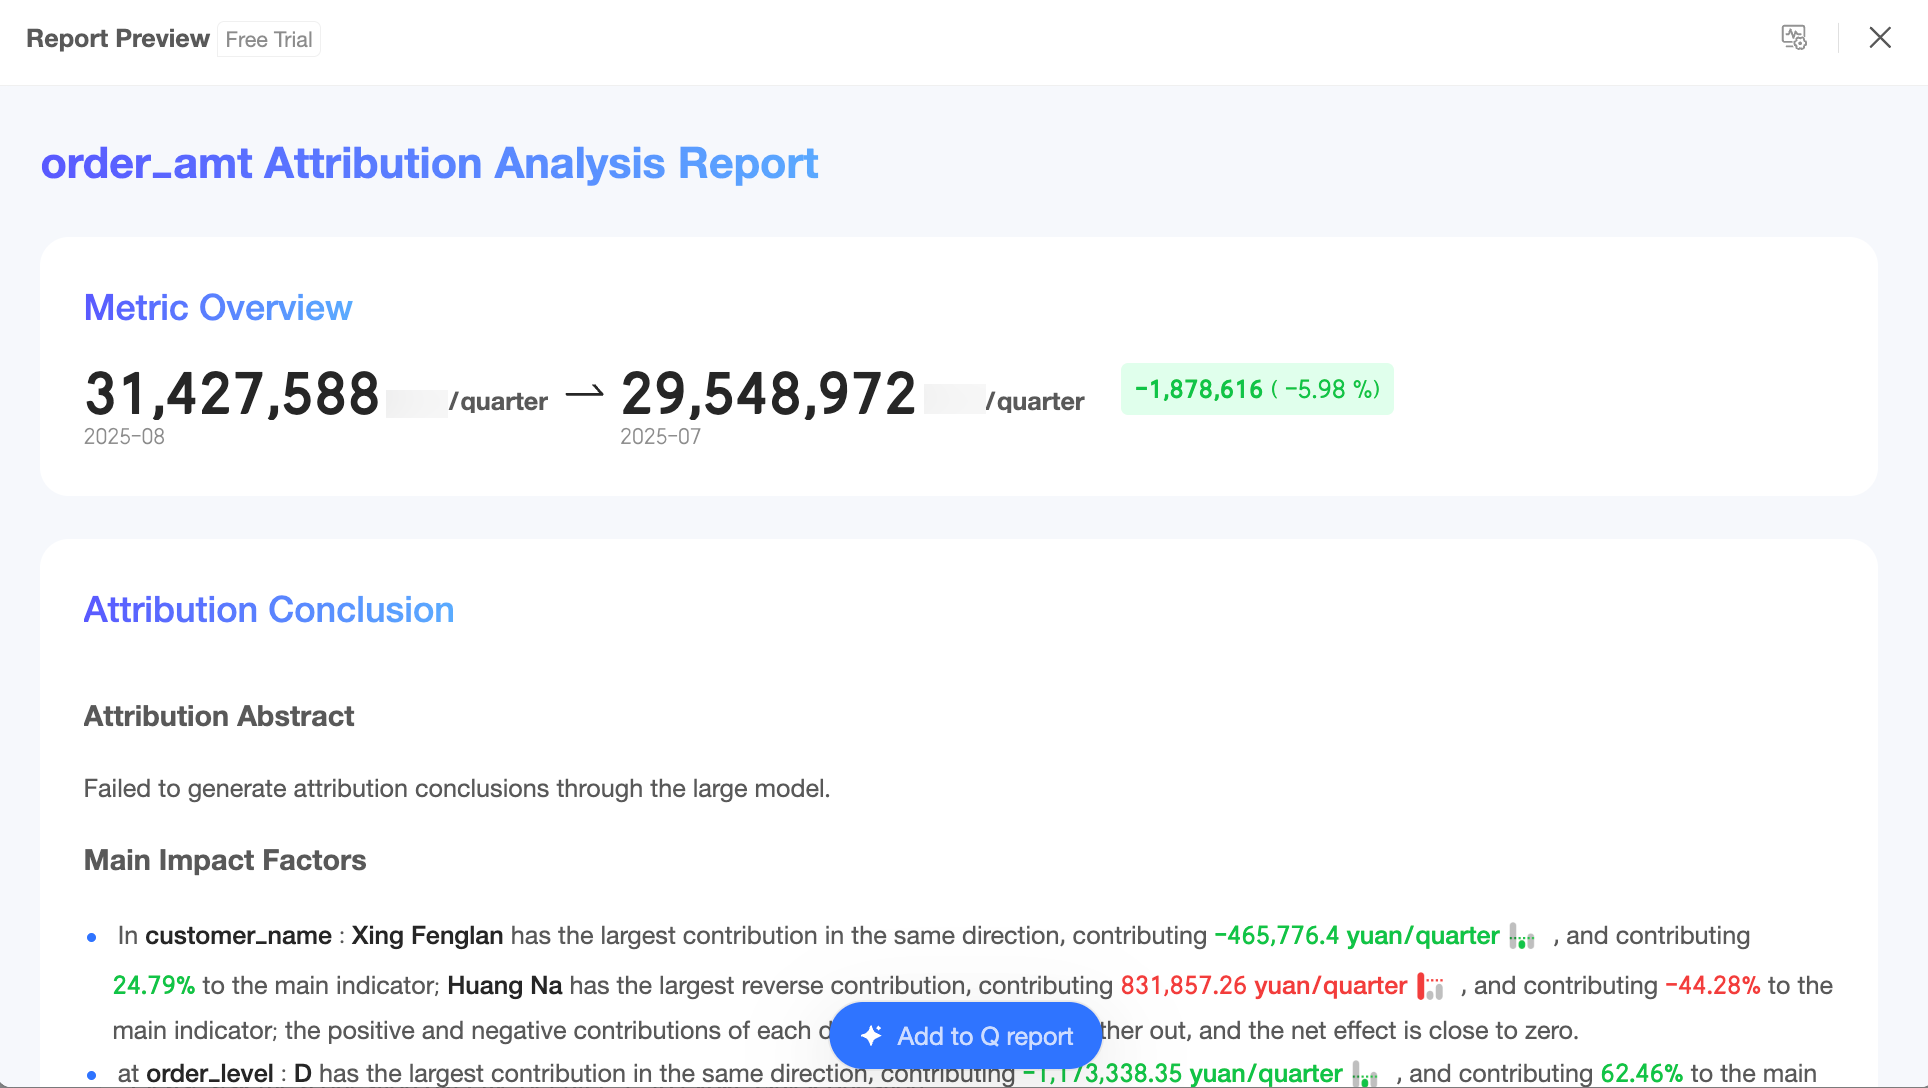
icon in the upper-right corner to open the Attribution Report Settings.You can change the attribution metric, data interpretation approach, and model selection. After you click OK, the system automatically updates the attribution report. For more information, see Metric insights.
-
You can add the attribution report to an Intelligent Data Assistant Q report as needed.
-
-
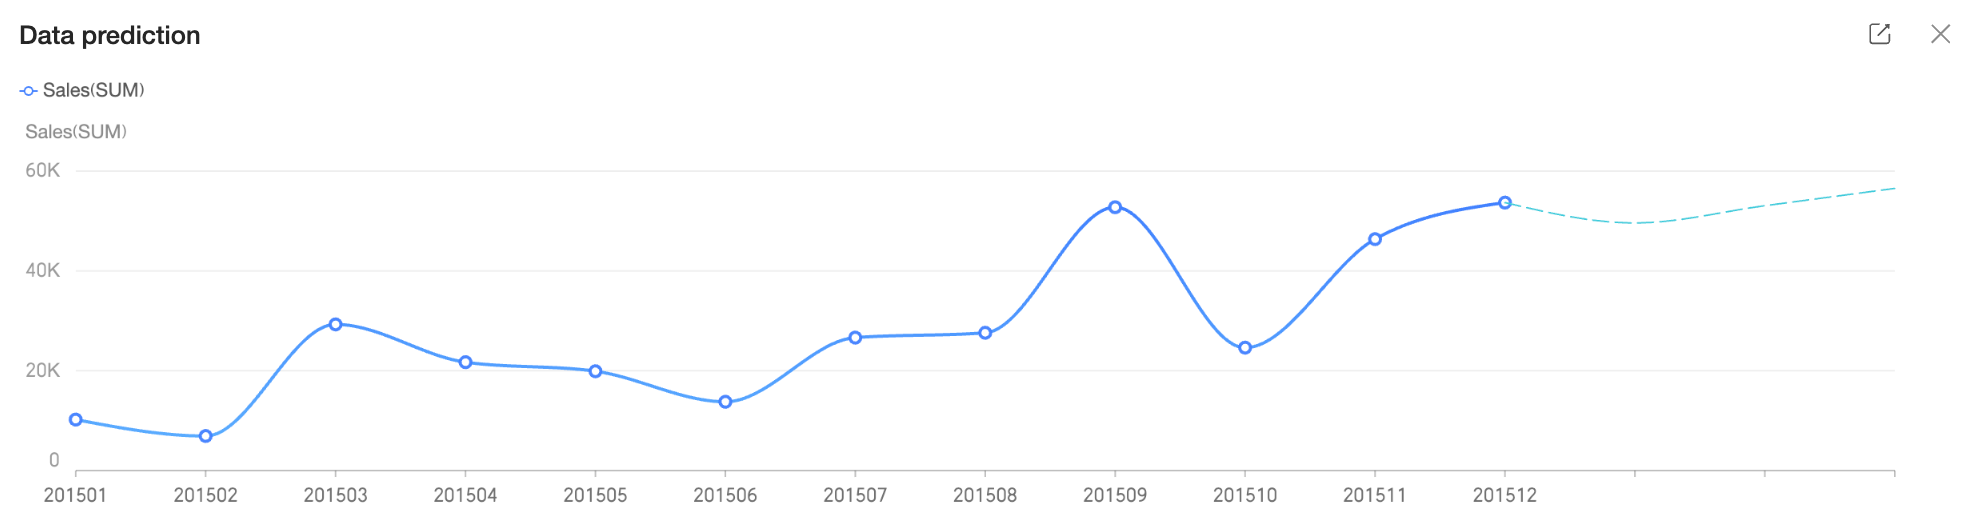
Trend prediction
NoteThe trend prediction feature is available for line and bar charts that meet the following conditions:
-
Supported chart types: Line charts and bar charts that contain a date dimension and no legend.
-
The chart is not itself a prediction result.
-
The source chart must not have any errors.
-
The source chart must contain 12 or more dimension values.
-
Line chart requirements: 1 date dimension and 1 to 3 measures.
Click the
icon in the upper-right corner to share the trend prediction. -
-
-
View in full screen (⑤).
-
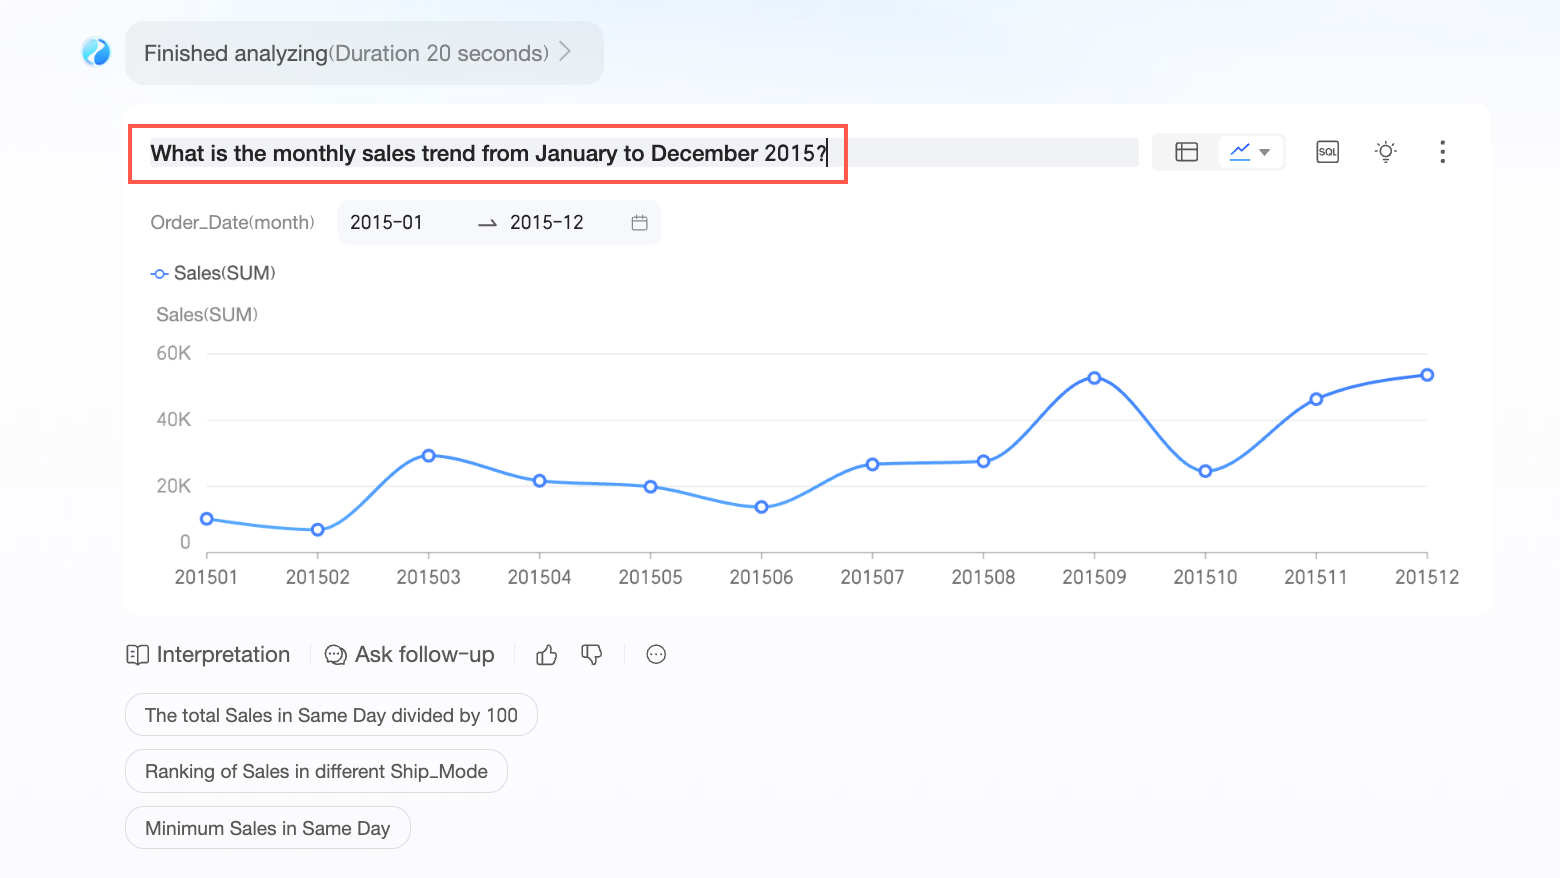
Rename (⑥)
You can rename the result. You can also click the area highlighted in red to rename it.
-
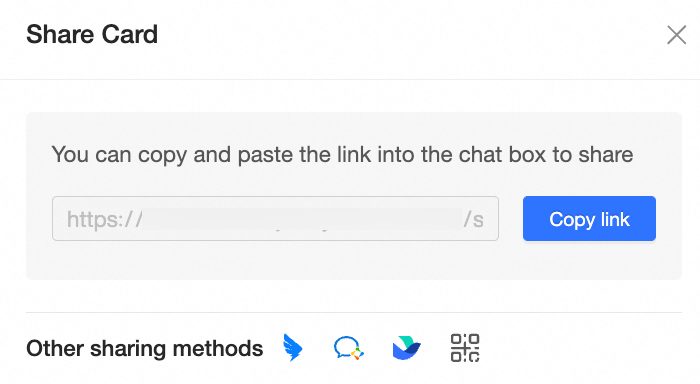
Share data (⑦)
Copy a link for analysis or share it to an instant messaging (IM) application.
Note-
To share to an IM application, you must first bind your enterprise and personal accounts.
-
Sharing is supported for WeCom, DingTalk, and Feishu.
-
-
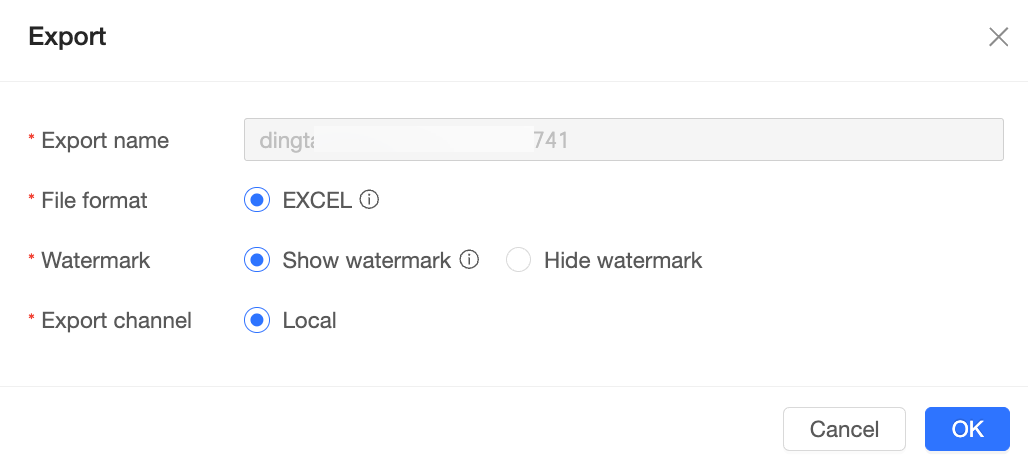
Export data (⑧)
Export the data to a local Excel file and optionally specify a custom export name.
NoteThis feature is available only on PC.
-
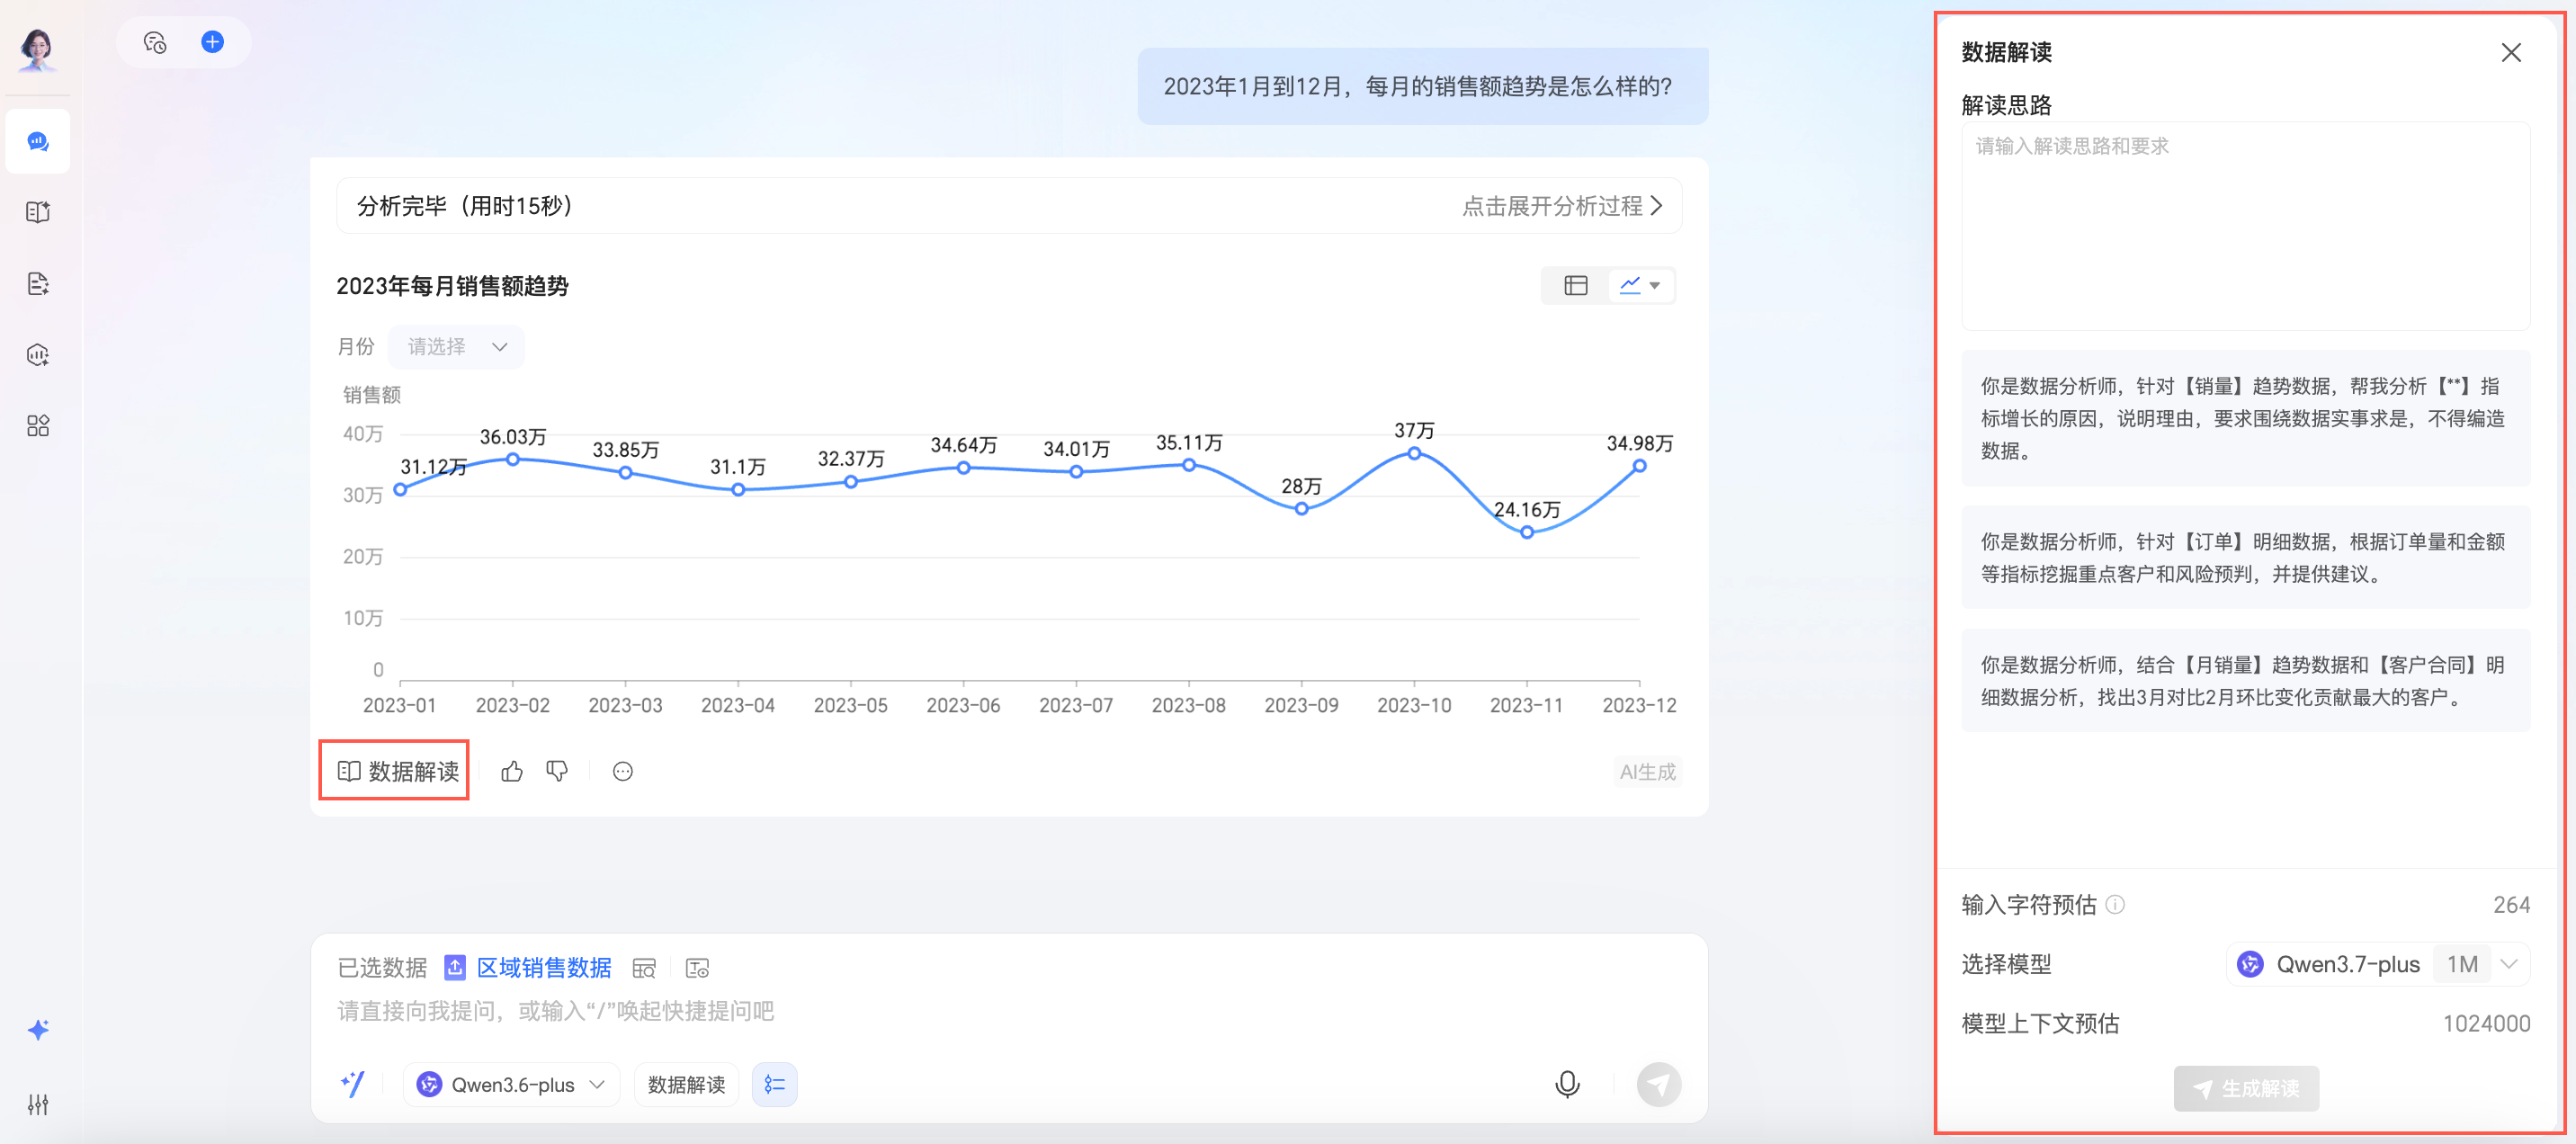
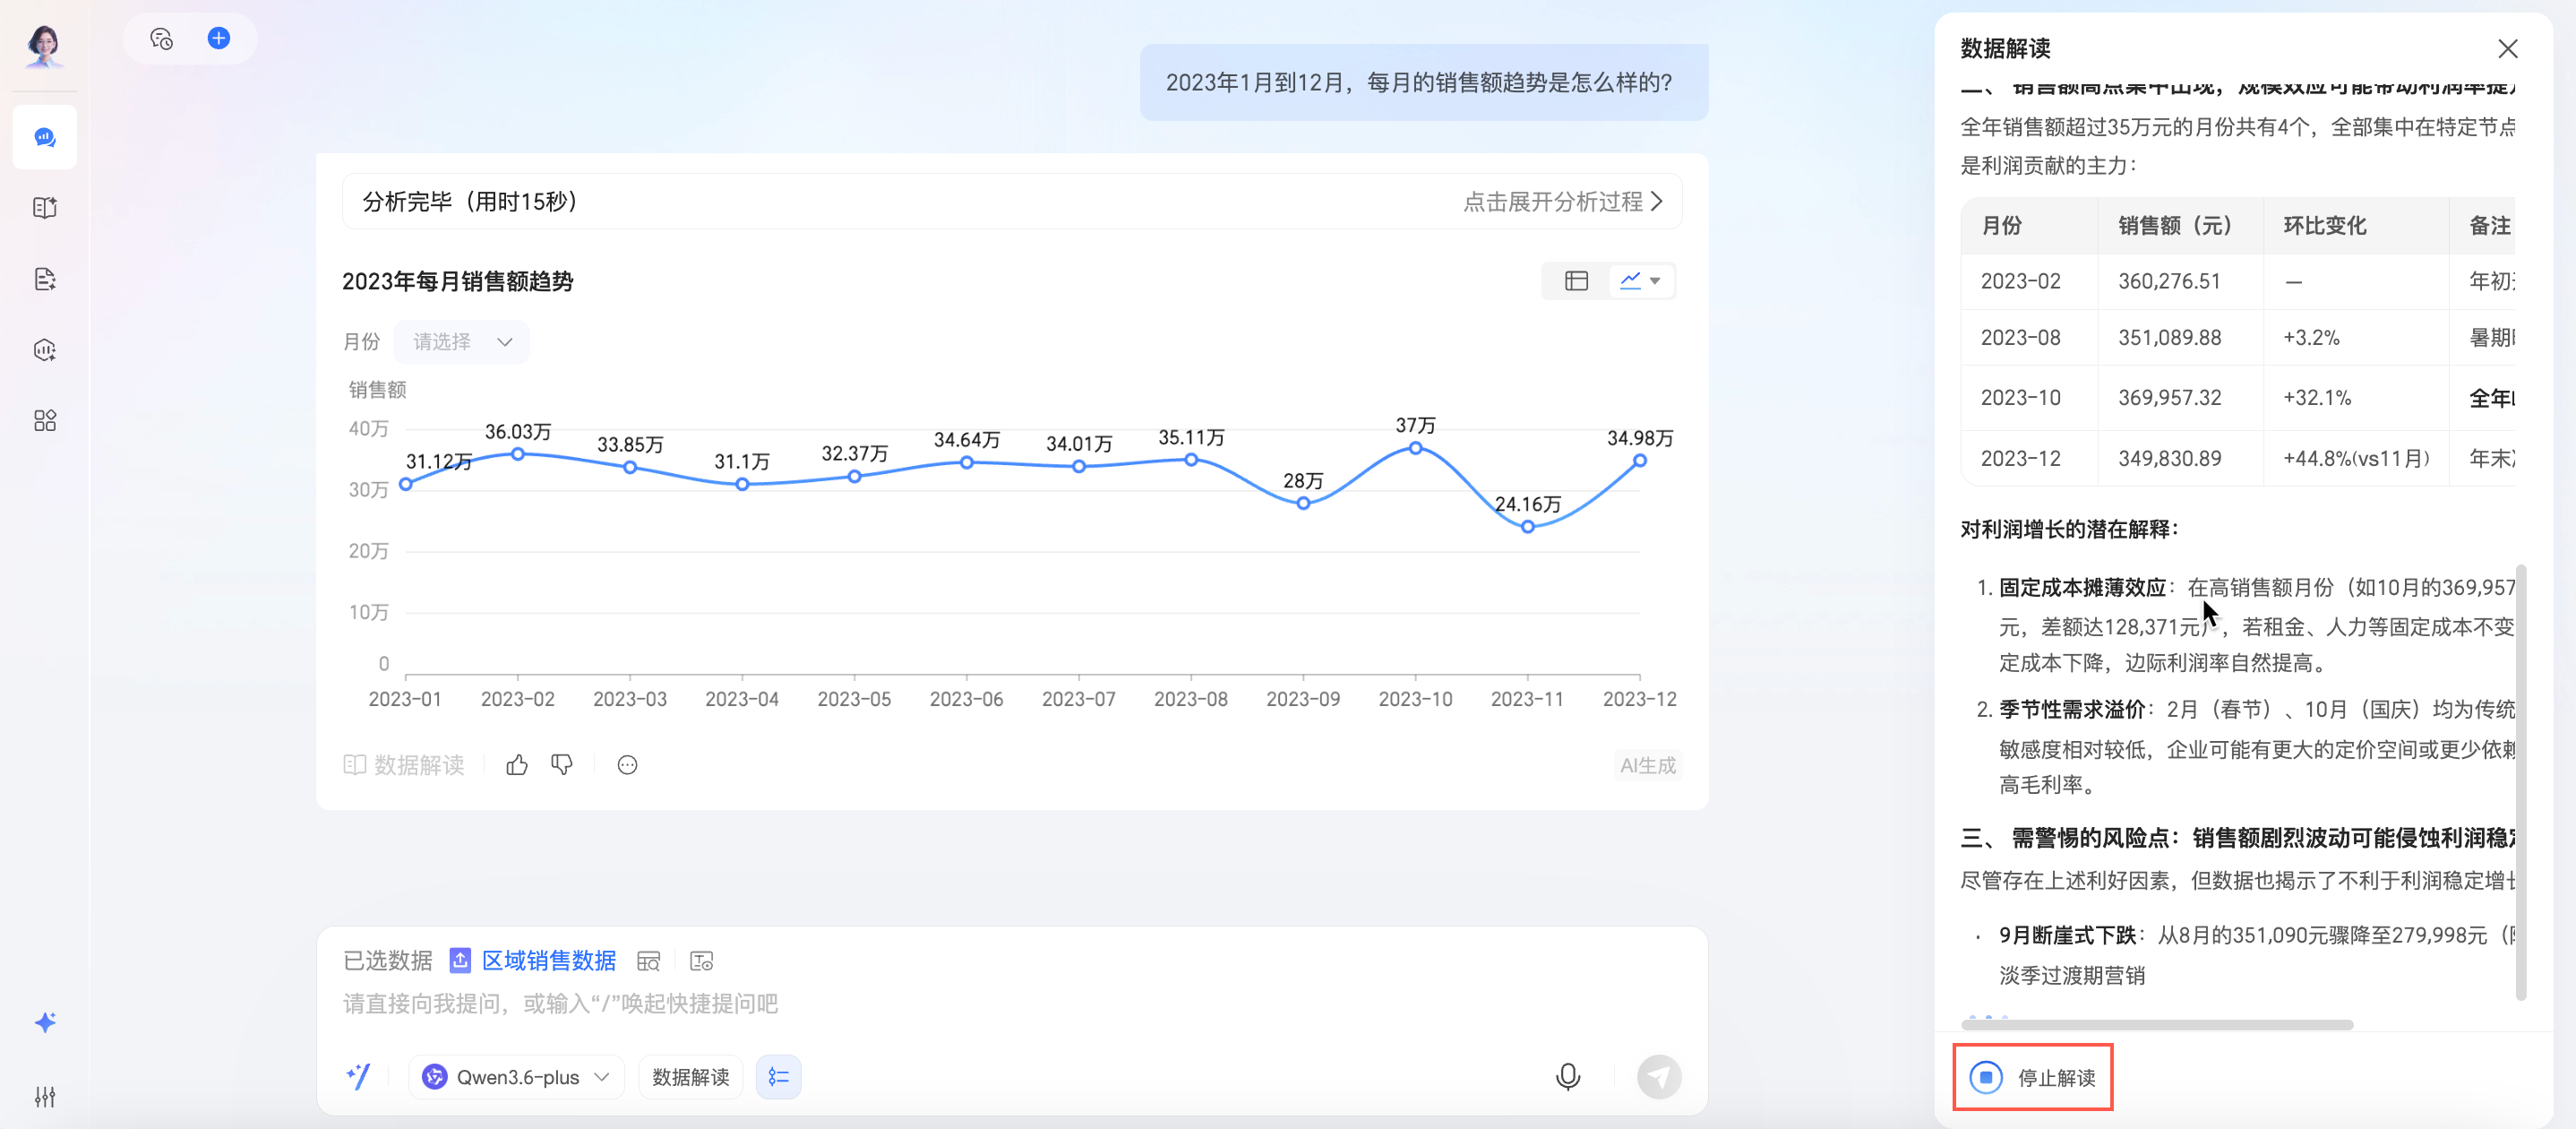
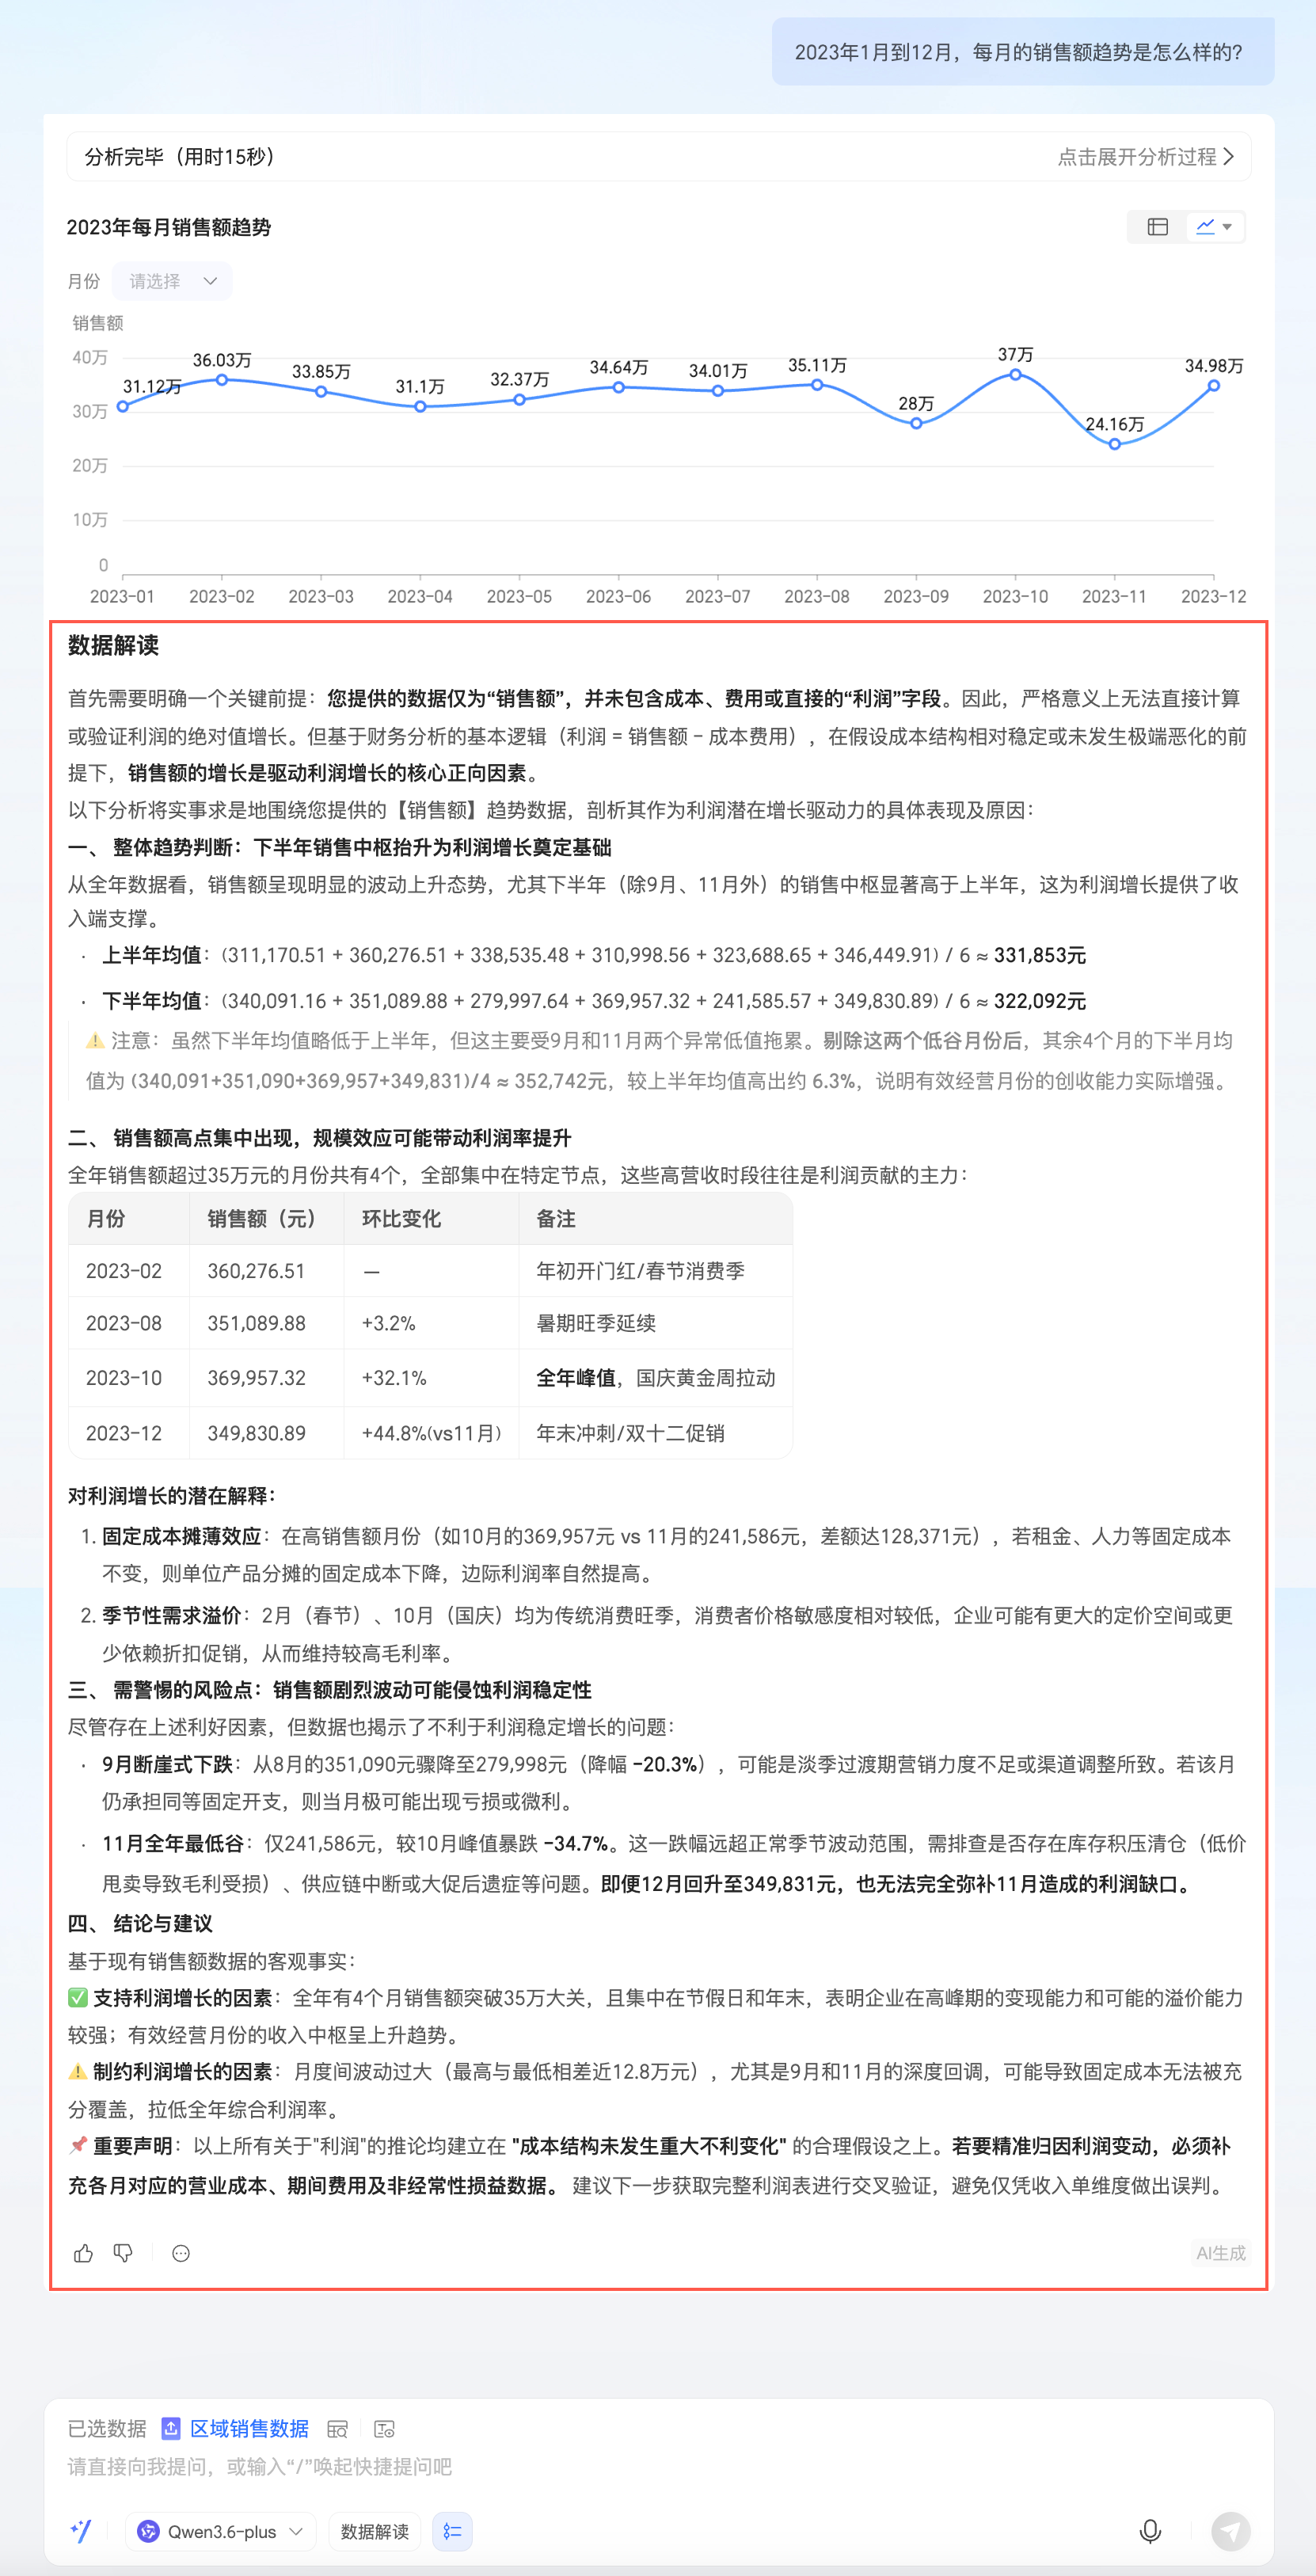
Data interpretation (⑨)
NoteUse this feature to run a custom data interpretation with the approach and model you specify.
Refer to the sample interpretation approaches or enter your own, select a model, and click Generate Interpretation.
You can stop interpretation while the result is being generated.
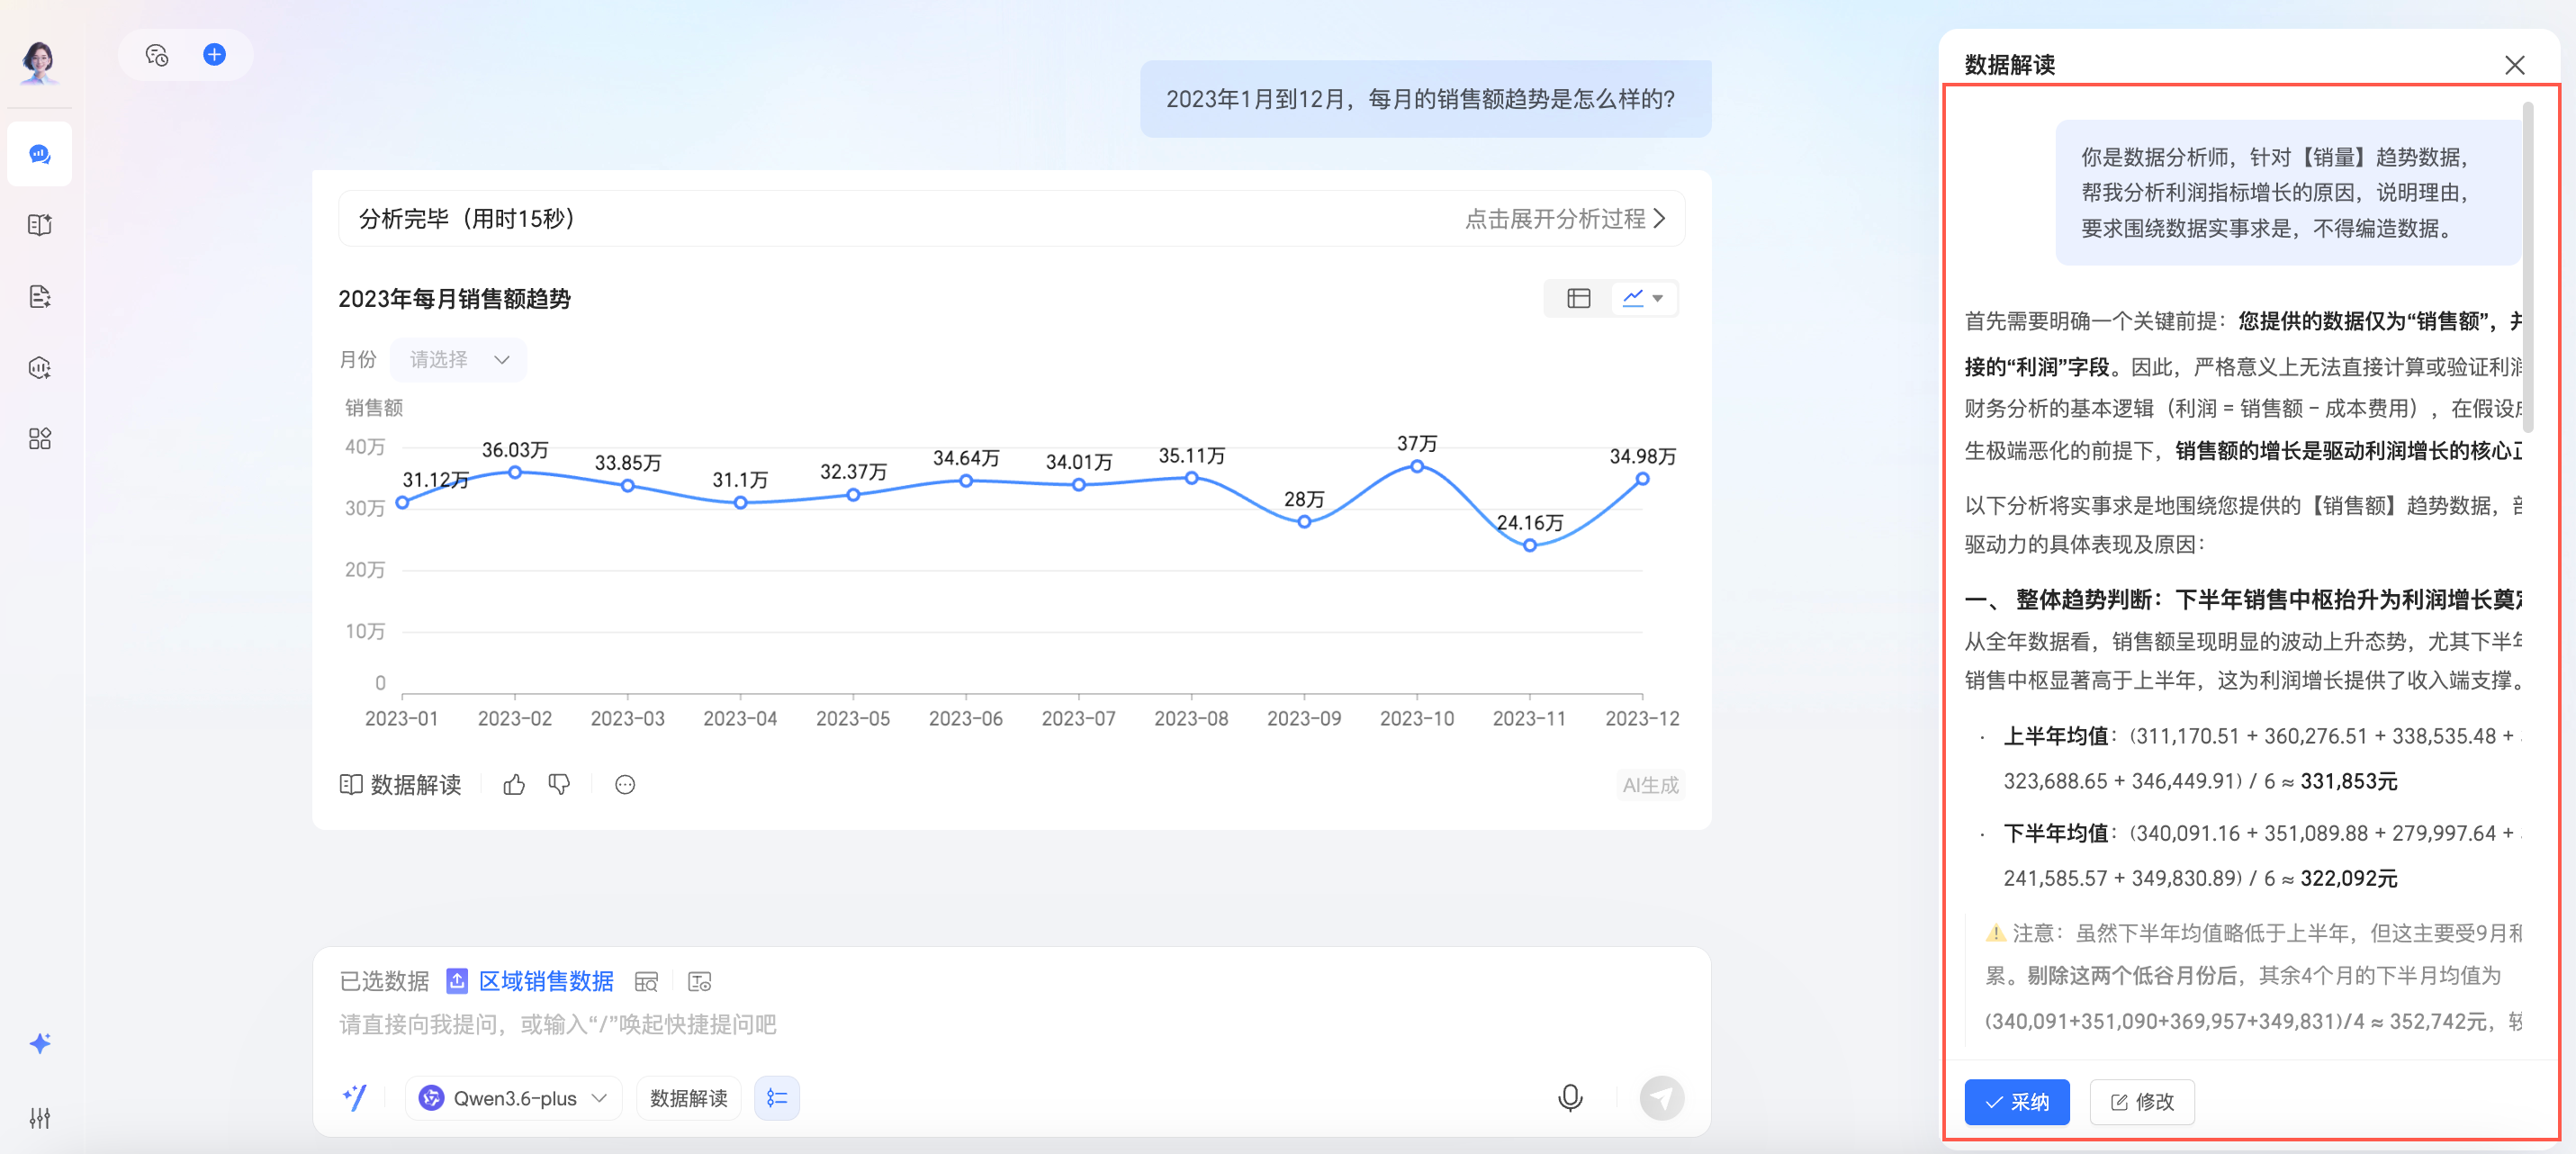
Adopt the interpretation or modify it. Adopting the interpretation generates a data interpretation report.
To change the interpretation approach or model, click the
icon next to the data interpretation to make changes and generate a new report. -
Like/dislike (⑪)
Click
to like the response or to dislike it. When you dislike a response, you can provide feedback. -
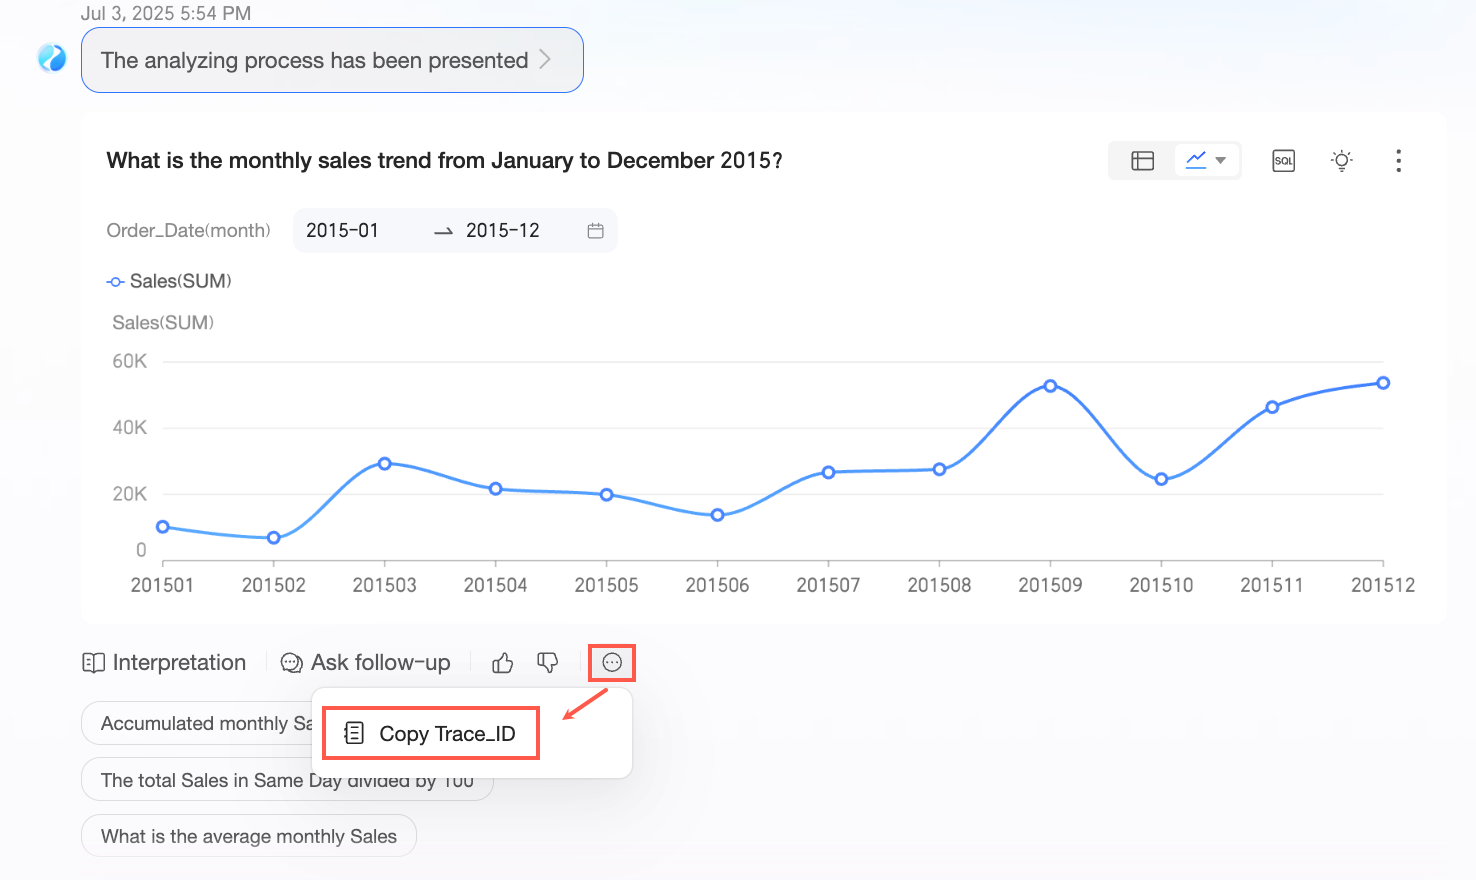
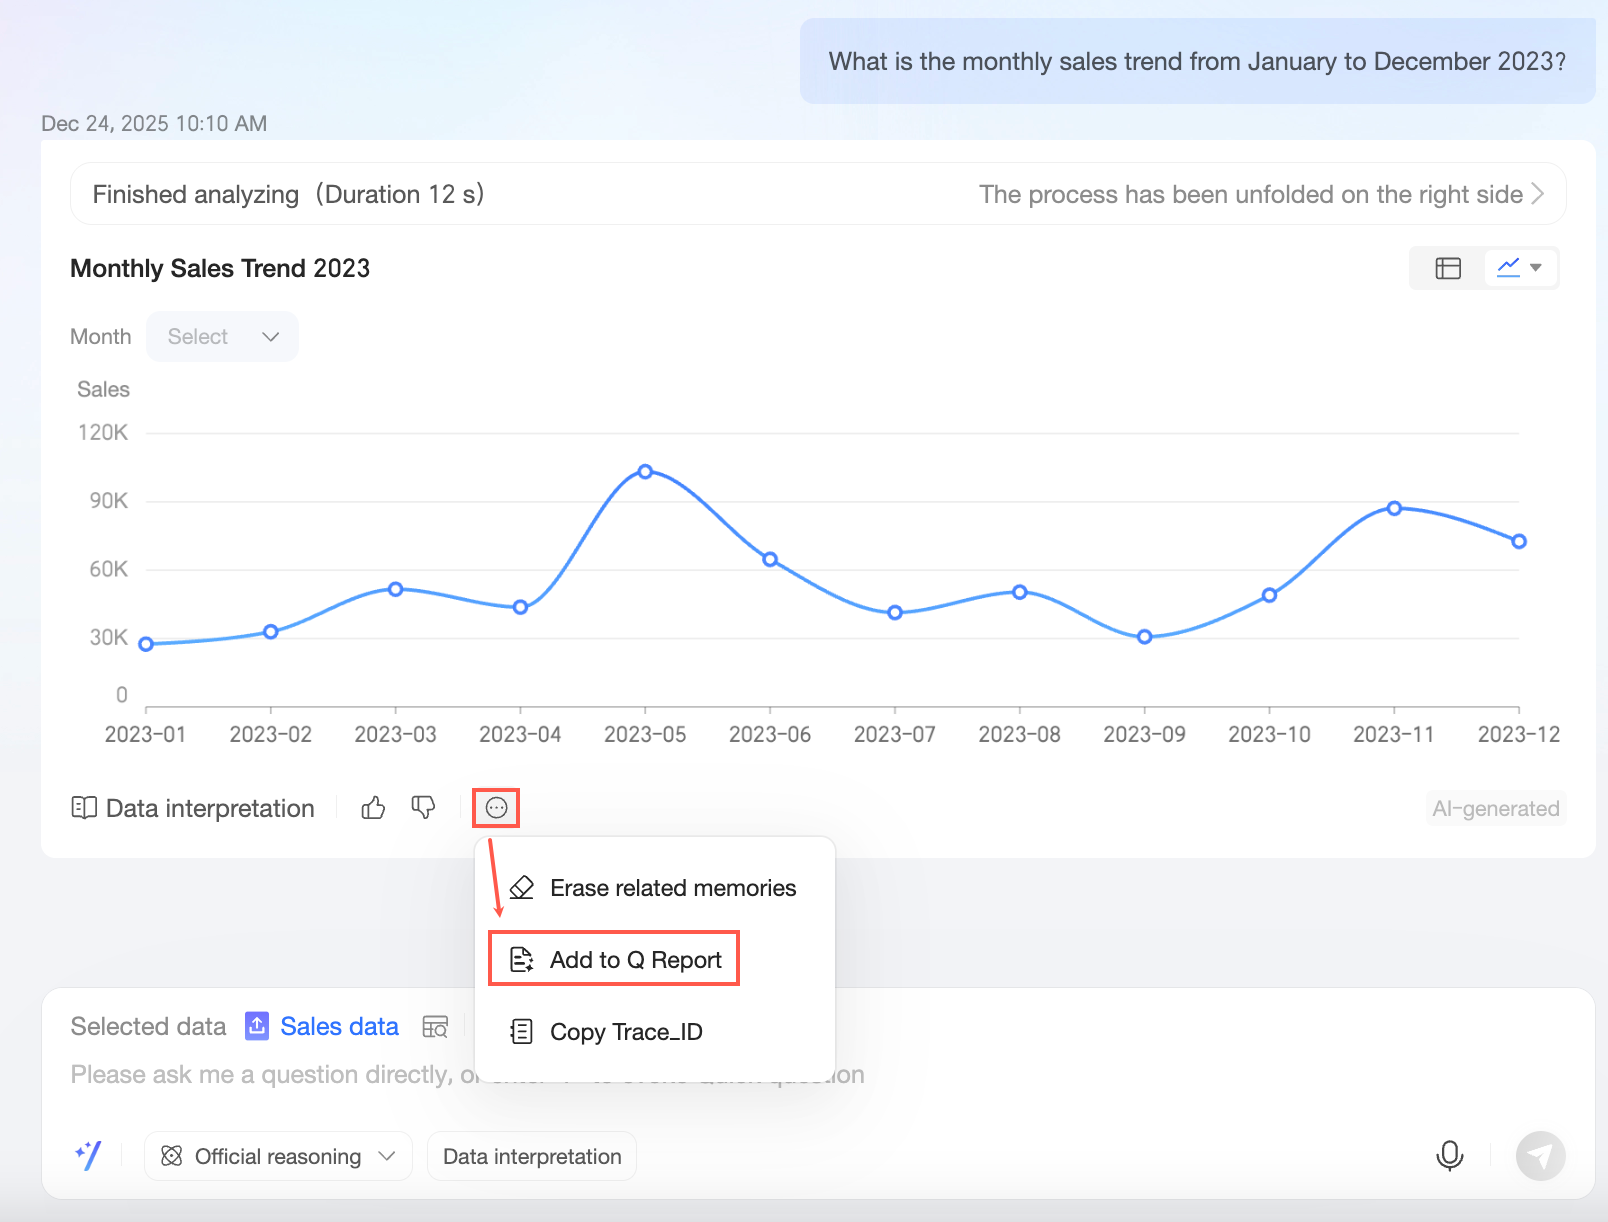
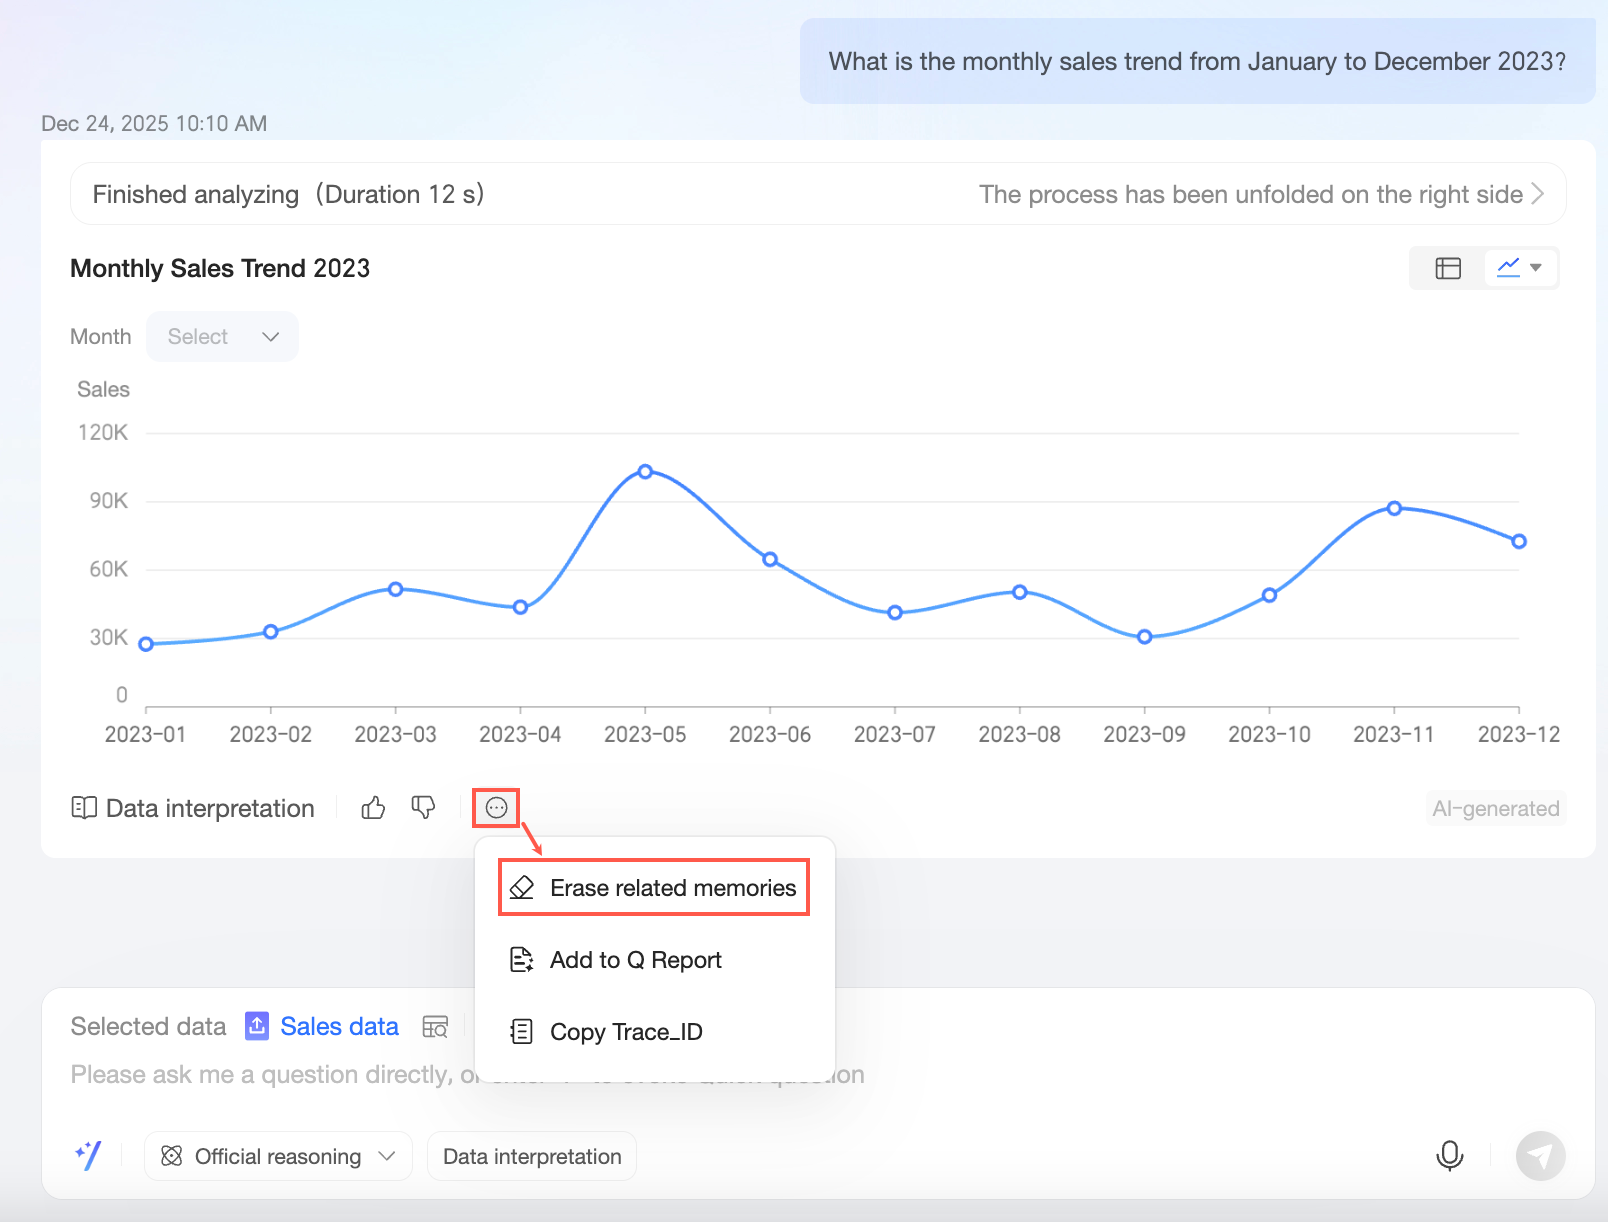
More (⑫)
-
Copy Trace_ID
-
Add to Intelligent Data Assistant Q Report
-
Clear Related Memory
If the answer is unsatisfactory, click Clear Related Memory to clear the memory of the current question and similar content, then ask again for a new response.
NoteThis feature is only available for questions asked using a data file.
-
 icon in the upper-right corner to open the Attribution Report Settings.
 icon in the upper-right corner to share the trend prediction.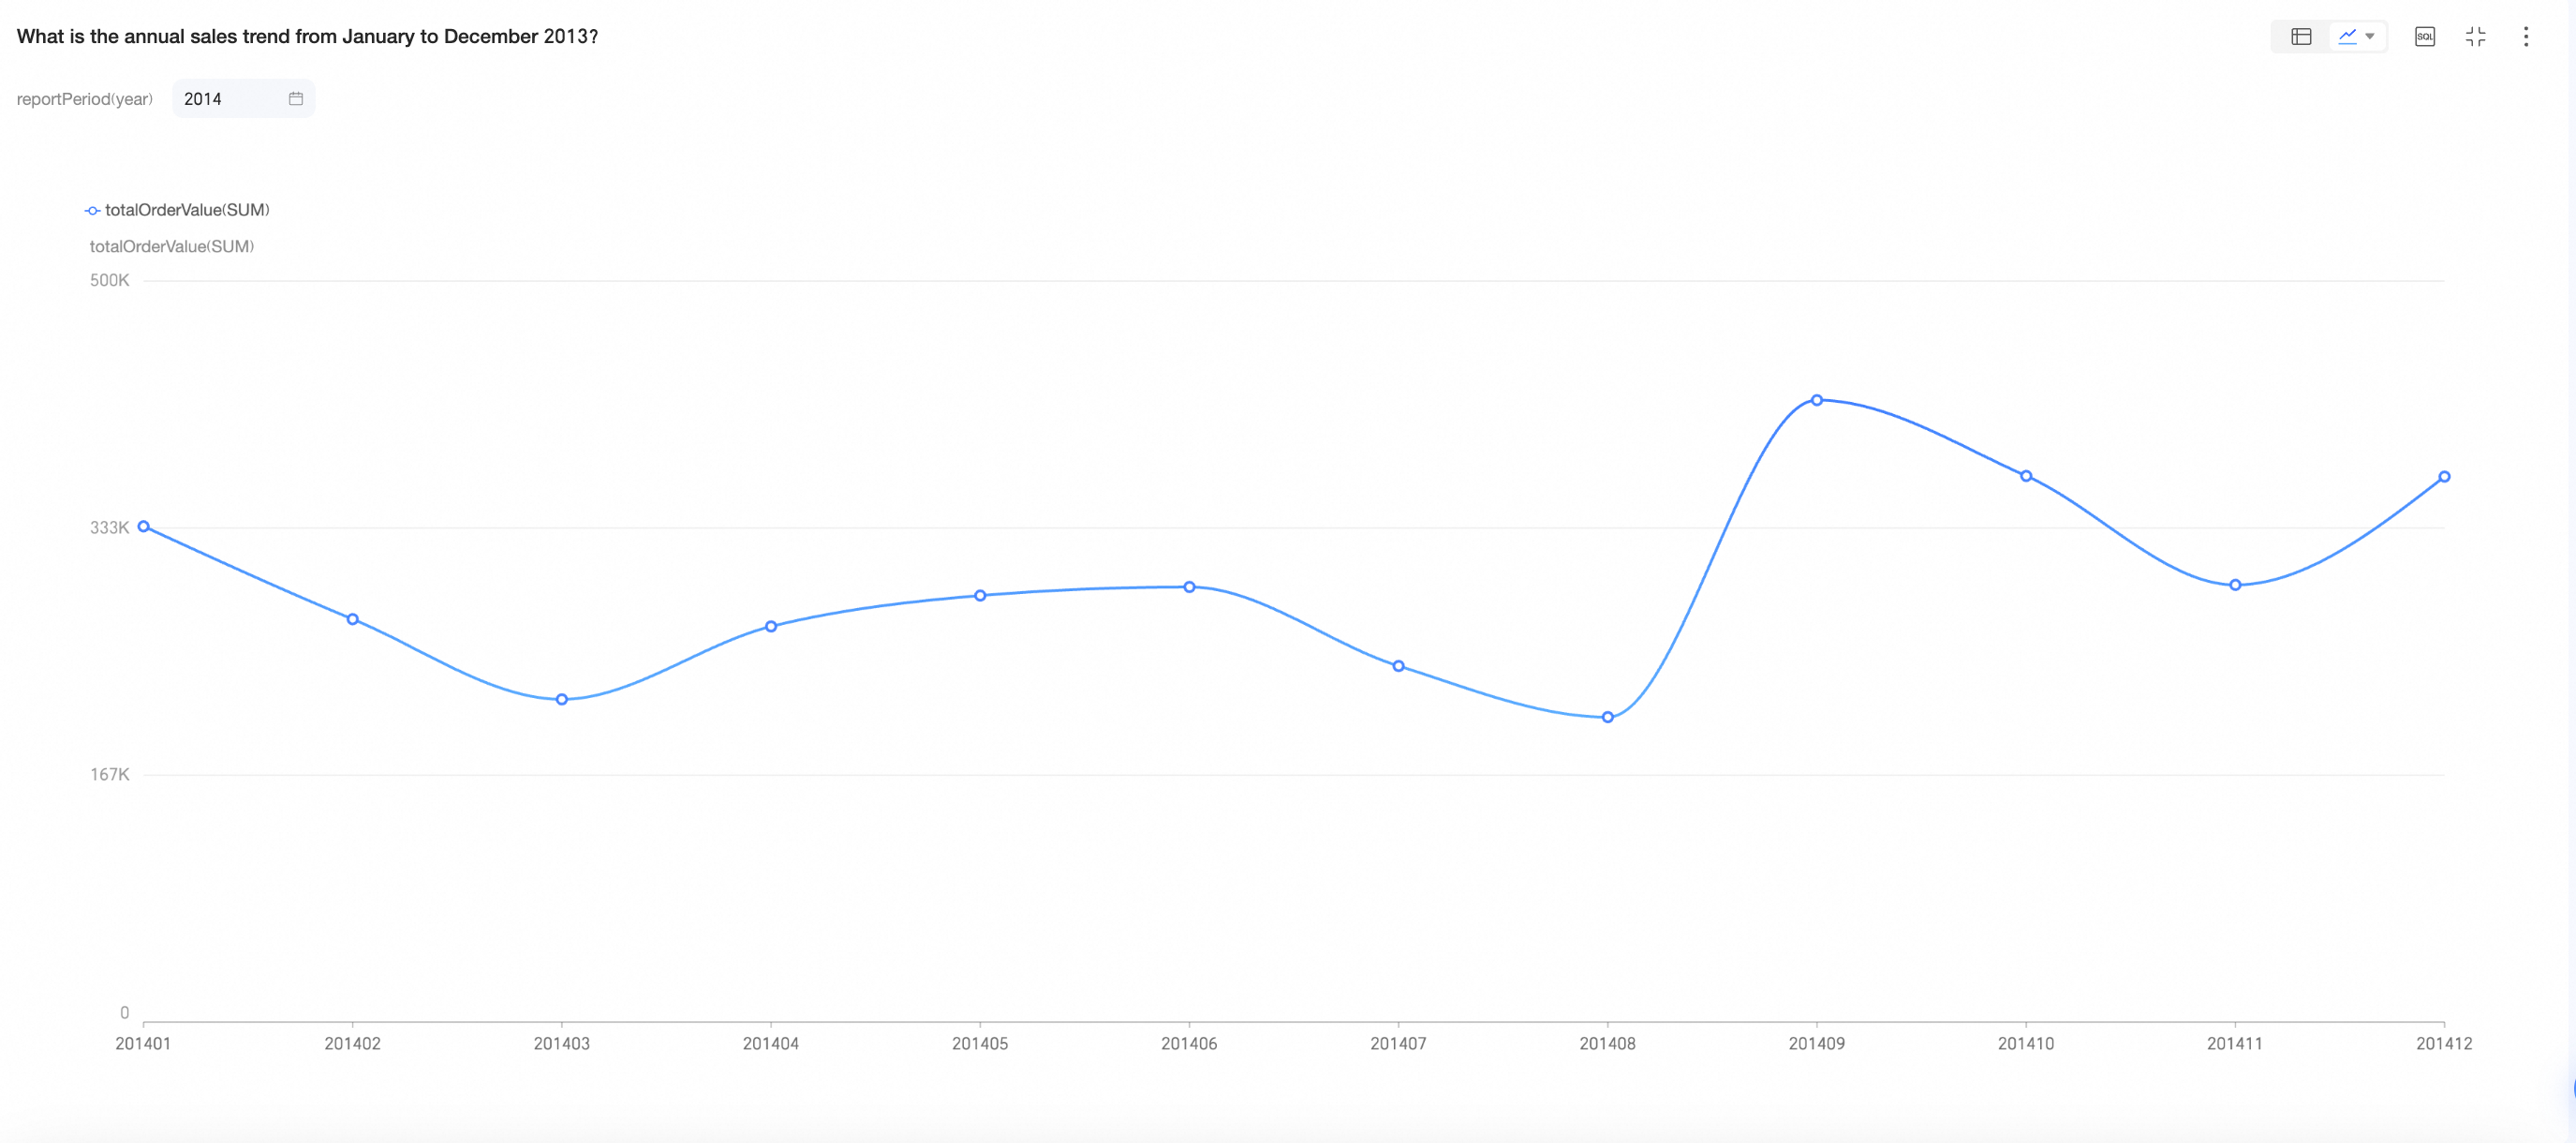
 icon next to the data interpretation to make changes and generate a new report.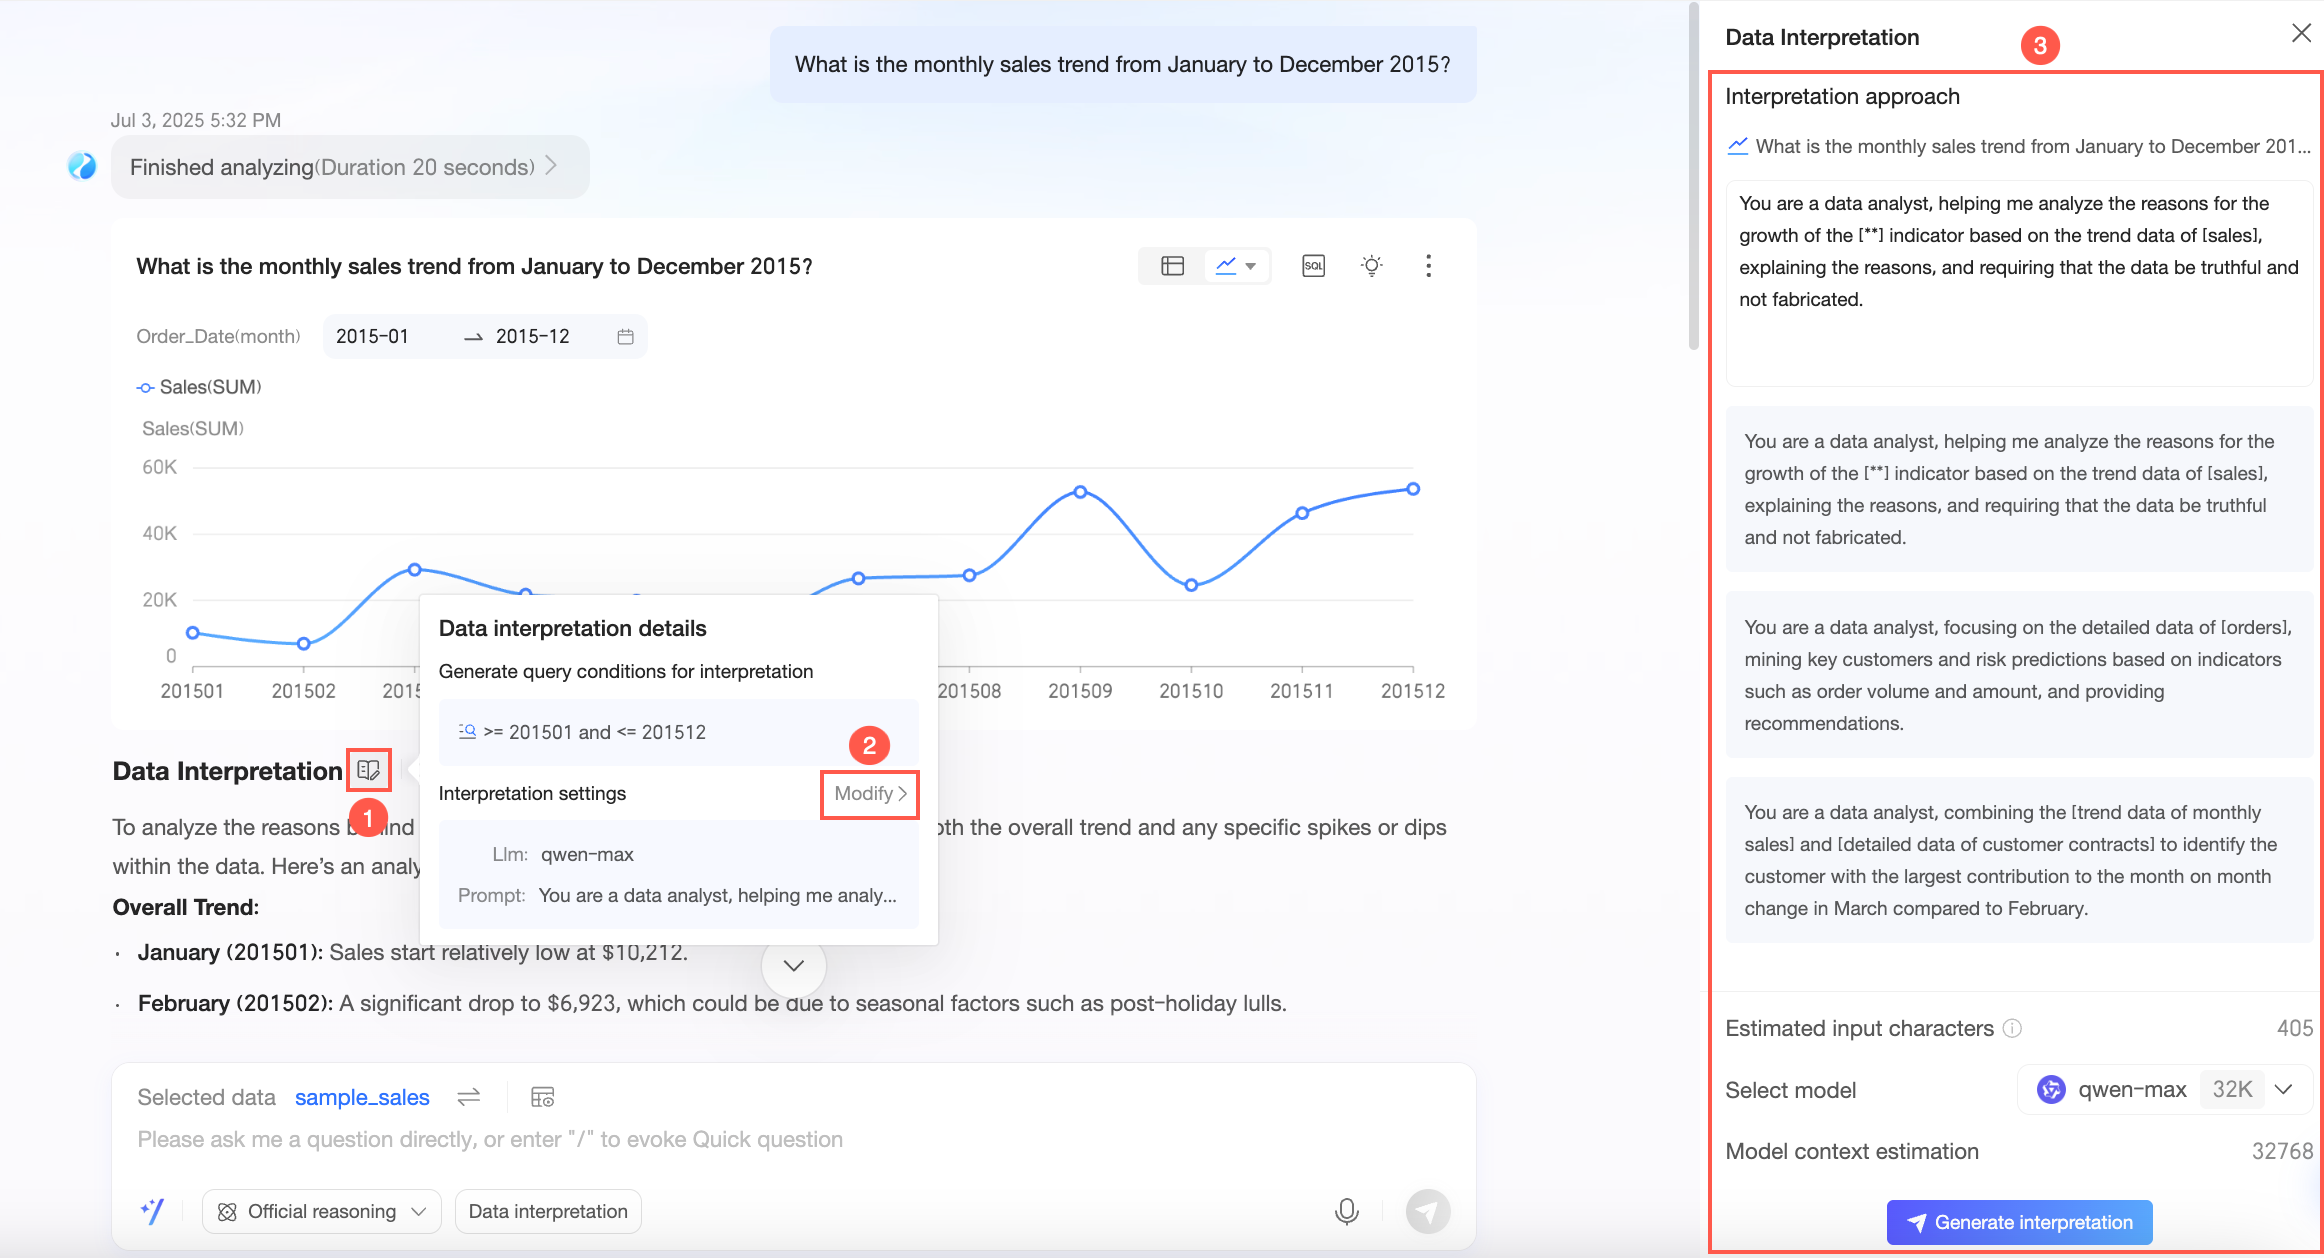
 to like the response or
  to dislike it. When you dislike a response, you can provide feedback.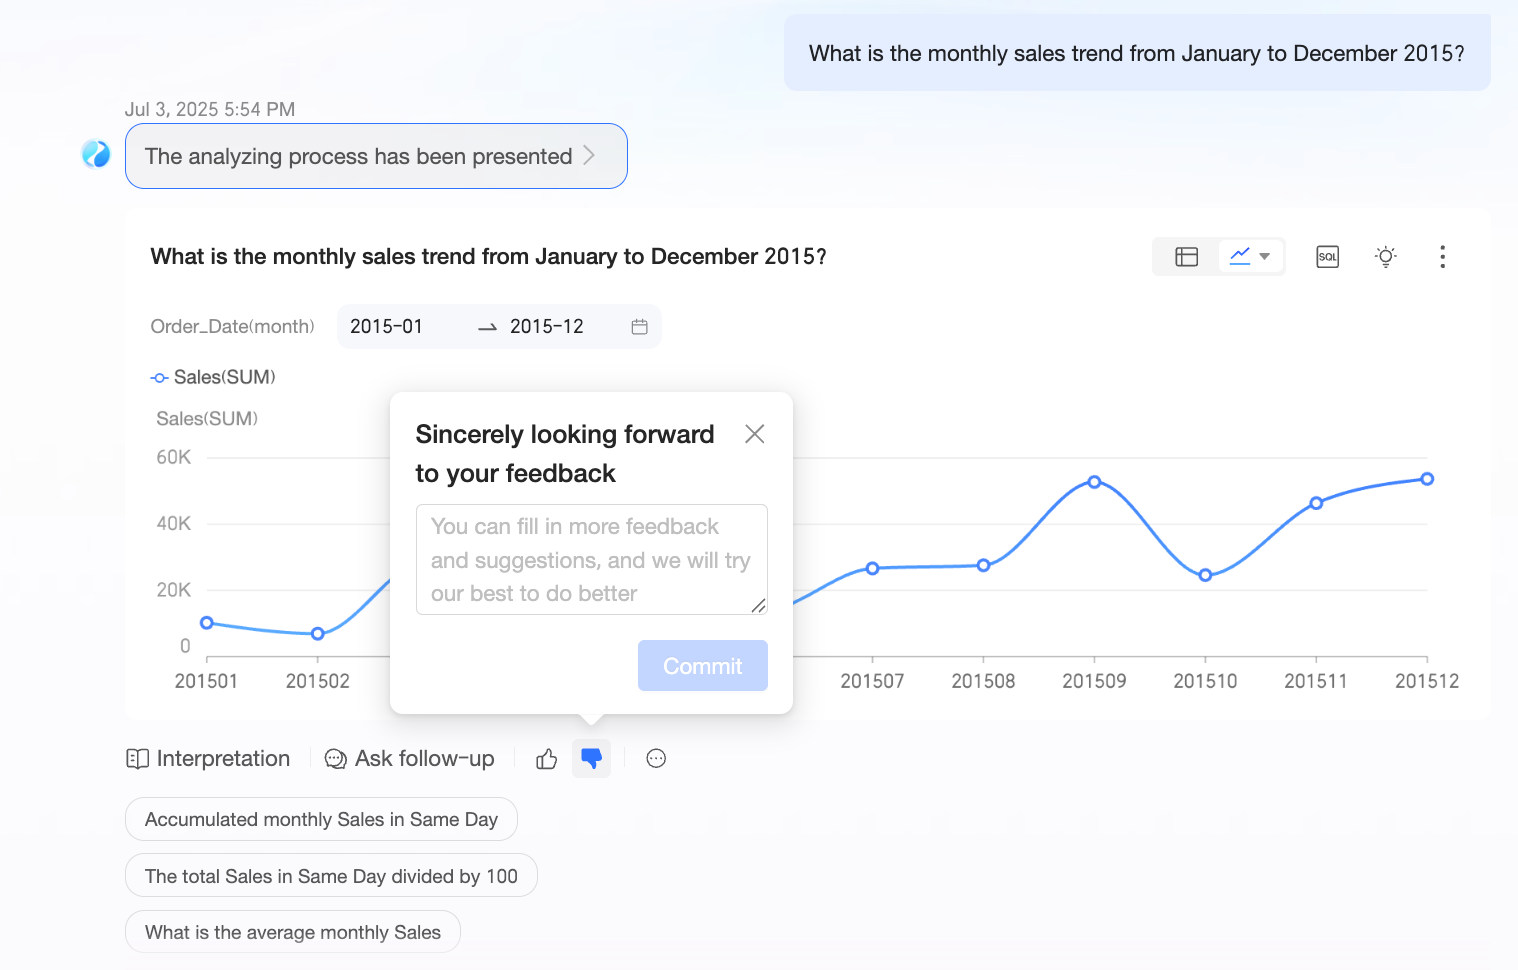
Inference and interpretation modes
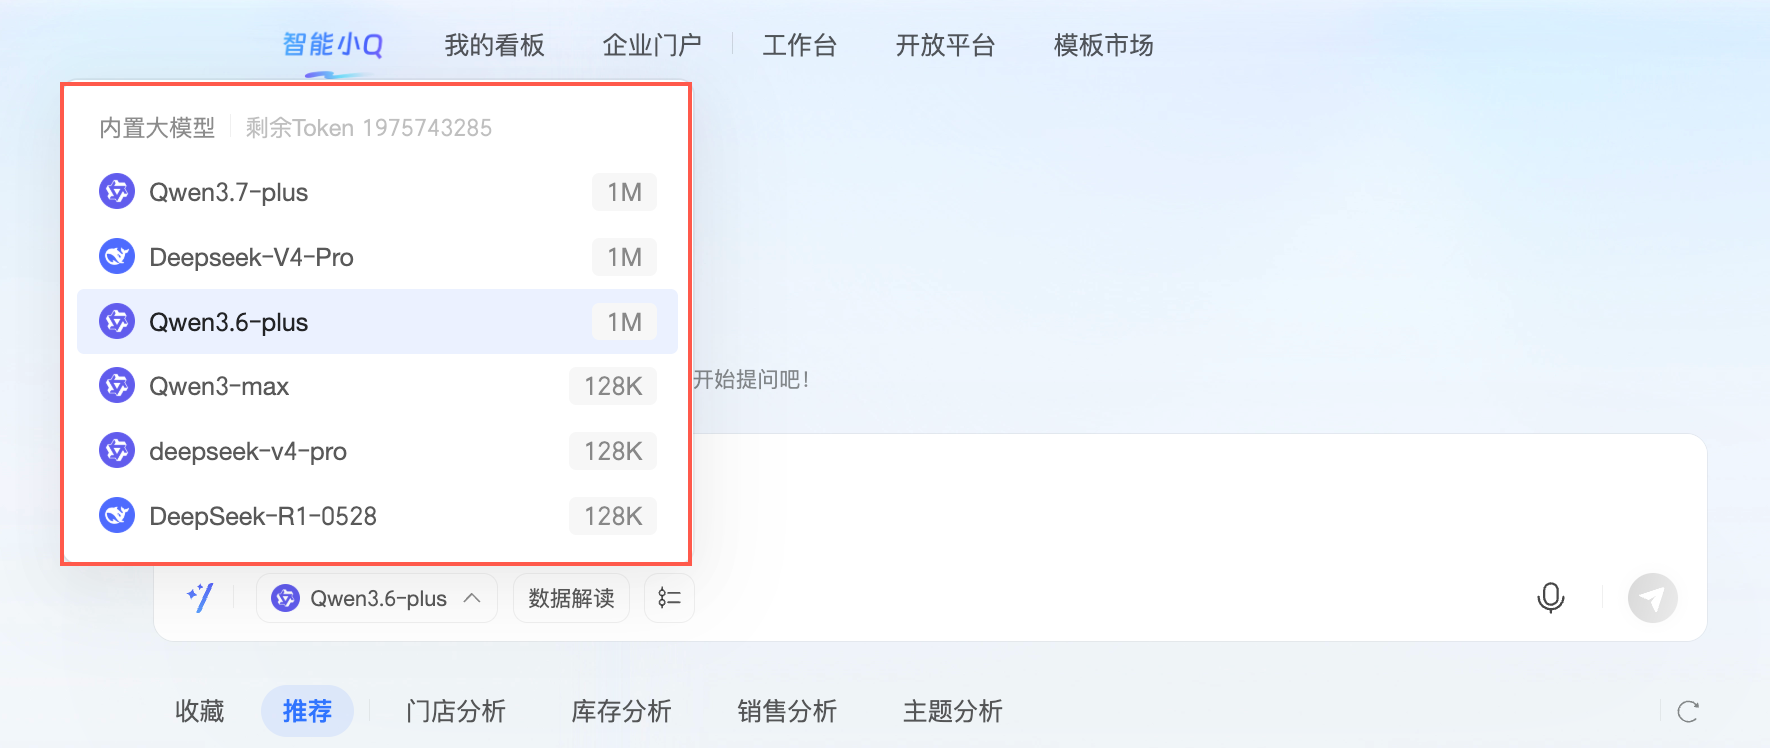
Overview
For both inference and interpretation, you can choose between a built-in large model and a custom model. Select the modes that best fit your analysis needs.
Examples
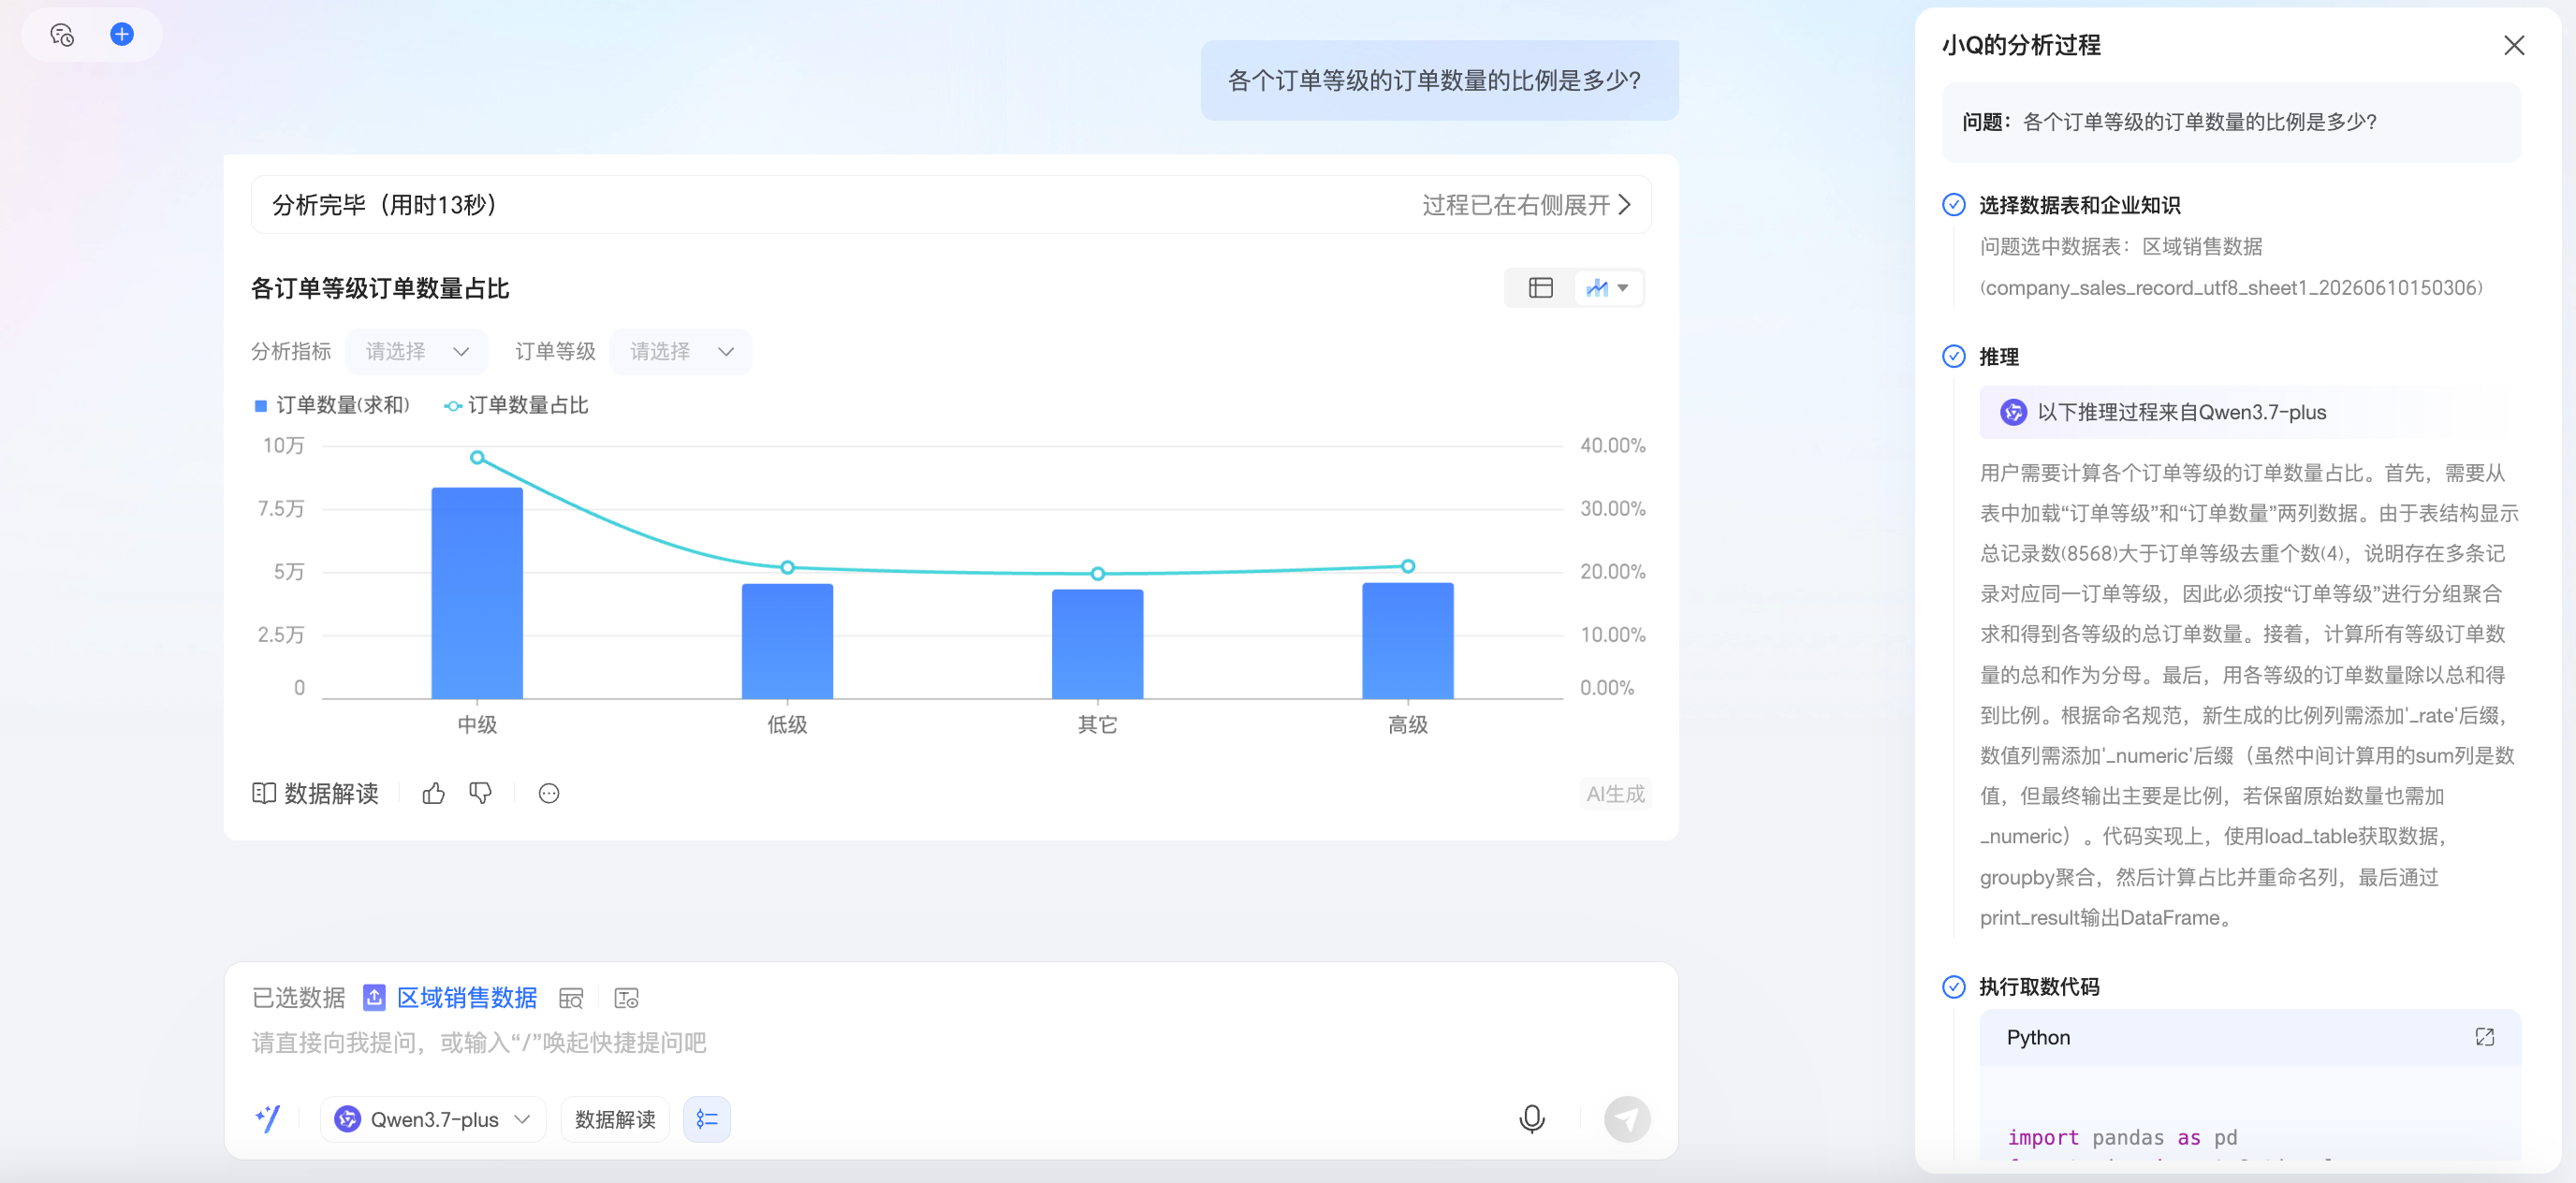
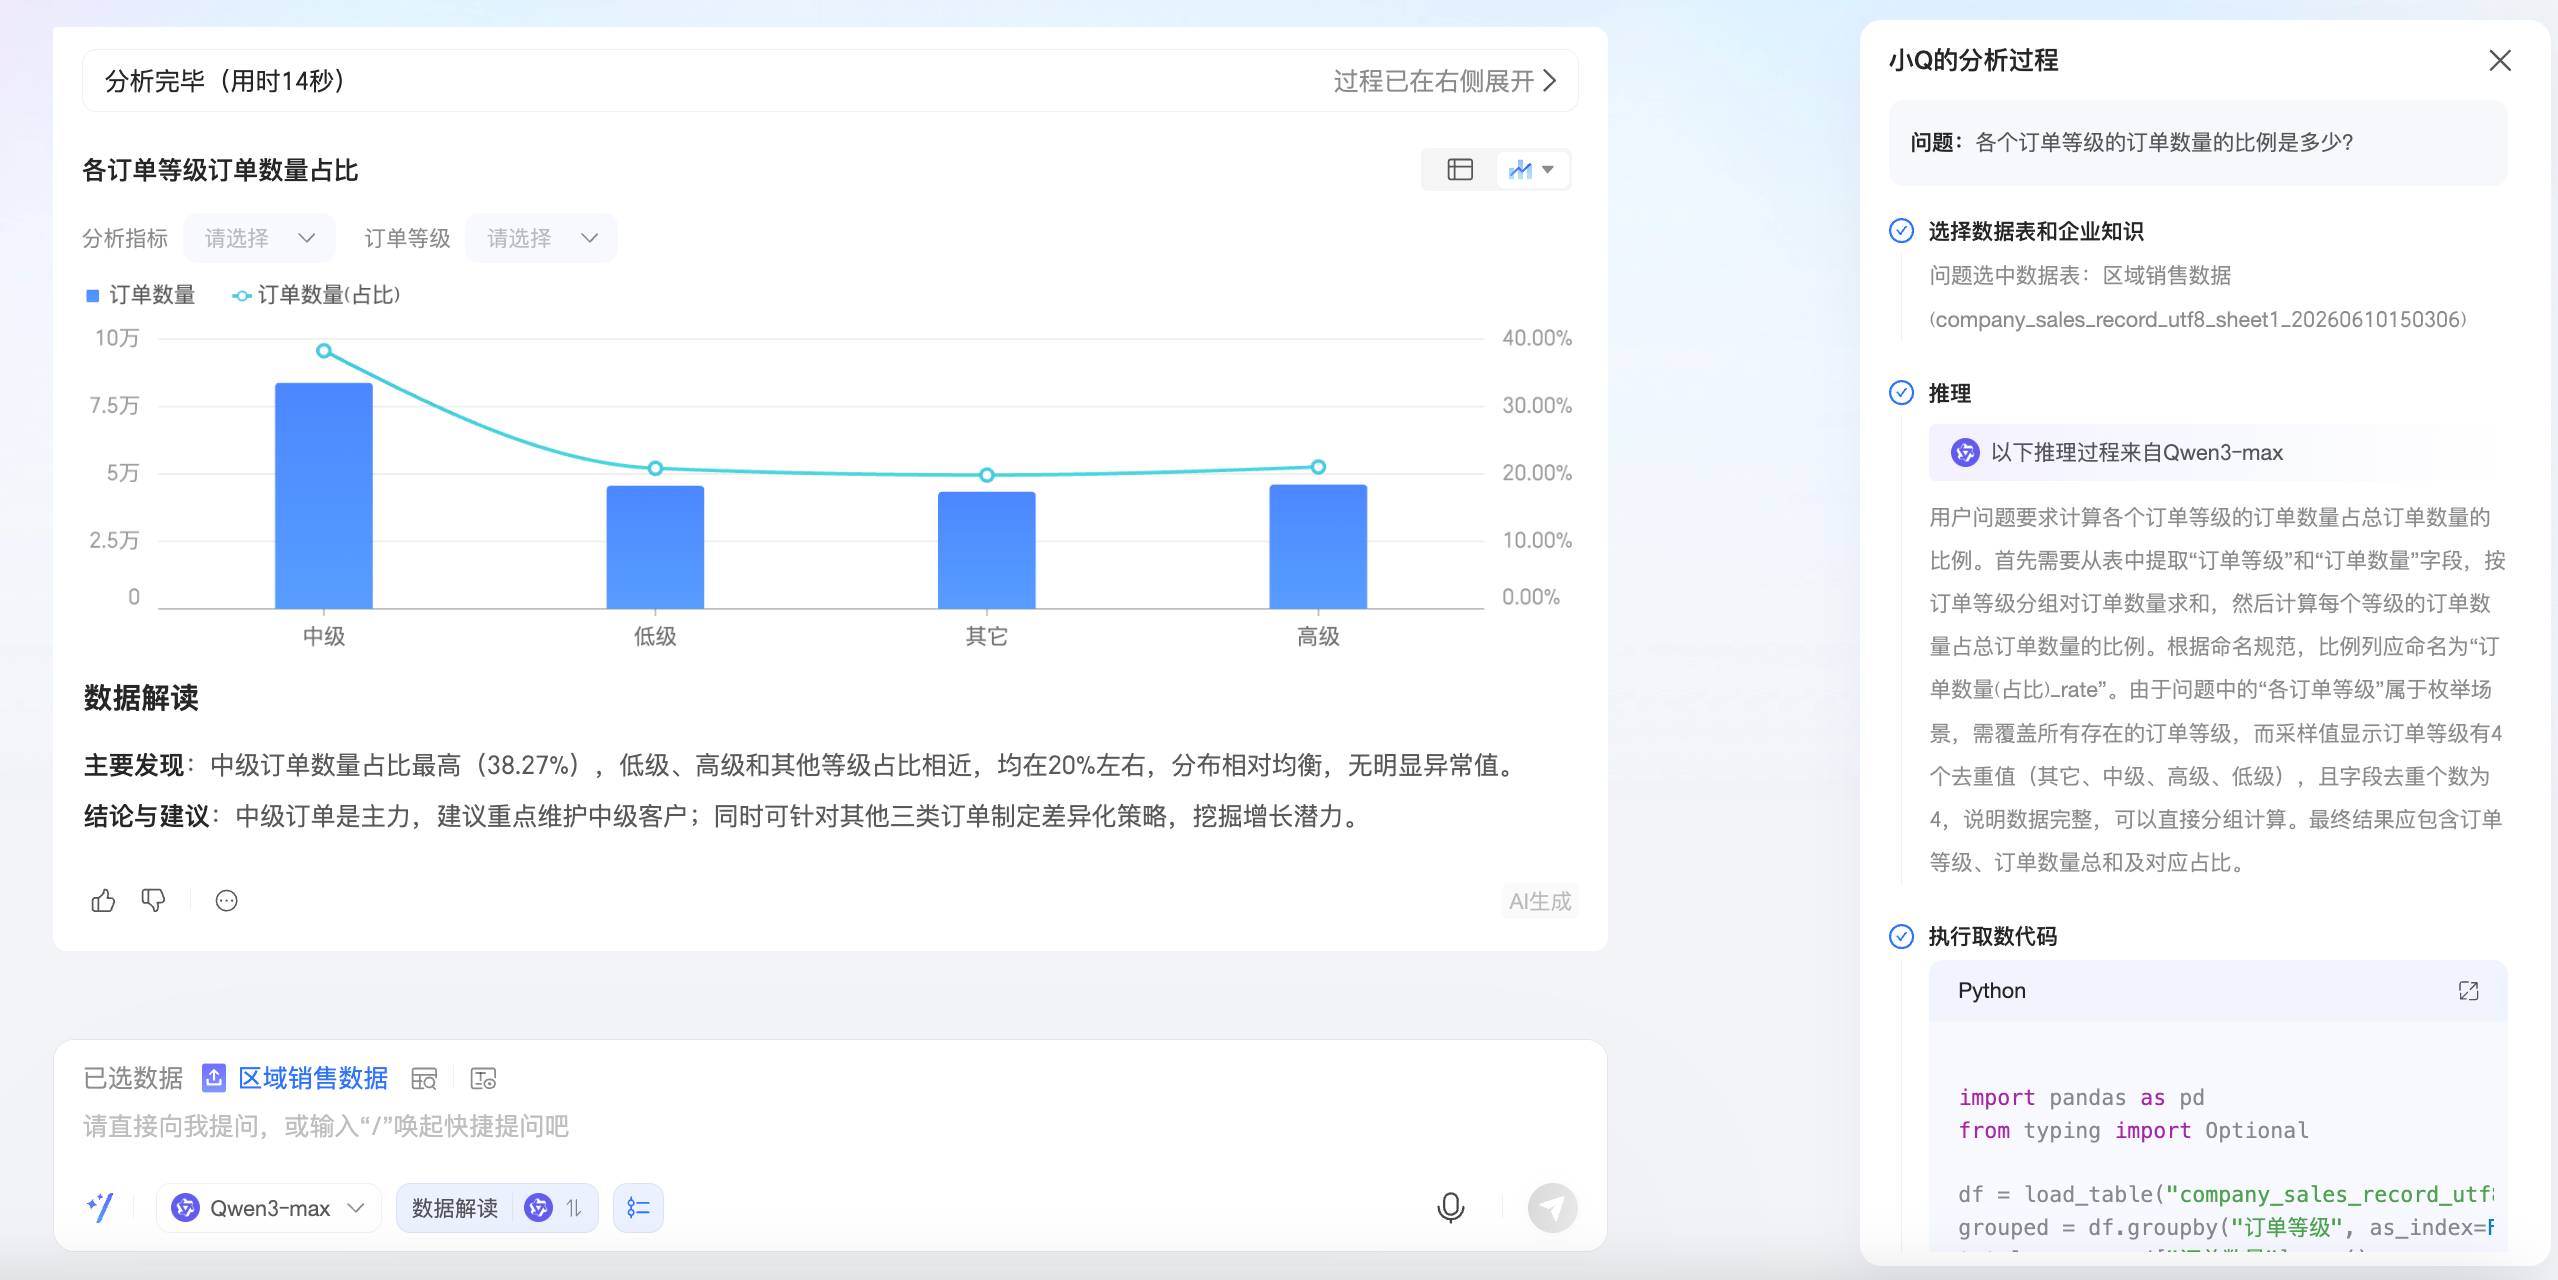
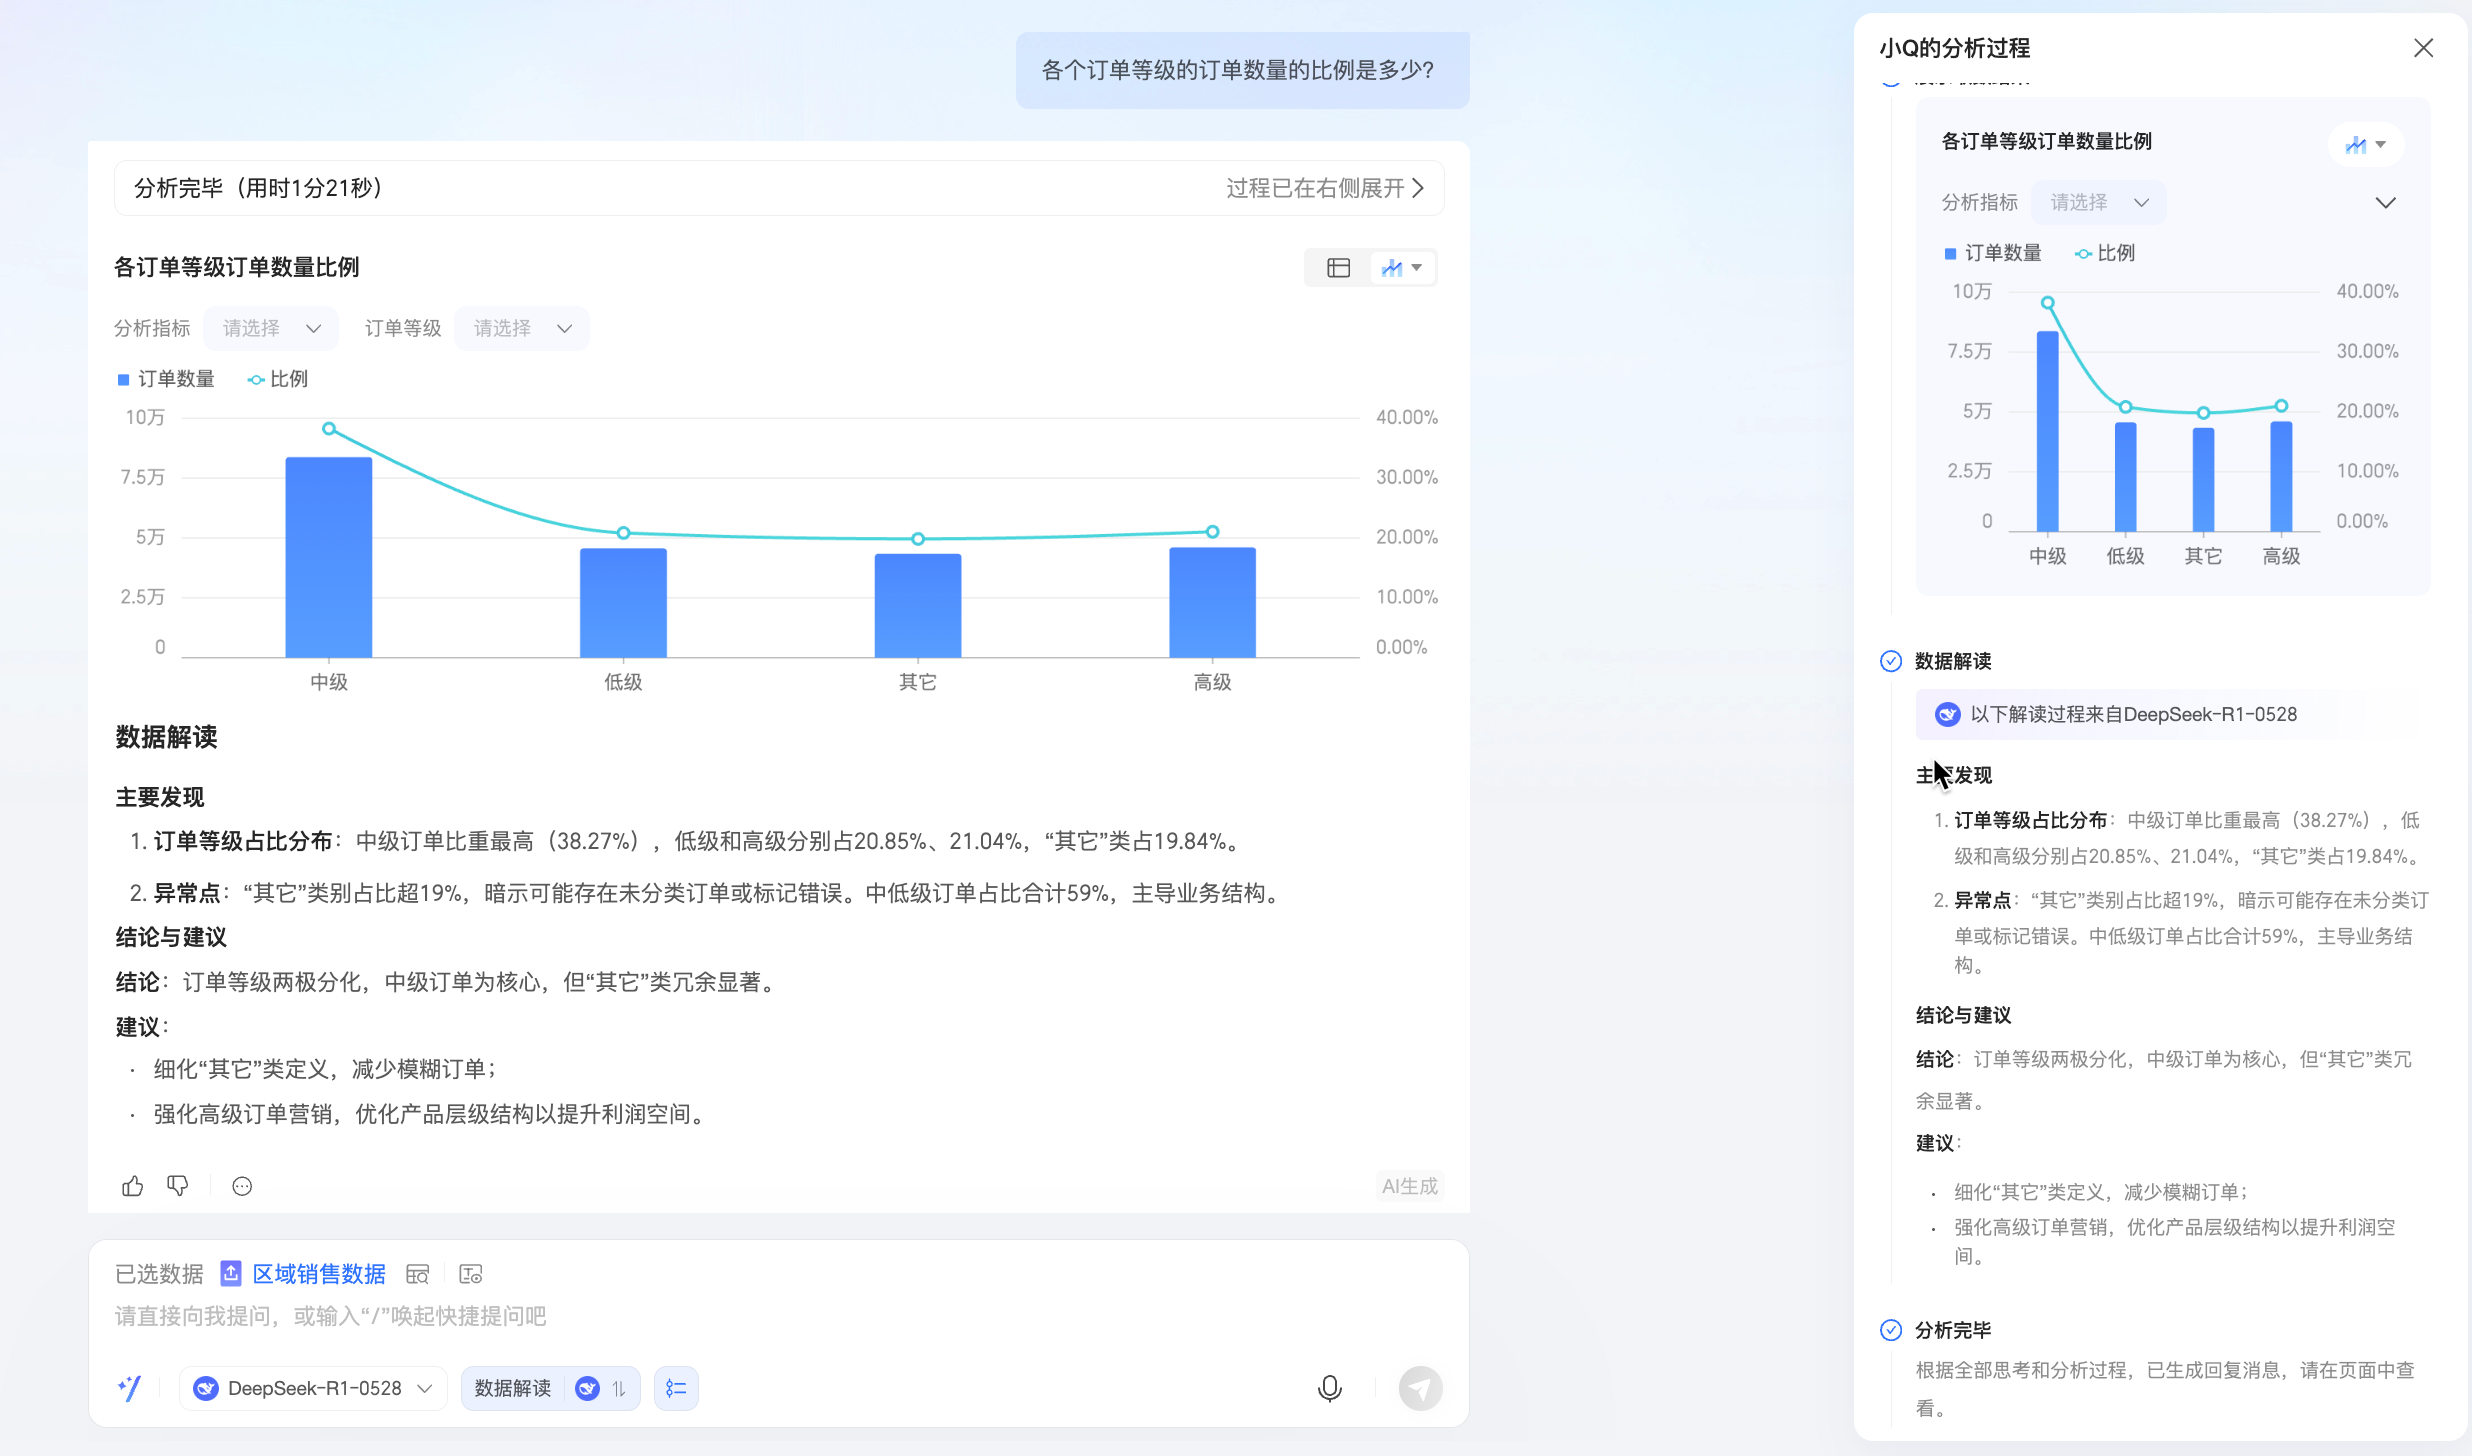
The following examples show the results of asking the question, "What is the proportion of orders for each order level?" using different inference and interpretation modes.
-
Example 1: Use Qwen3.7-plus for inference and no data interpretation.
The system uses the Qwen3.7-plus model to return the inference process and a chart.
-
Example 2: Use the built-in Qwen3-max model for both inference and data interpretation.
The system uses the Qwen3-max model to return the inference process, data interpretation, and a chart.
-
Example 3: Use the built-in DeepSeek-R1-0528 model for both inference and data interpretation.
The system uses the DeepSeek-R1-0528 model to return the inference process, data interpretation, and a chart.
Intelligent planning mode
With intelligent planning enabled, Intelligent Data Assistant Q can handle multi-step complex questions and multi-turn conversations.

-
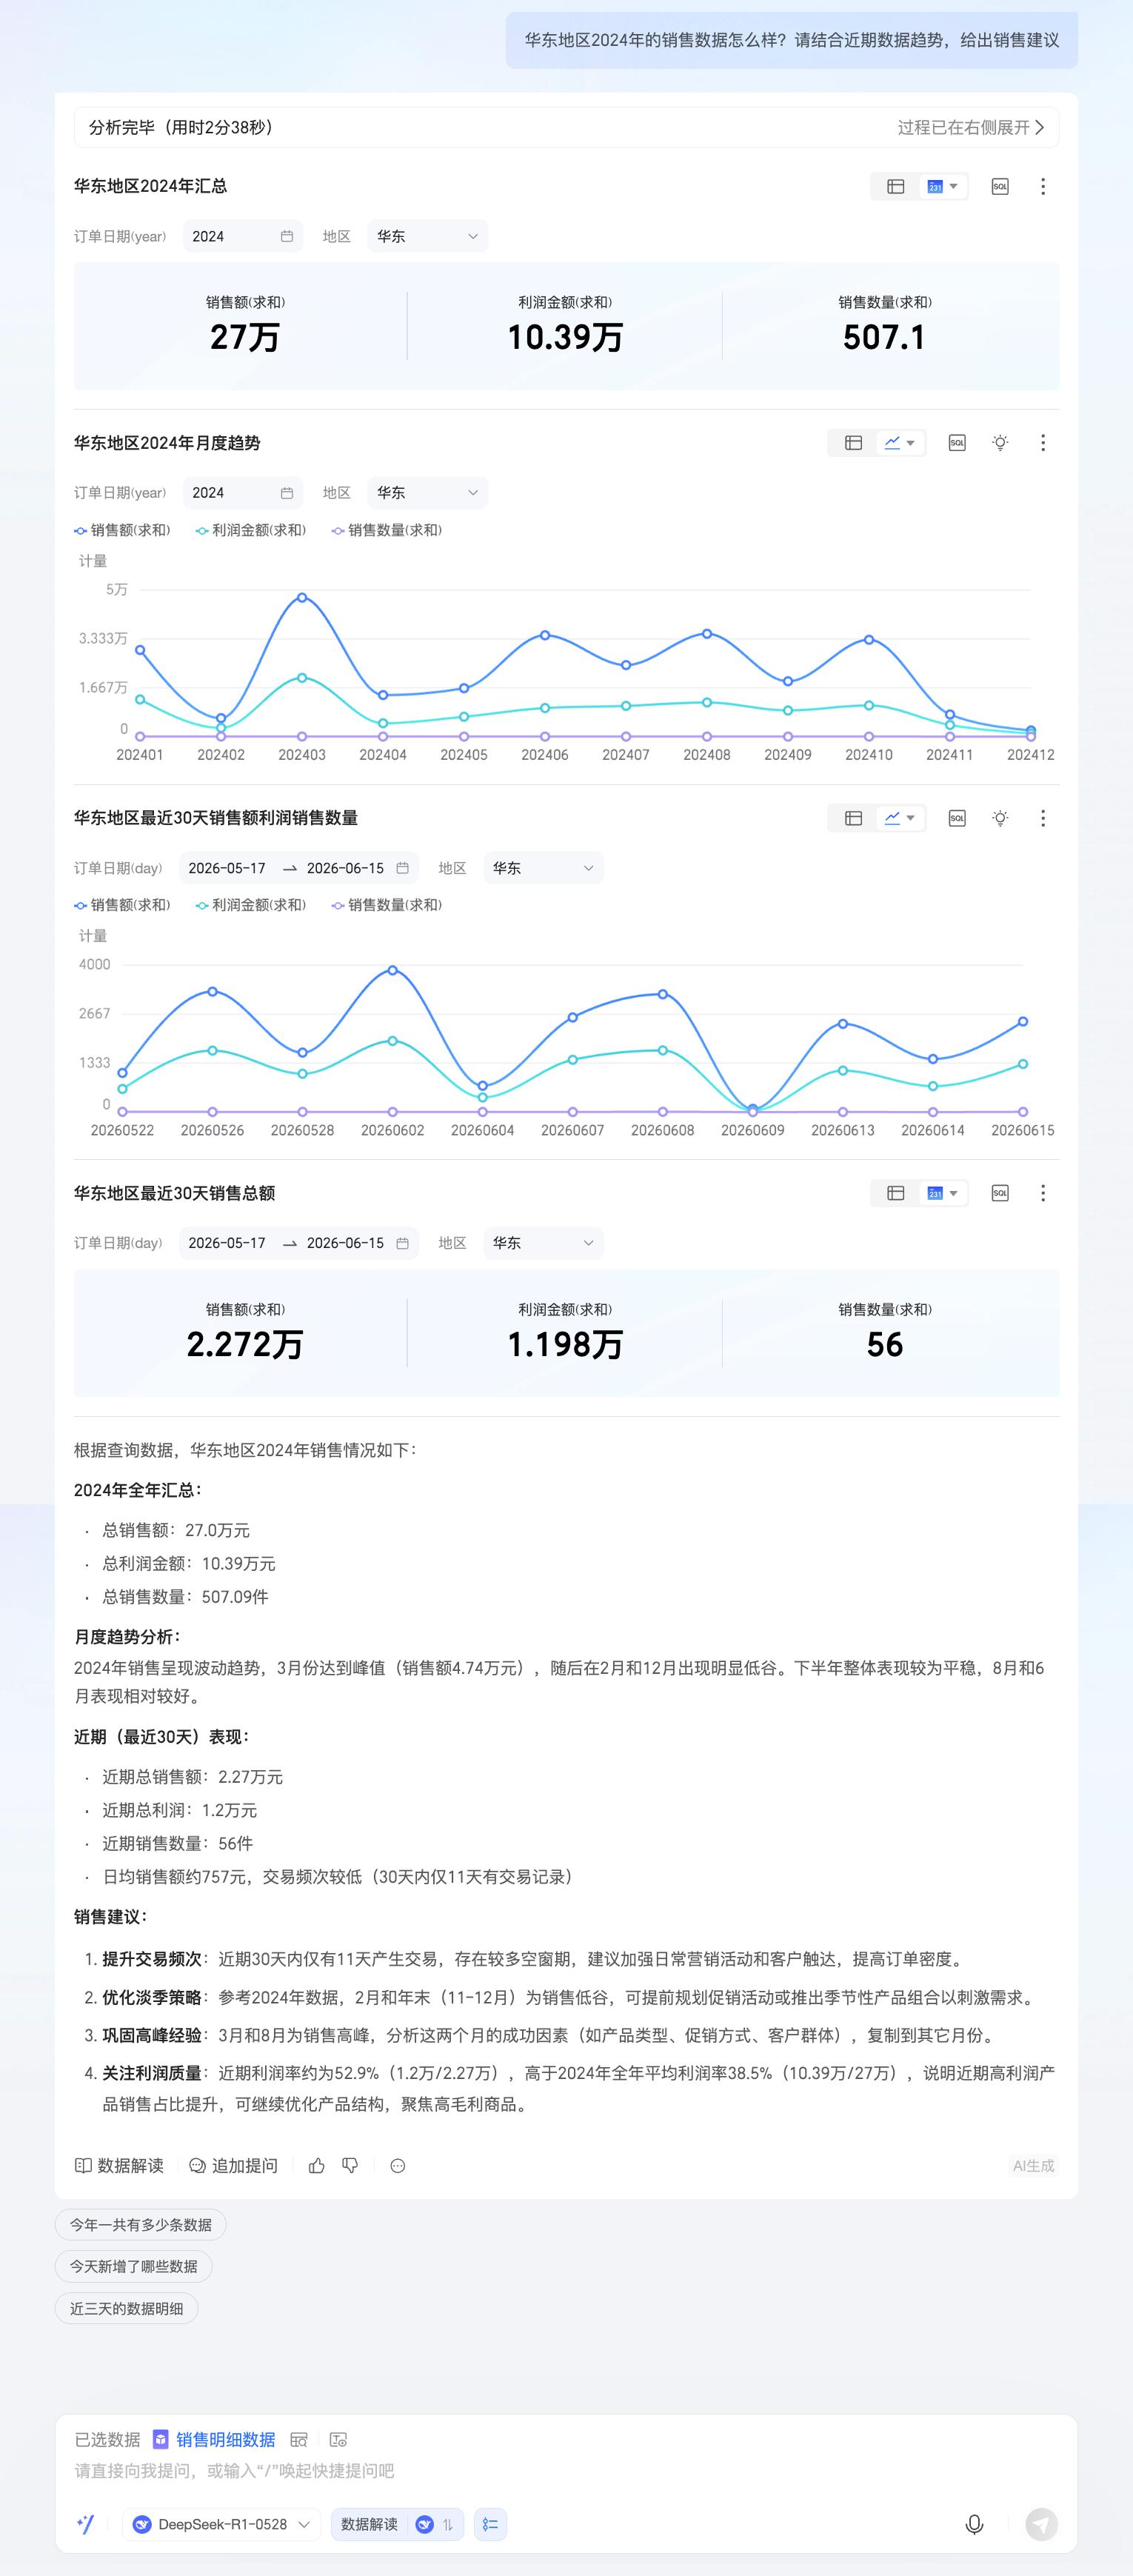
Enable intelligent planning mode to answer a multi-step complex question.
Ask a question like, "How were the sales in East China in 2024? Provide sales suggestions based on recent data trends." The system integrates the data results and provides recommendations.
-
Enable intelligent planning mode to have a multi-turn conversation.
First, ask, "Which province had the highest sales in 2024?". After getting the result, switch datasets and then ask, "What is the top-selling product in this province?". The system automatically carries over the context from the previous turn and provides an answer.
After you obtain the query result, switch the dataset and enter "What is the name of the best-selling product in this province?". The system will then automatically carry over the context from the previous conversation and return a result.
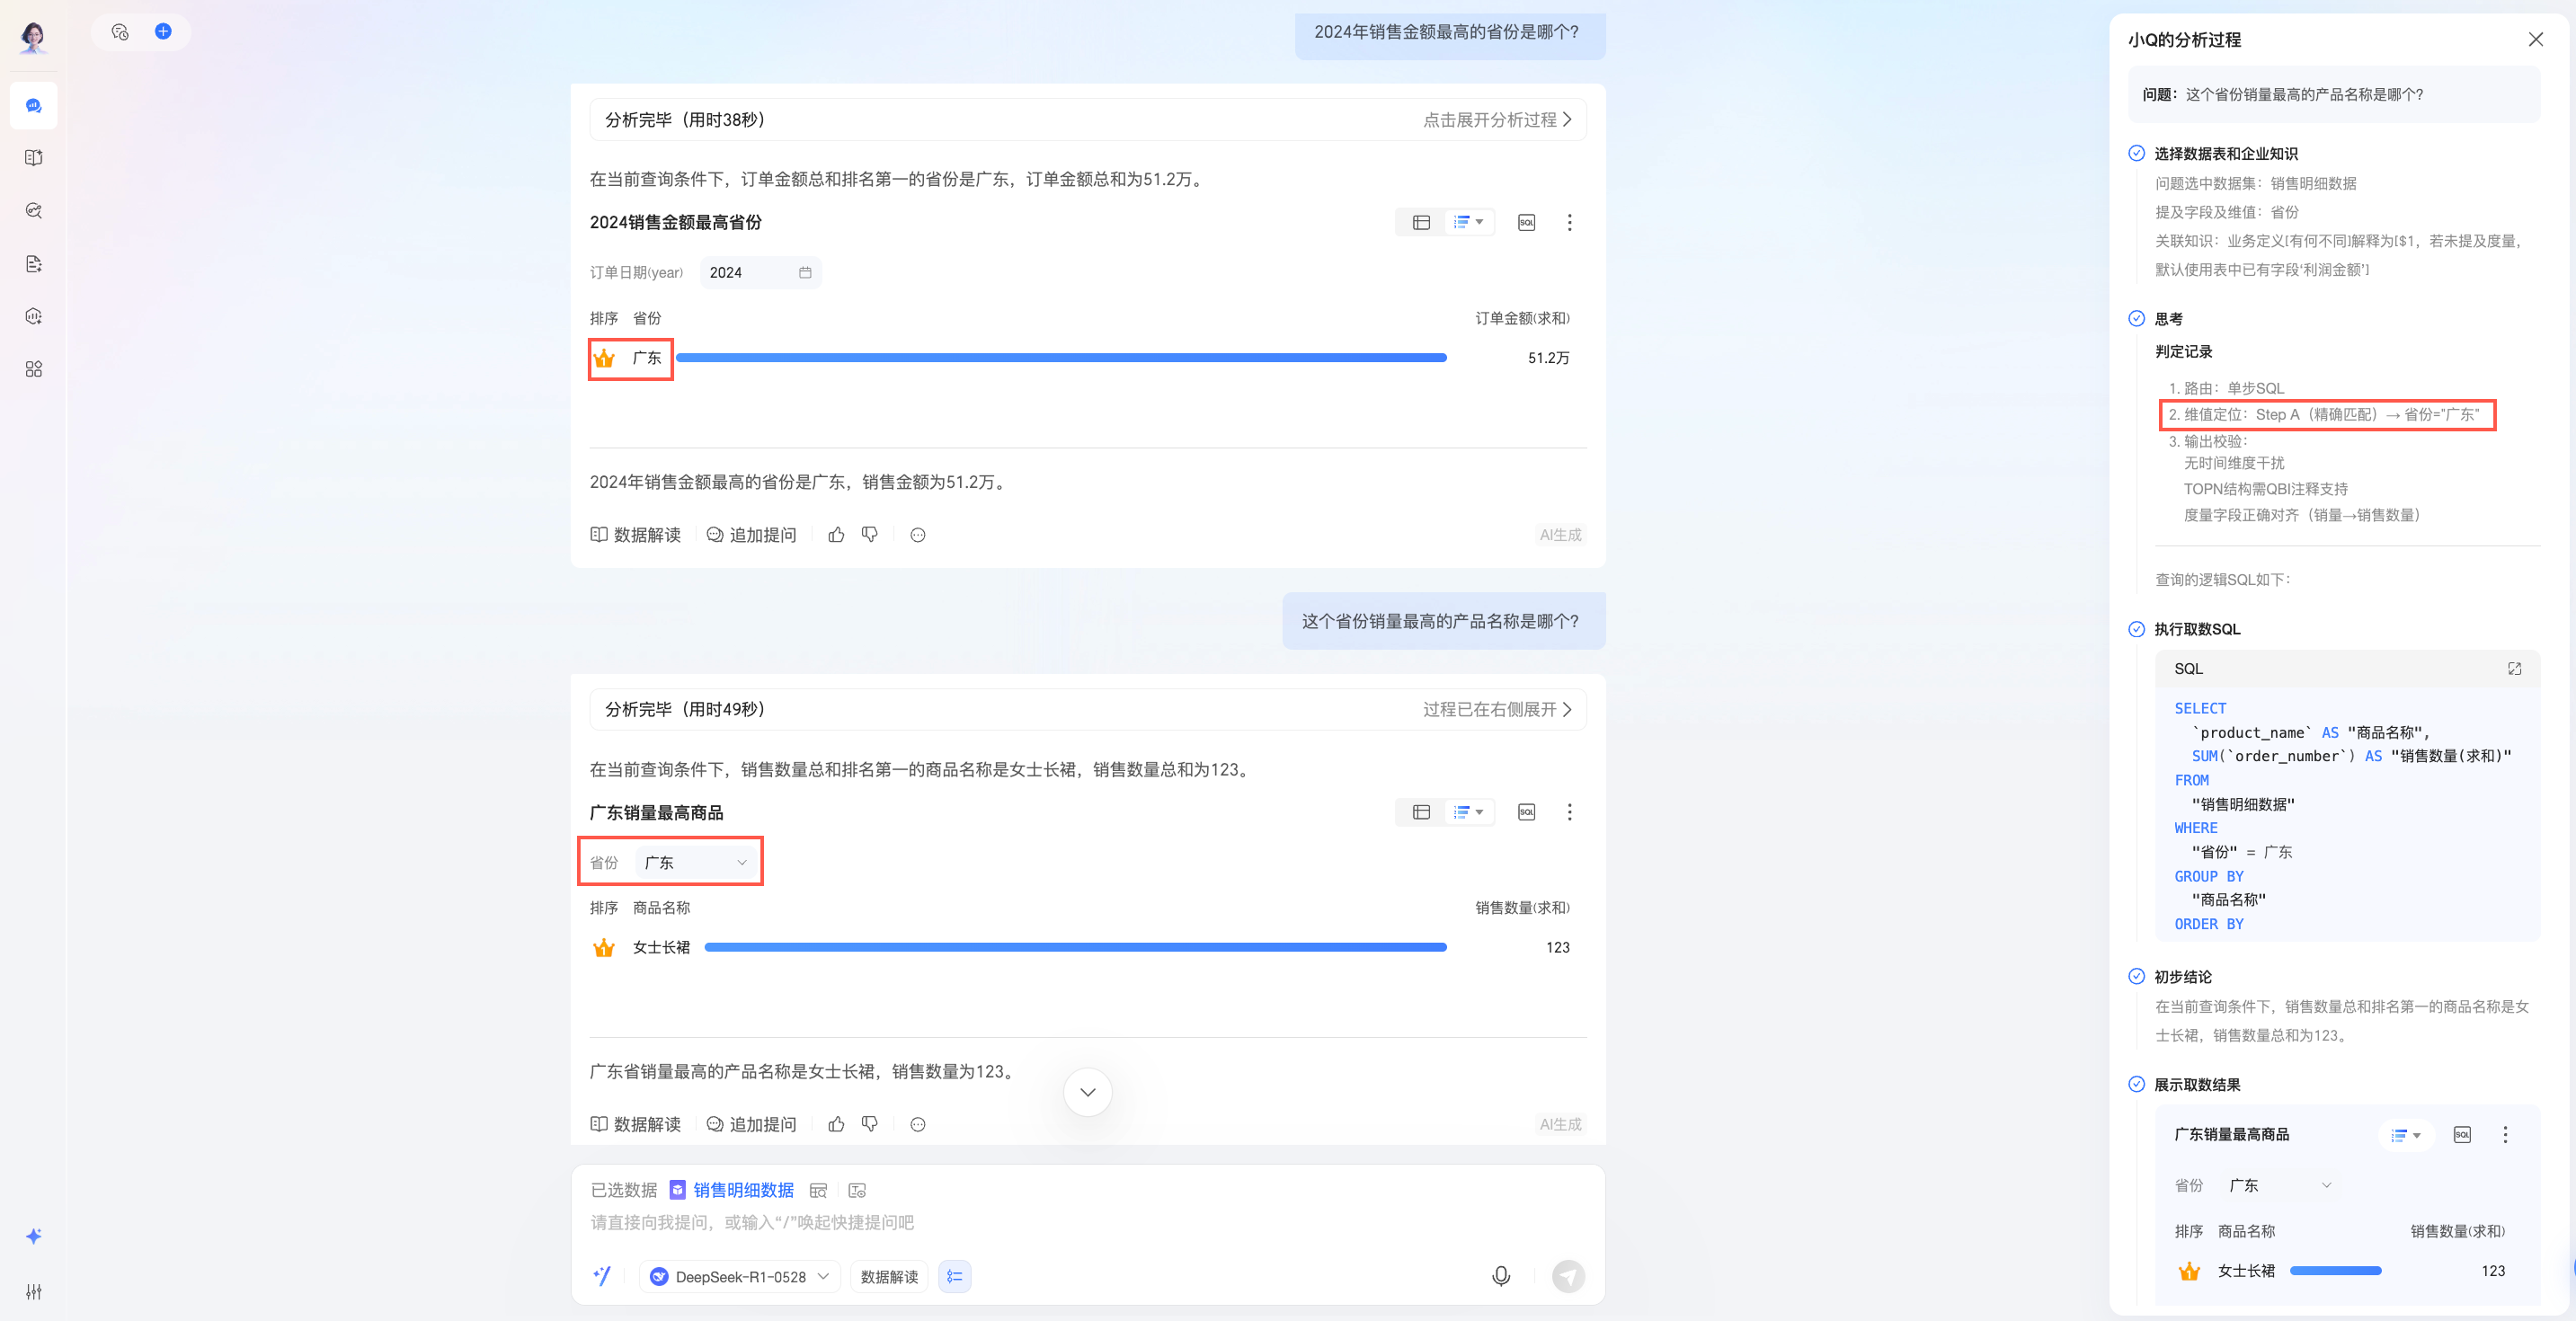
Ask a follow-up question
Follow-up questions let you drill deeper into a previous result for more precise data exploration.
You can ask only one follow-up question for each original question.
-
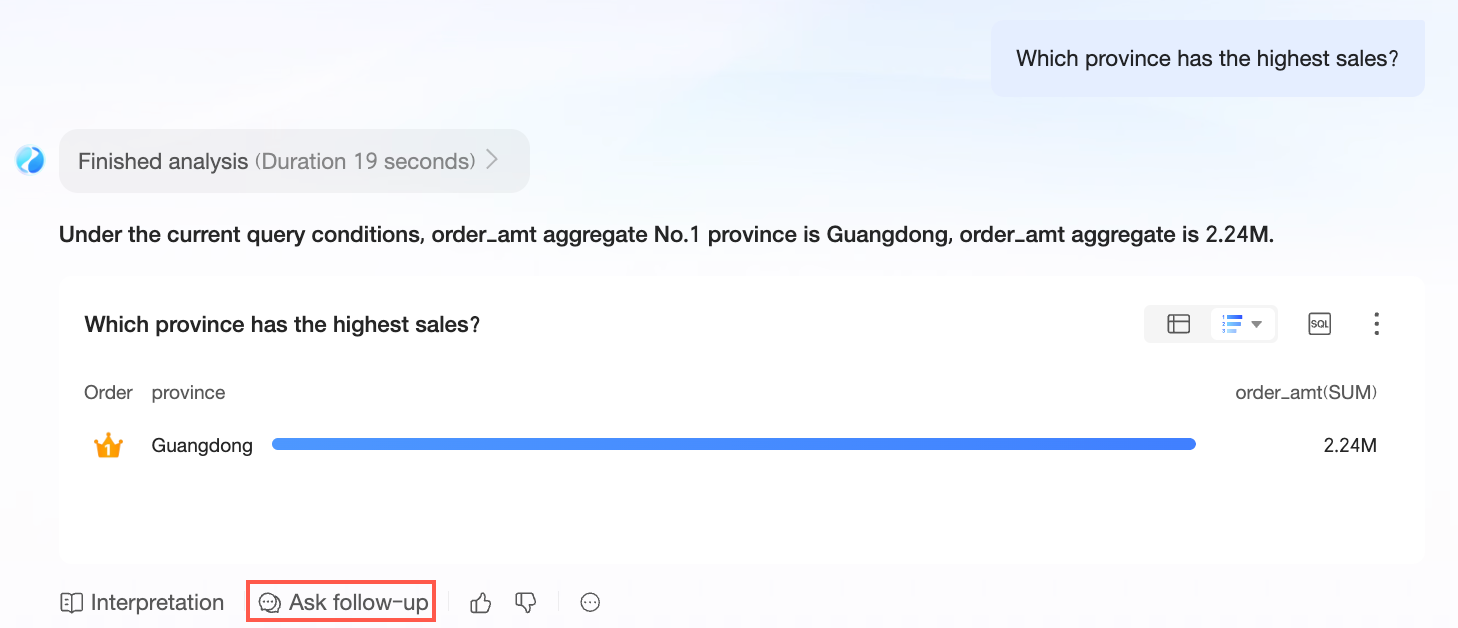
In the conversation interface, click Follow-up Question to ask for more details about the previous question, "Which province has the highest sales?"
-
Enter your follow-up question based on your needs, for example, "What is the top-selling product?".
Click the
icon in the lower-right corner of the chat box or press Enter to send the question and get the analysis result.NoteThe system automatically exits the follow-up question mode. If you want to ask another follow-up question, you must click the Follow-up Question button again.
 icon in the lower-right corner of the chat box or press Enter to send the question and get the analysis result.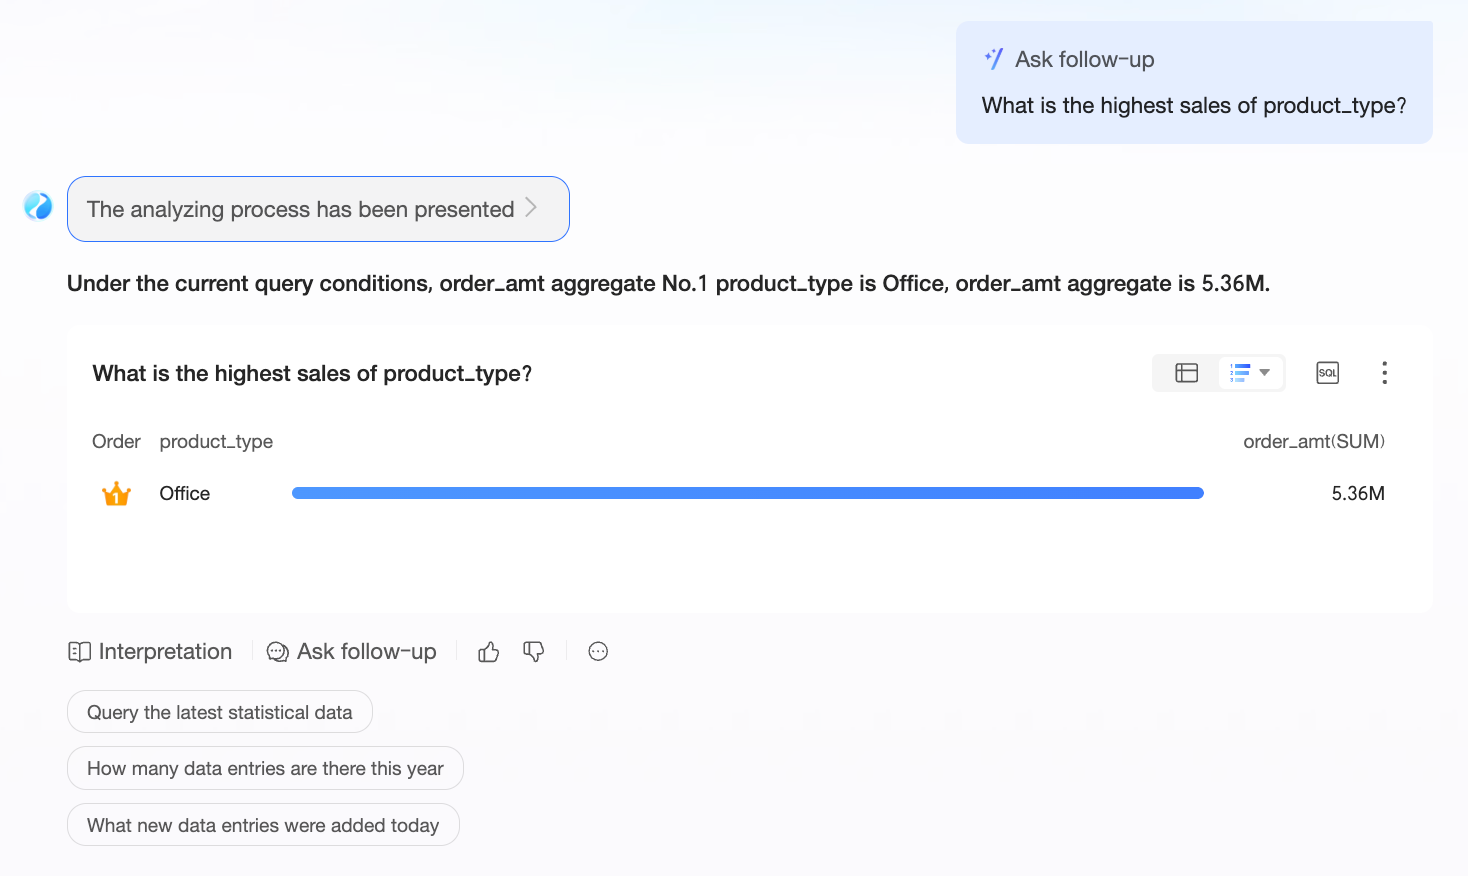
Conversation list
-
Click the
icon in the upper-left corner to view your conversation history. -
Click the
icon to start a new conversation with Intelligent Data Assistant Q.
 icon in the upper-left corner to view your conversation history.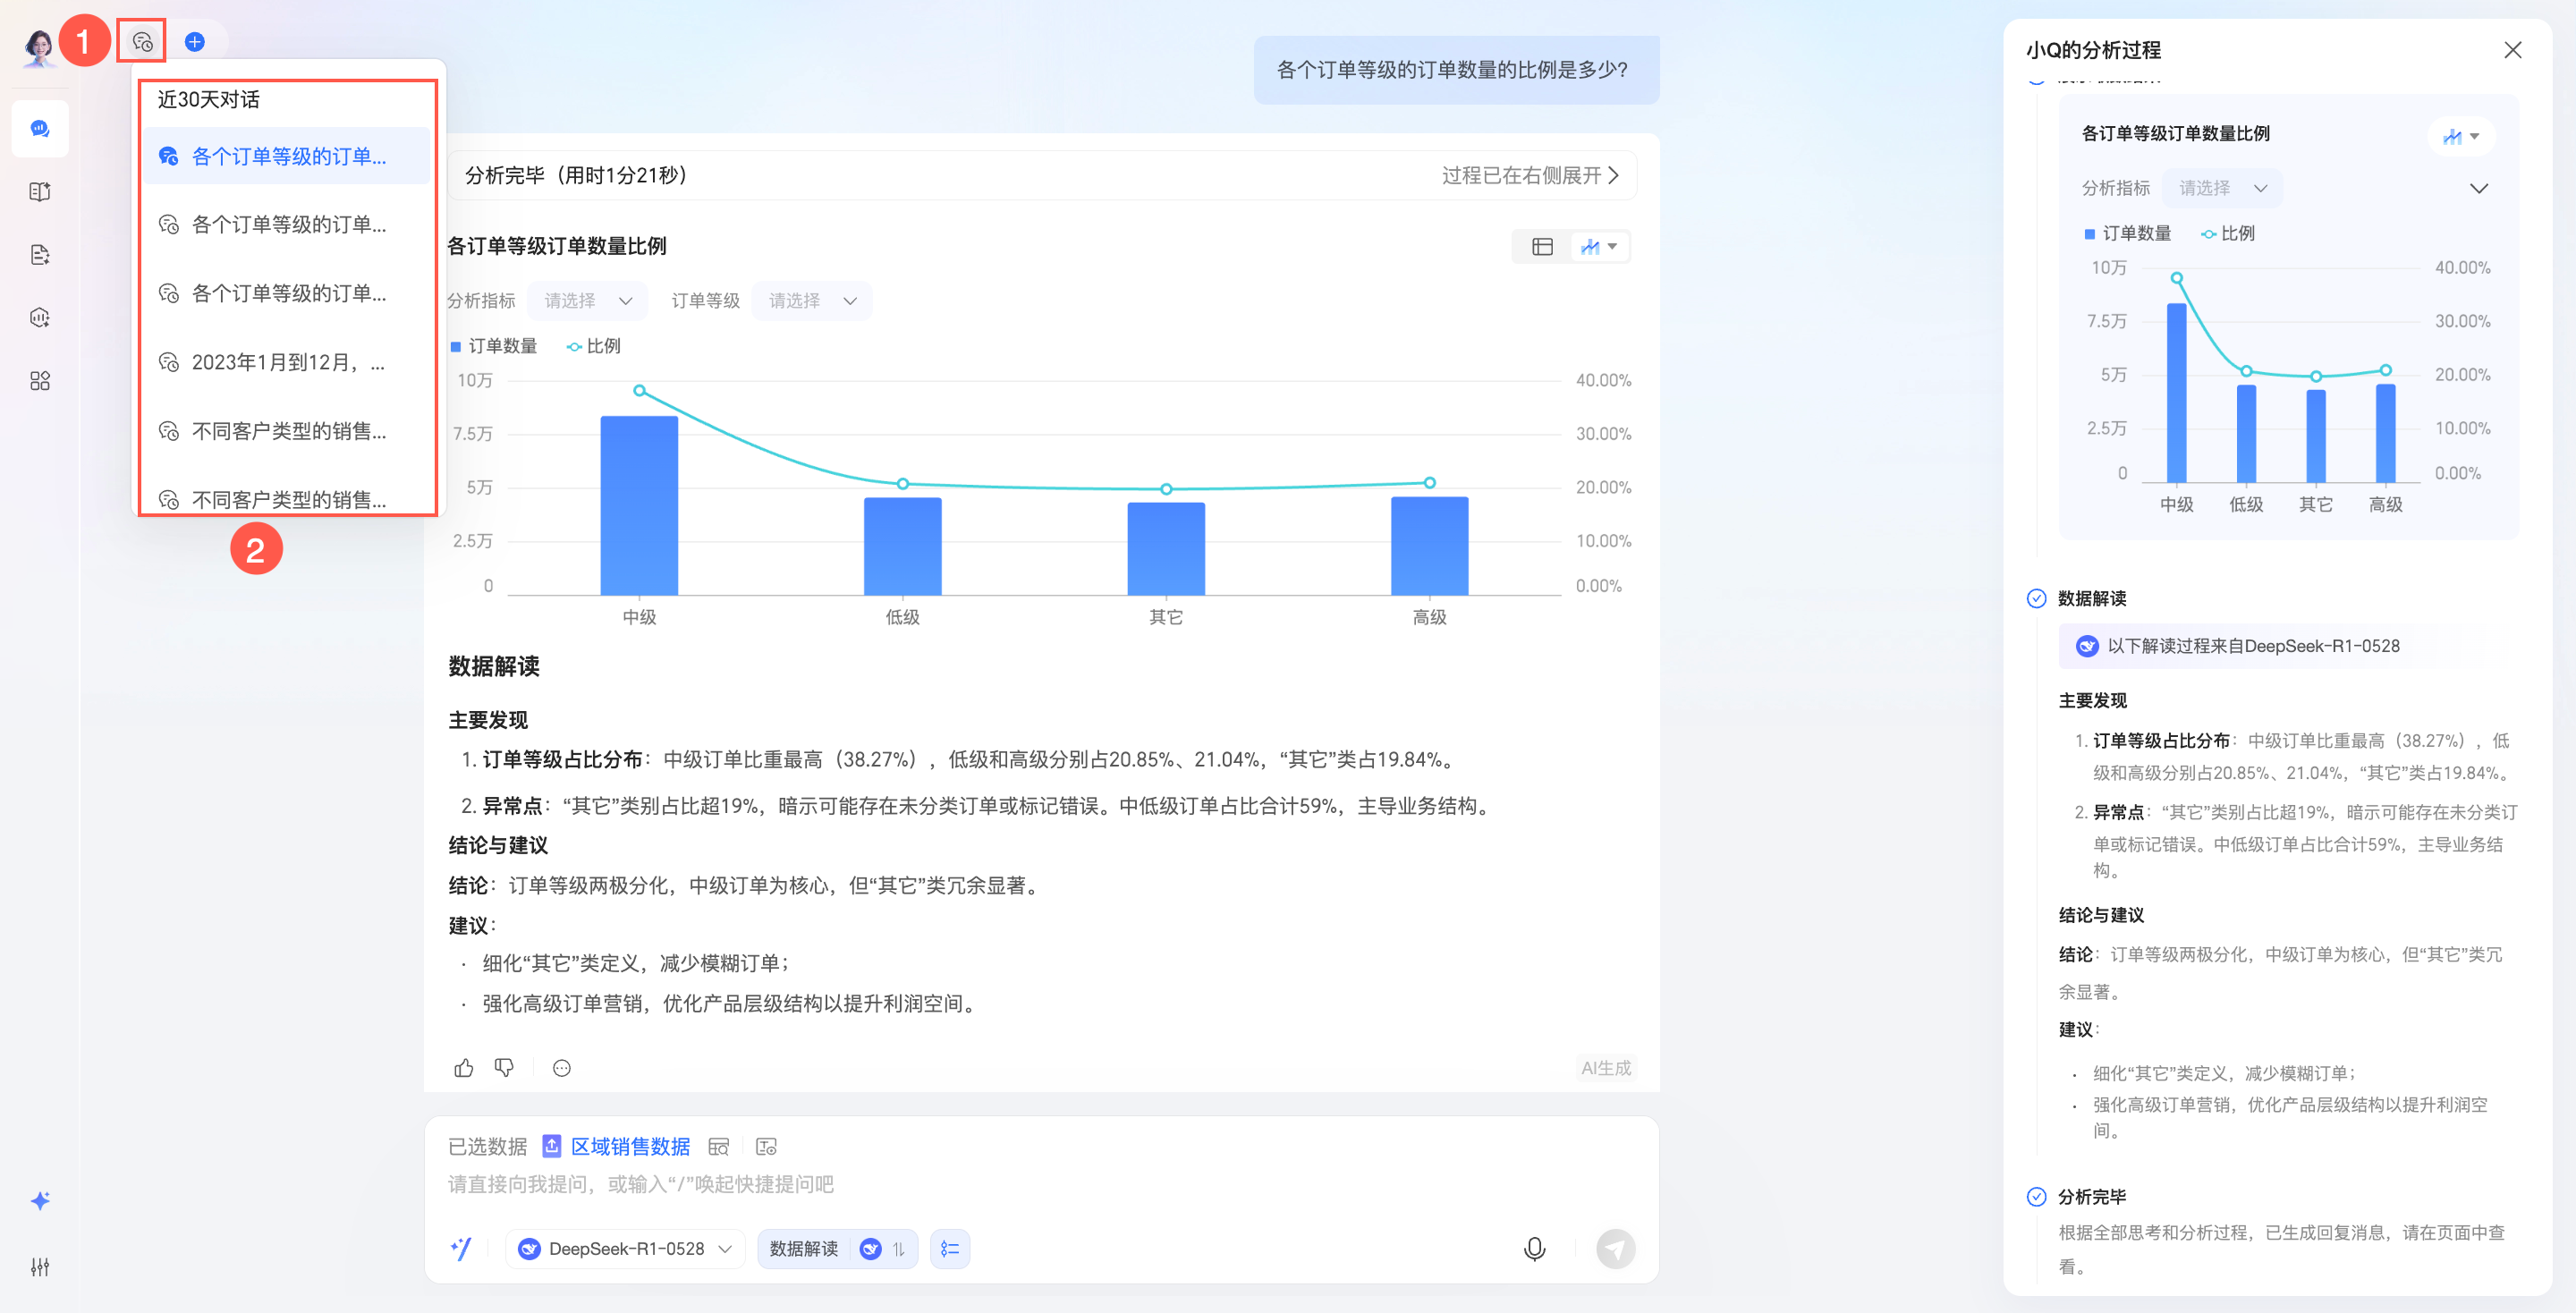
 icon to start a new conversation with Intelligent Data Assistant Q.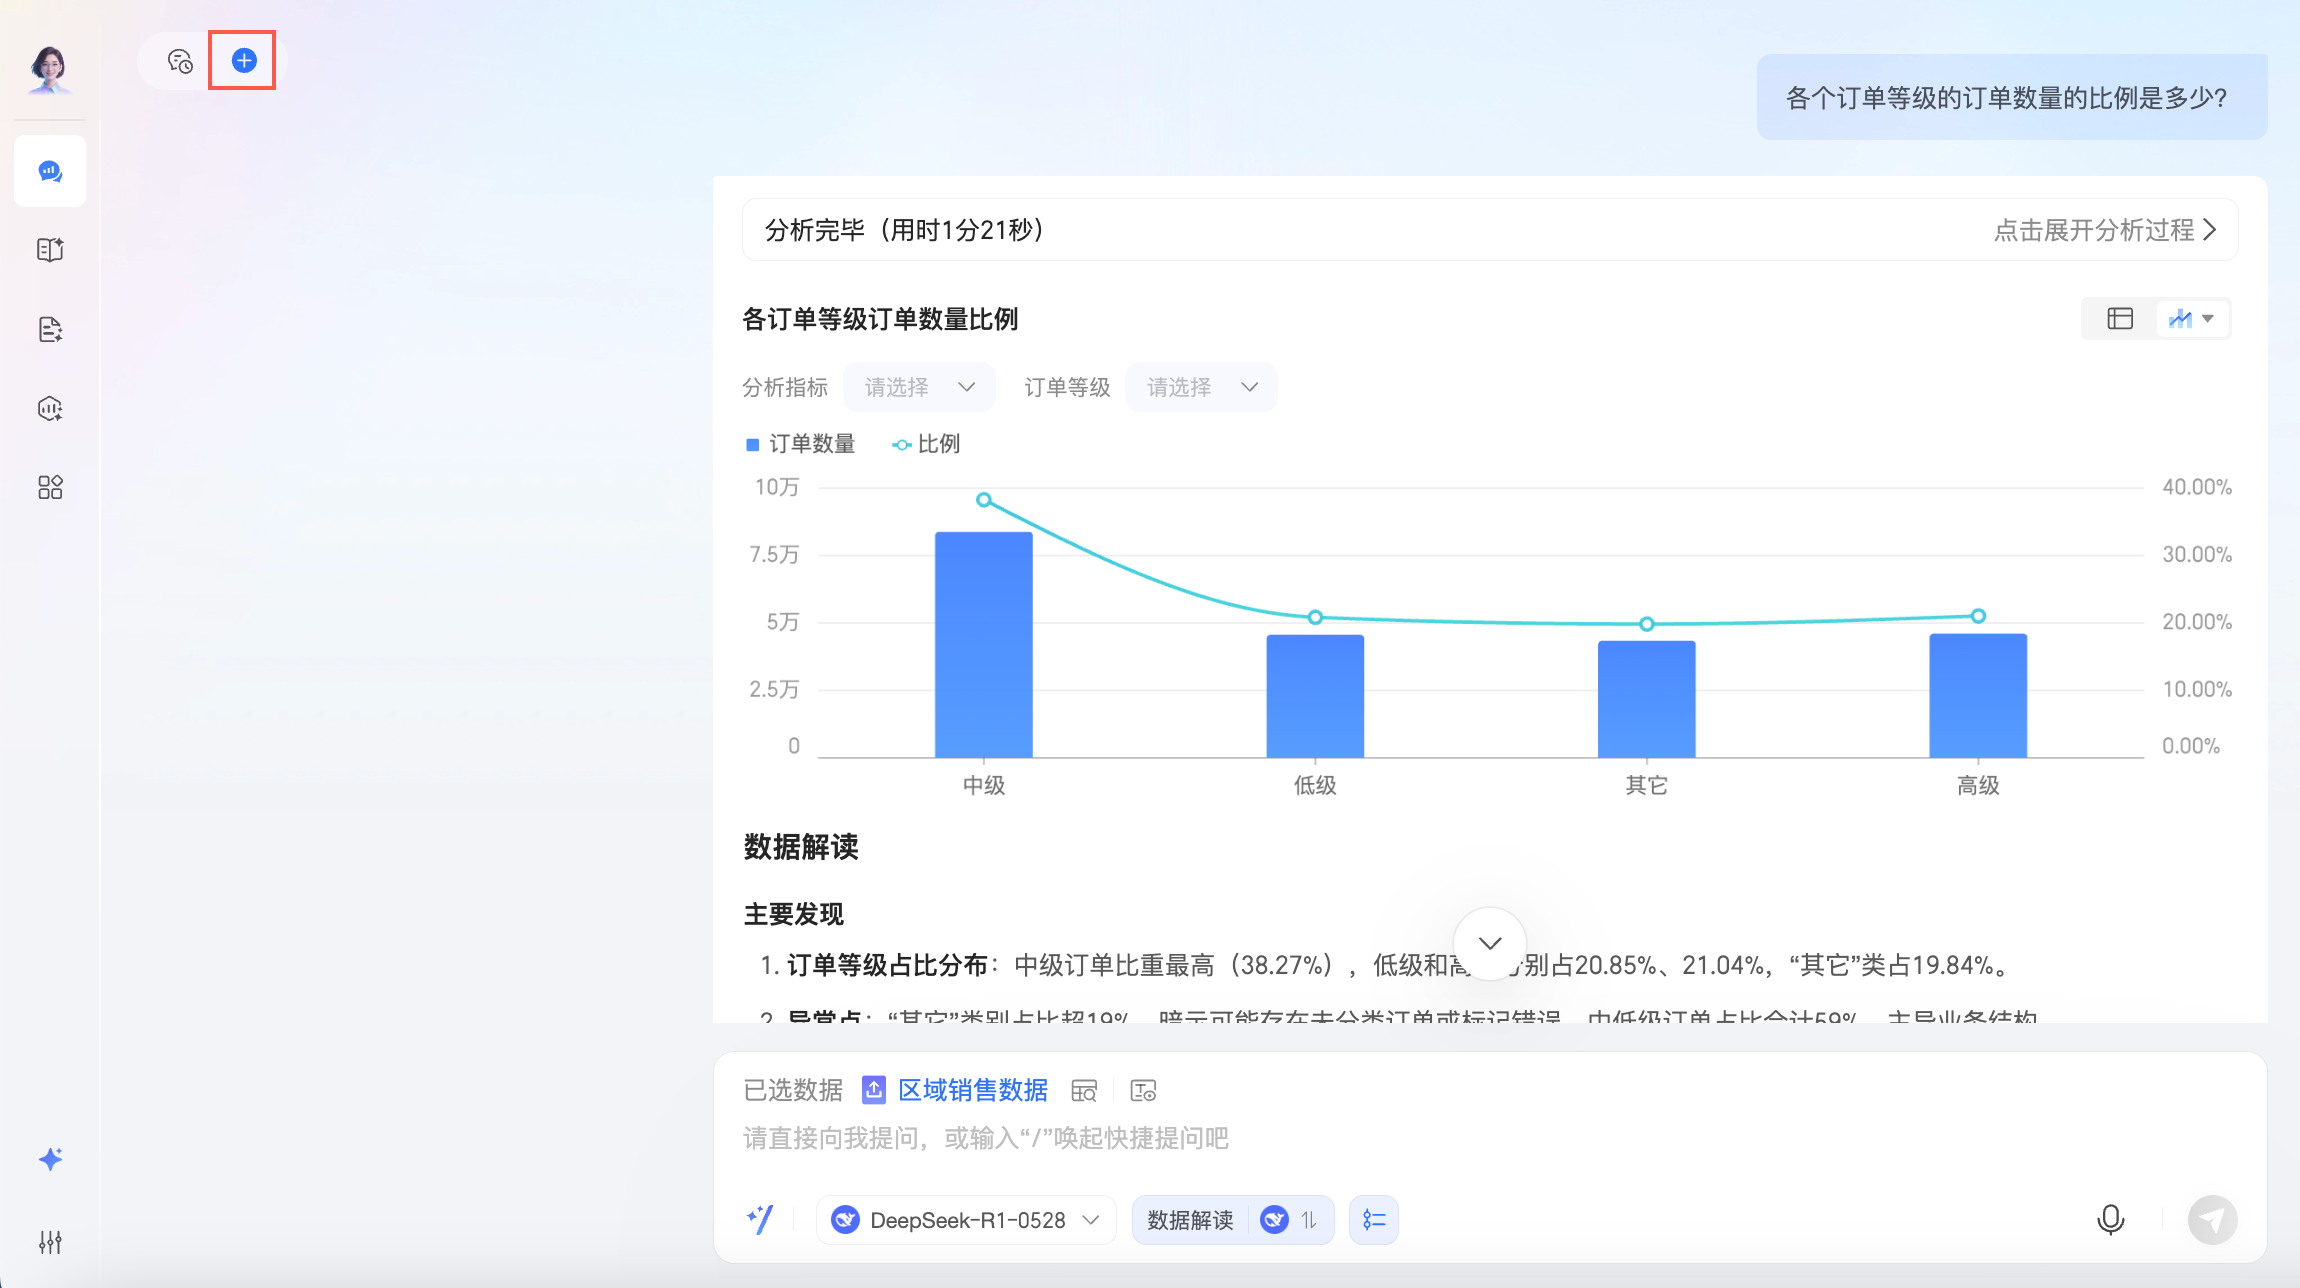
Mobile client
-
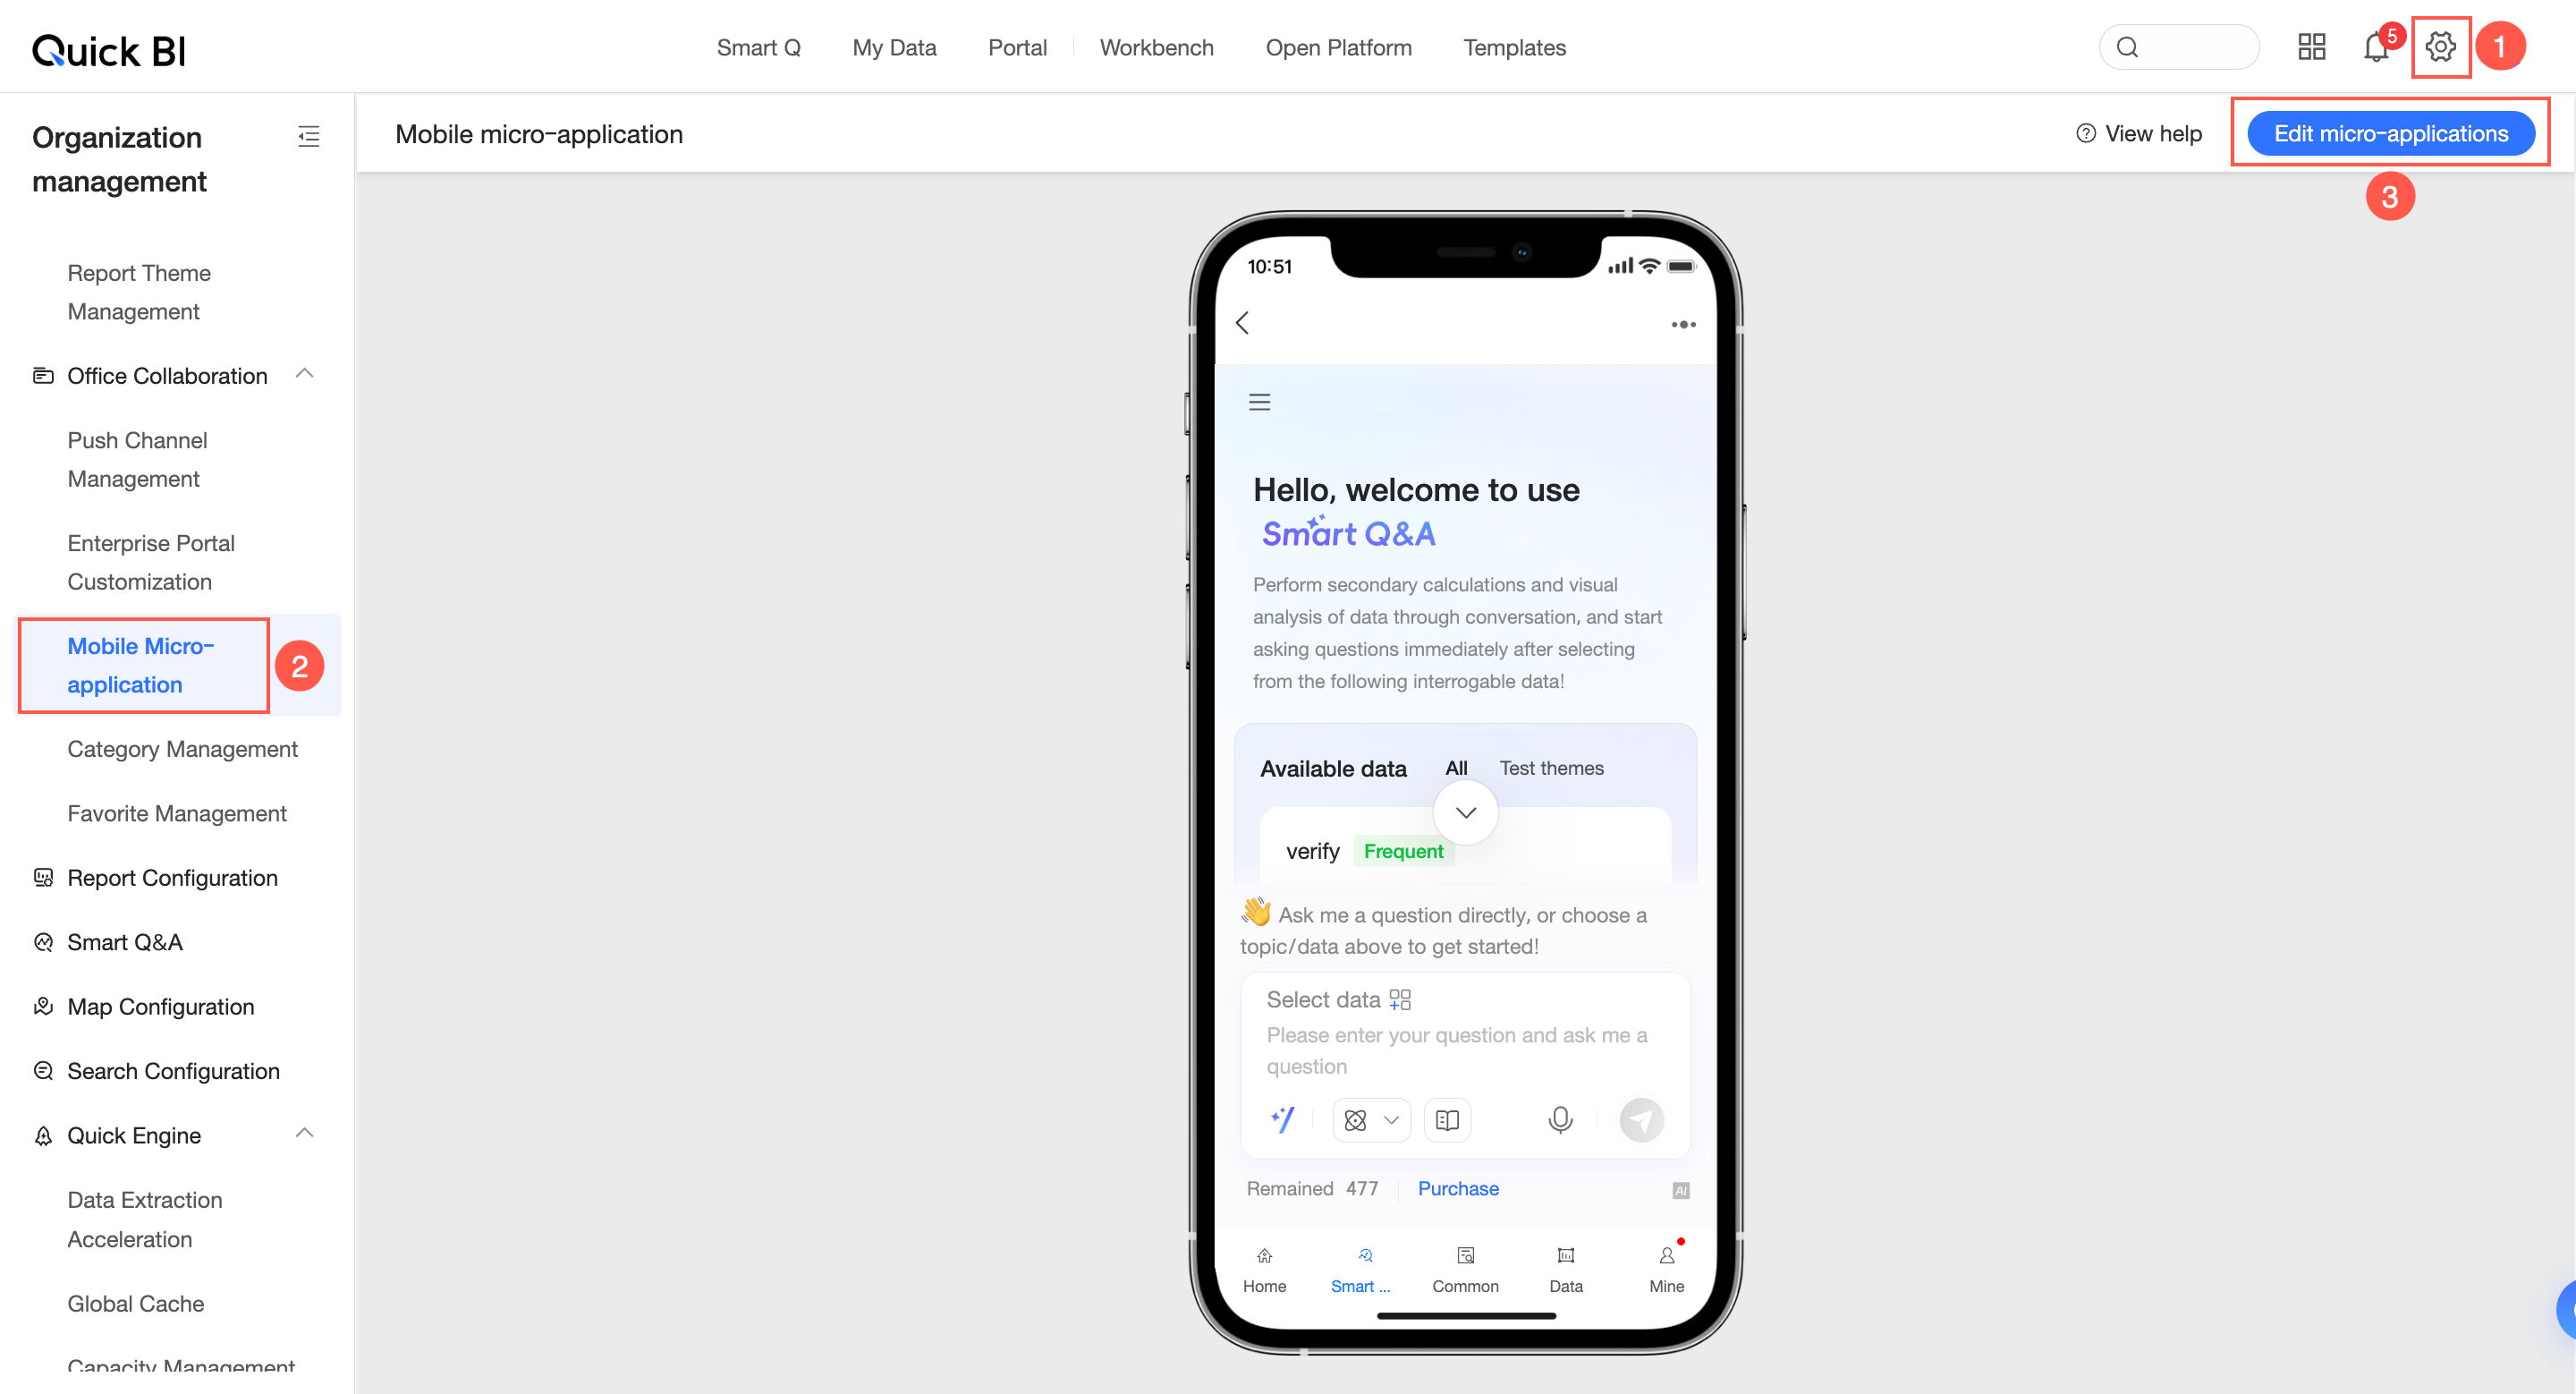
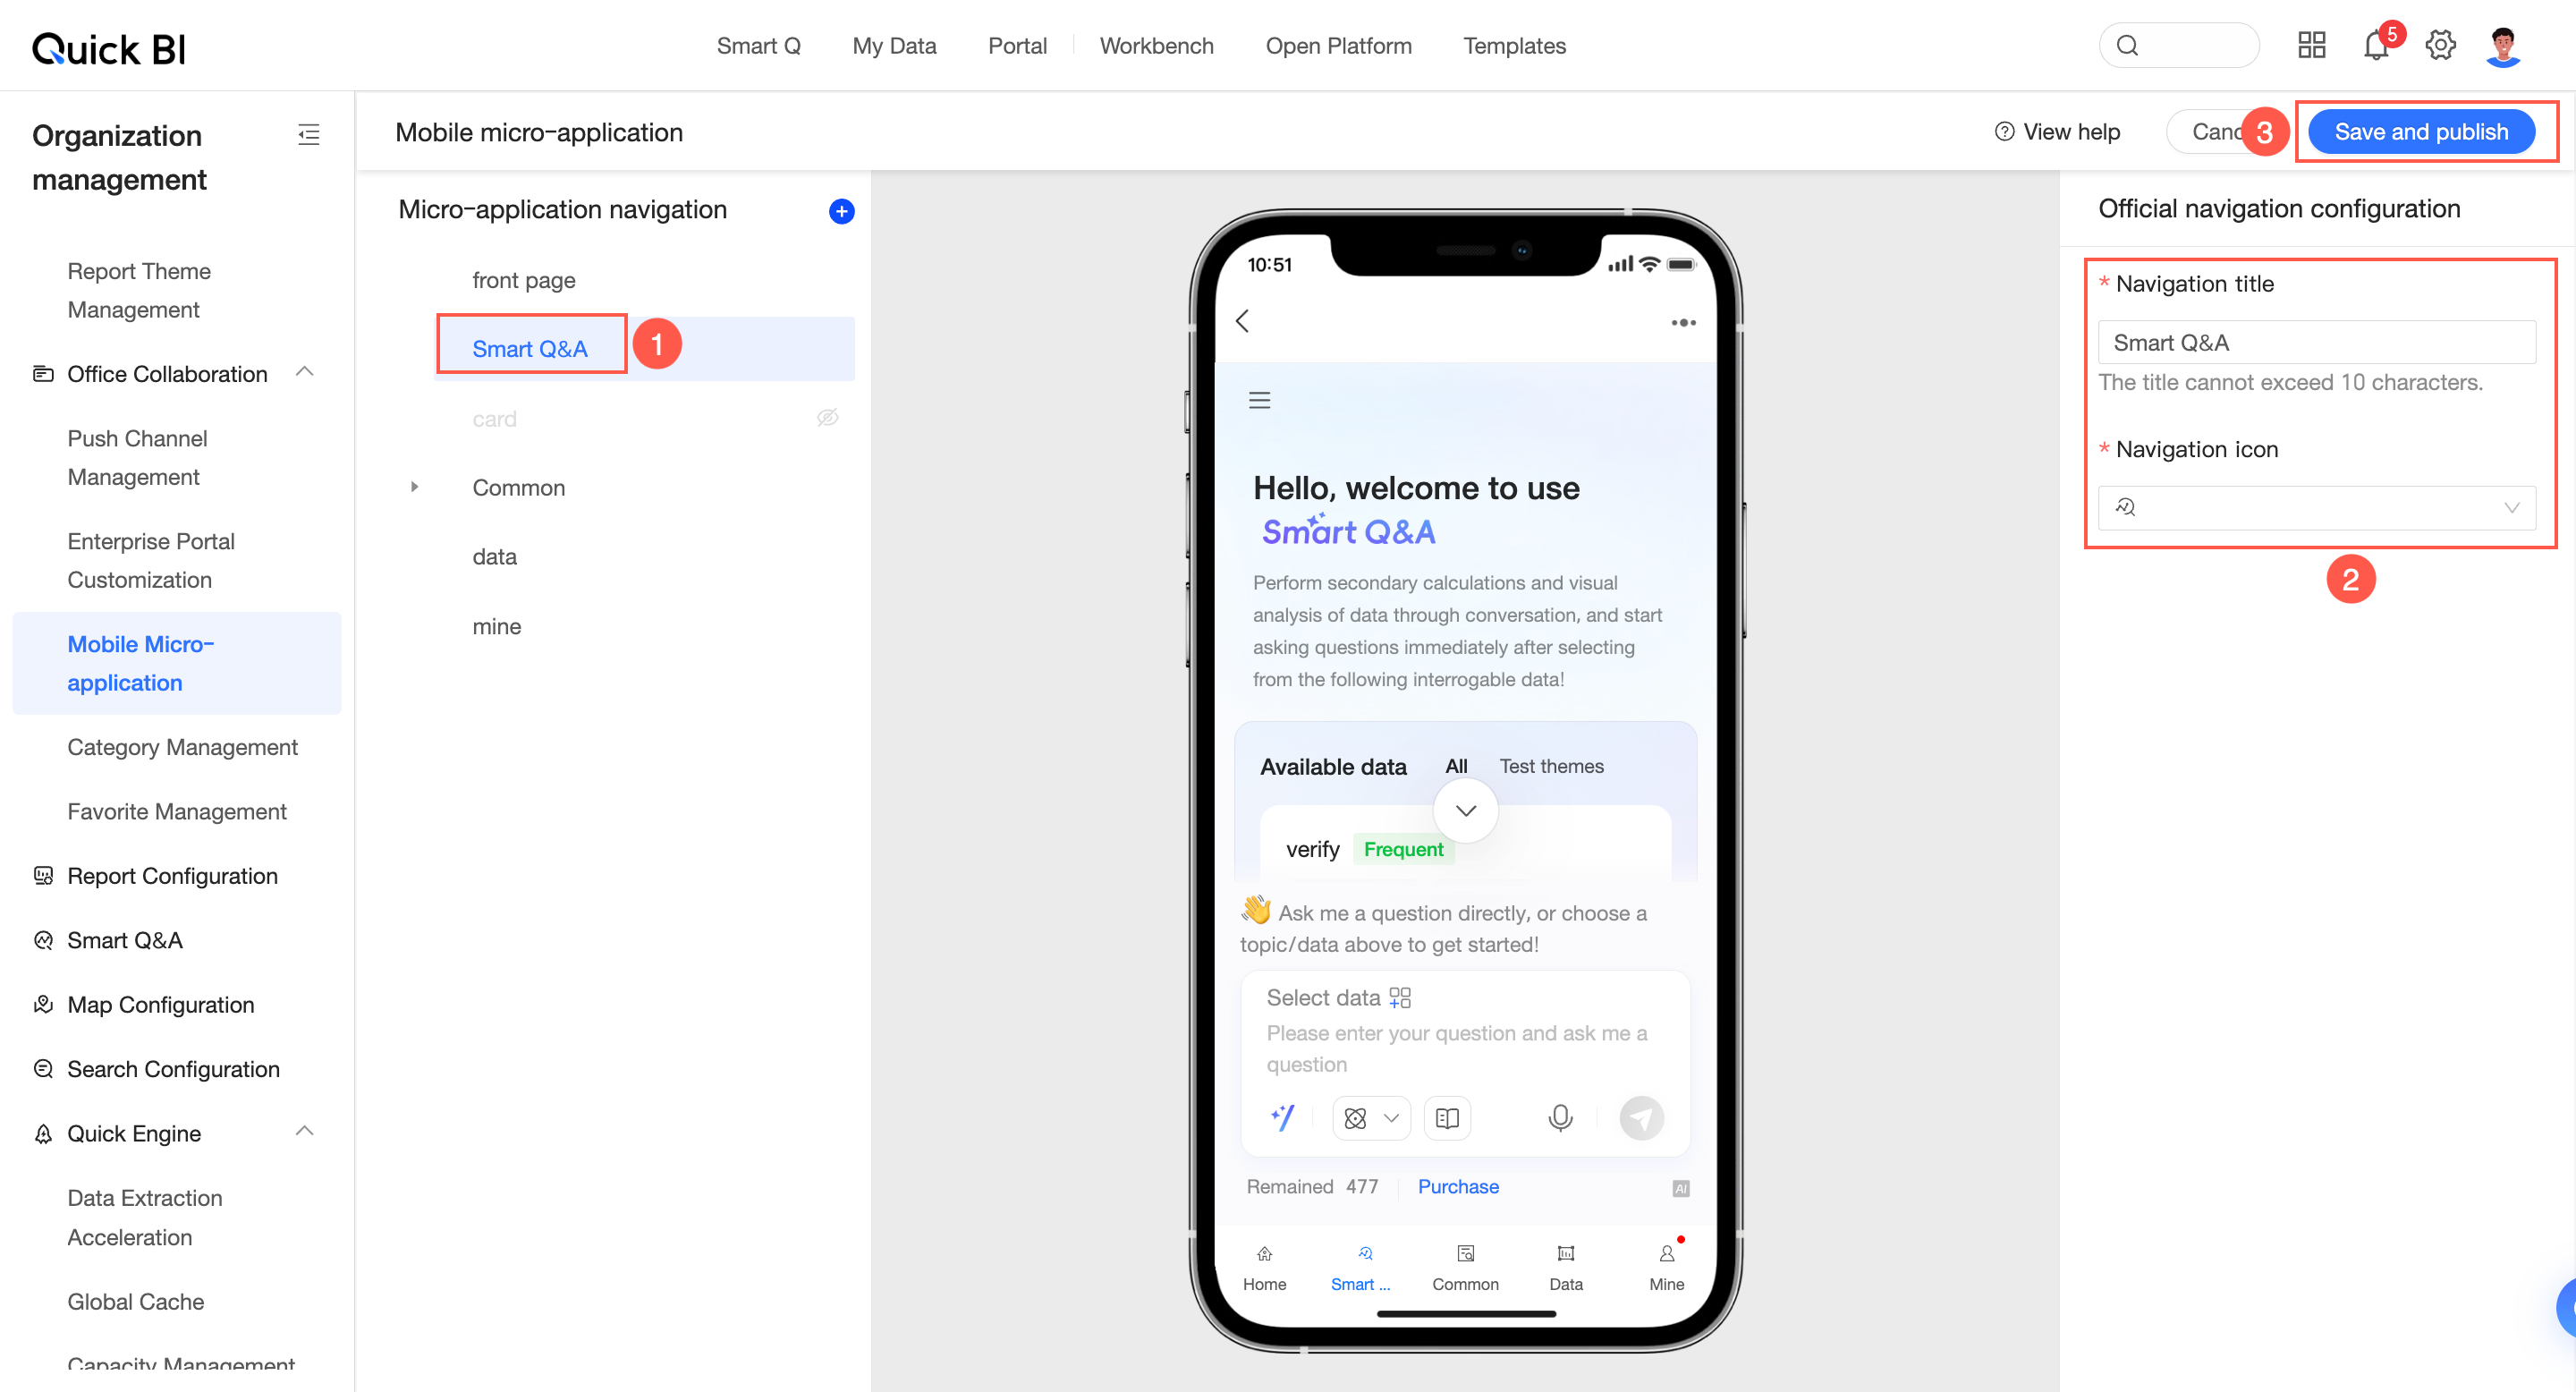
Mobile micro app configuration
Follow the steps shown in the image to enter the mobile editing interface.
In the editing interface, configure Intelligent Data Assistant Q for the mobile micro app.
-
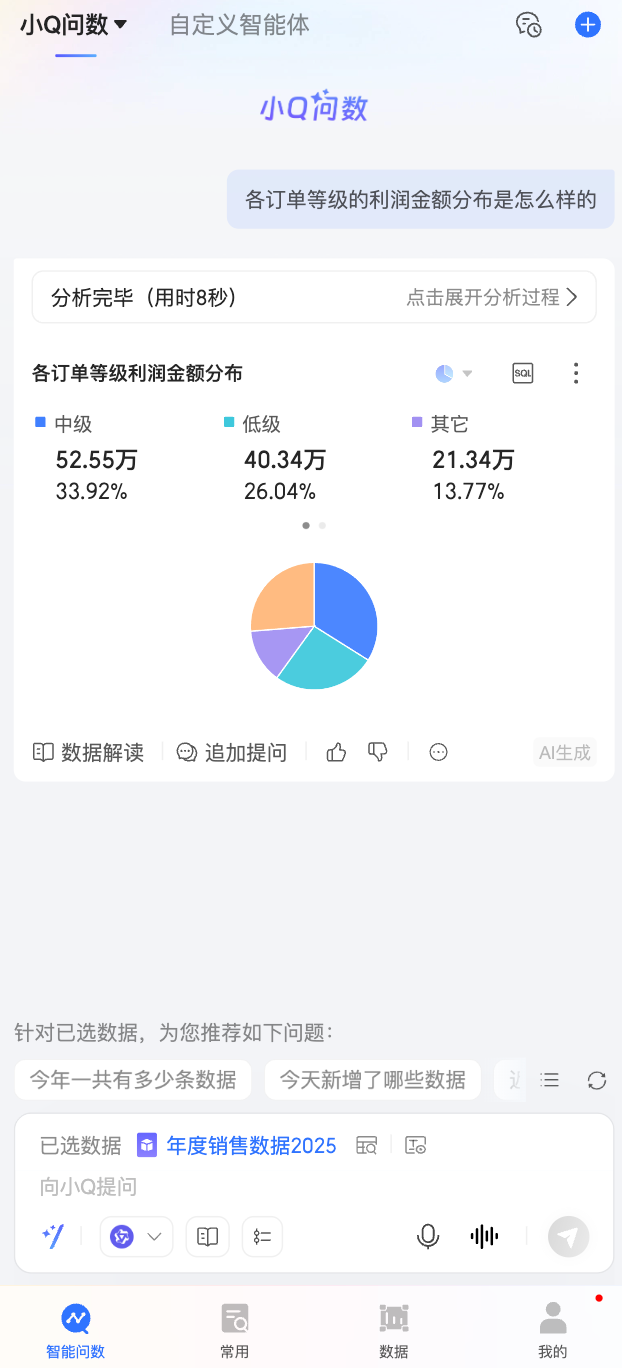
Result
Intelligent Data Assistant Q is available on the mobile client. The operations are similar to those on PC.
Real-time voice conversation
The mobile client supports real-time voice conversation for asking data questions.
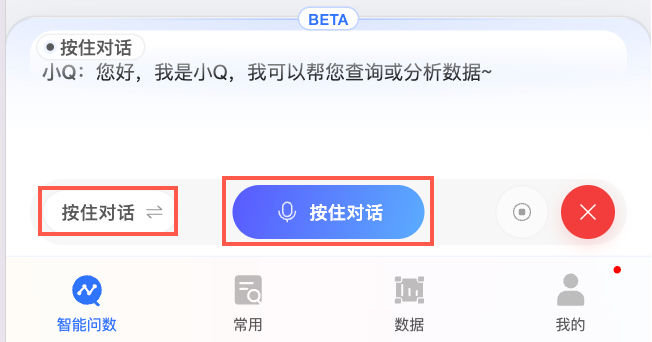
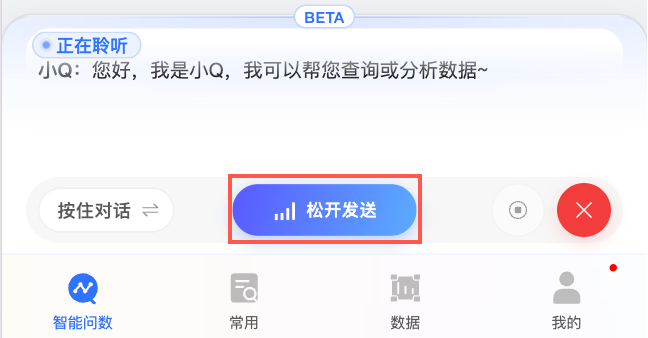
Two interaction modes are available: press and hold to talk and real-time conversation. The model understands conversational context to intelligently form the final question and supports audio playback of results. You can also manually stop the query, interrupt playback through gestures or voice commands, and mute the microphone.
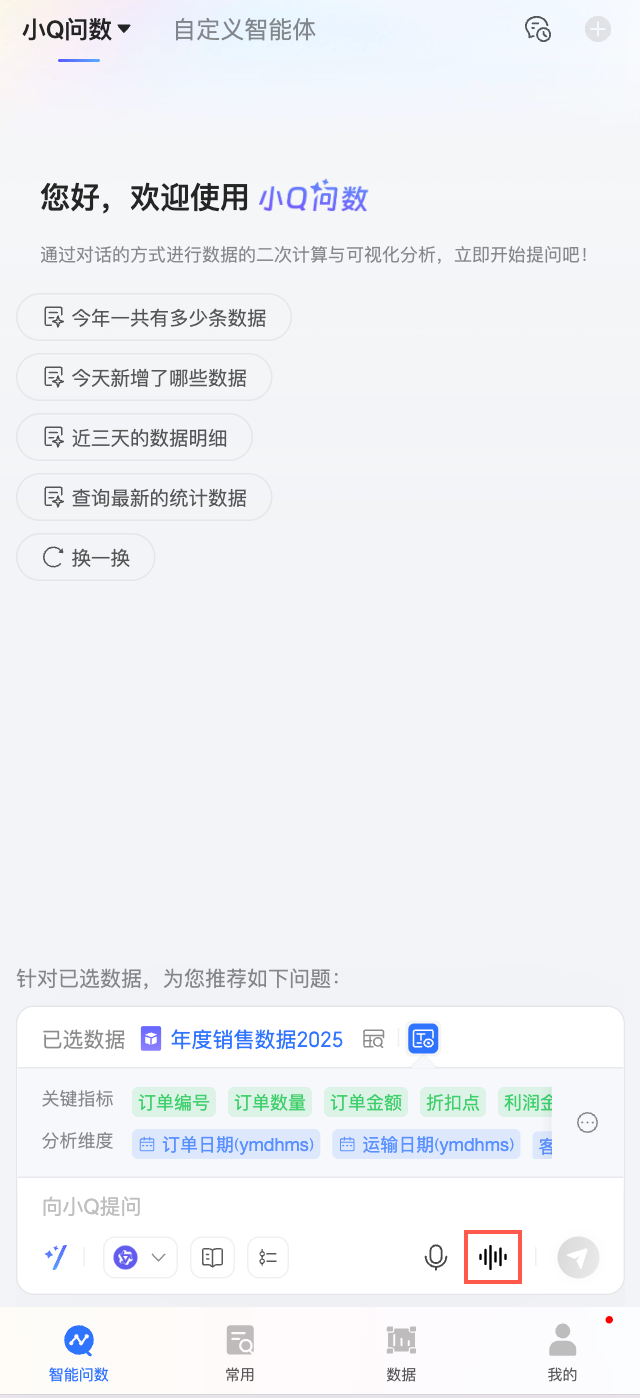
Follow these steps:
-
Tap the
icon at the bottom of the chat box to enter voice conversation mode. -
In the voice conversation interface, you can directly start speaking to ask your question.
Two modes are supported: real-time conversation and press and hold to talk.
-
In real-time conversation mode, Intelligent Assistant Q listens for your voice input continuously. You can tap to mute to pause the input.
When you are ready to continue, you can tap to unmute and resume speaking.
-
In press and hold to talk mode, press and hold the button to record your voice input.
After you finish speaking, release to send.
-
-
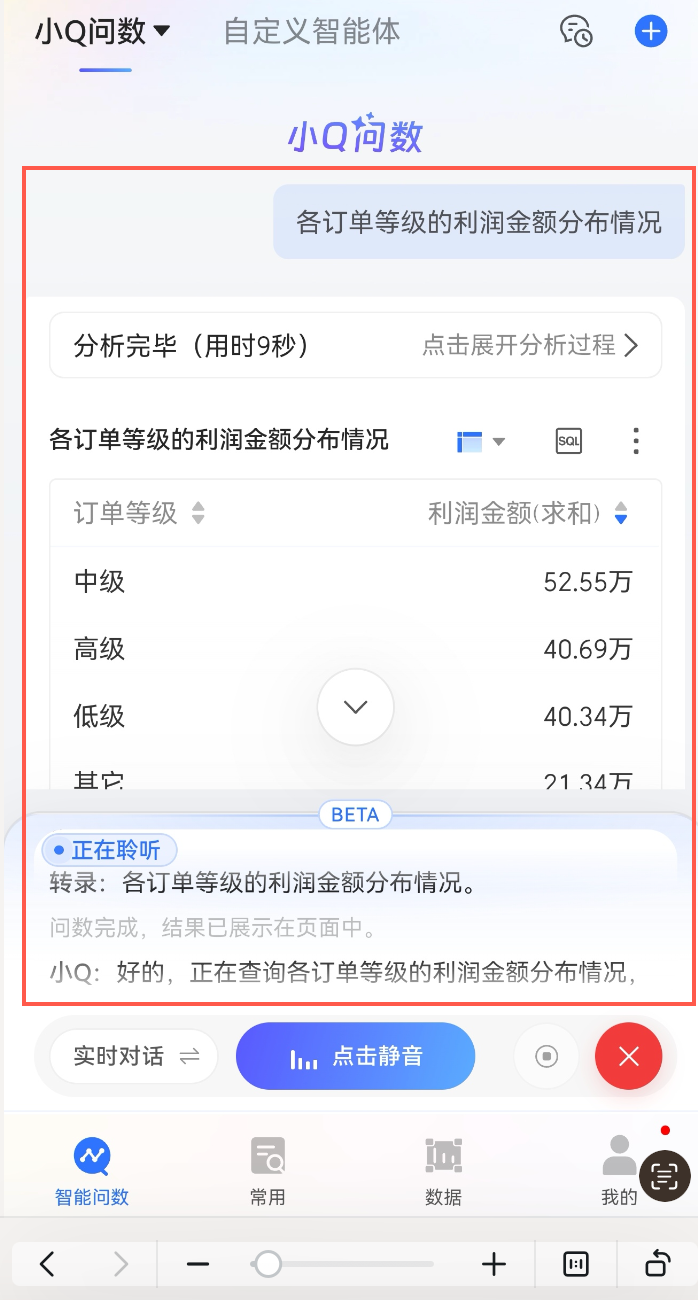
After you provide input, Intelligent Assistant Q automatically transcribes your speech to text, analyzes it, and returns a result. For example, if you say, "Show the profit distribution for each order level," the result will be as follows:
If you have more questions, you can continue the real-time voice conversation with Intelligent Assistant Q.
 icon at the bottom of the chat box to enter voice conversation mode.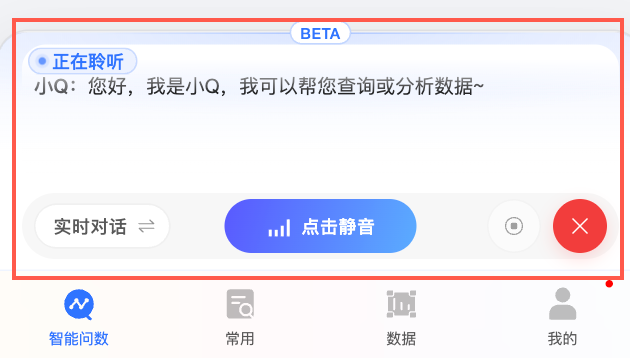
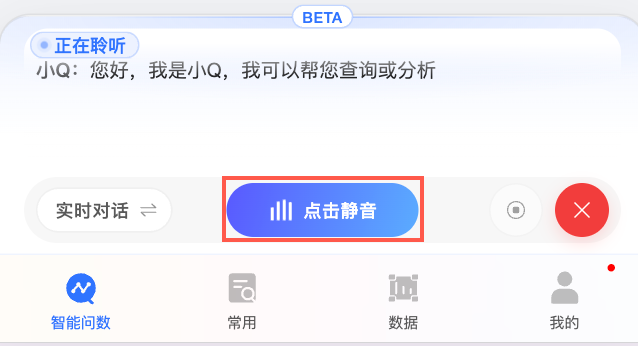
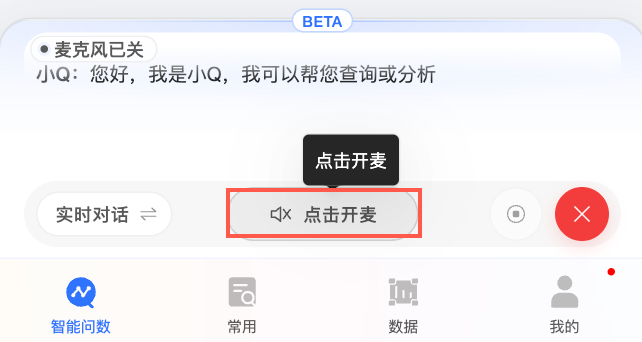
Tips for asking questions
-
Specify a time frame in your questions. For example:
-
Instead of "sales proportion by product", try "sales proportion by product this year".
-
-
To avoid ambiguity when aggregating multiple dimension values, use keywords like "each", "per", "total", or "combined". For example:
-
A question like "sales for Zhejiang and Jiangsu" or "sales from 2020 to 2023" can be ambiguous. Rephrase it as "sales for Zhejiang and Jiangsu each", "sales per year from 2020 to 2023", "sales for each year from 2020 to 2023", "total combined sales for Zhejiang and Jiangsu", or "total sales for Zhejiang and Jiangsu".
-
-
For questions about maximum or minimum values across multiple dimensions, specify whether you want grouped or ungrouped results. For example:
-
Instead of "What is the best-selling product in Zhejiang and Jiangsu?", try "What is the top-selling product by sales in Zhejiang?", "What is the top-selling product by sales in Jiangsu?", or "What is the top-selling product by sales for each province?".
-
Instead of "What were the 3 best-selling months last year for Zhejiang and Jiangsu?", try "What were the 3 best-selling months last year for Zhejiang?", "What were the 3 best-selling months last year for Jiangsu?", or "What were the top 3 order months by sales for each province?".
-
-
If a dimension's value could be ambiguous, specify the dimension name clearly. For example:
-
A question like "Rank products purchased by corporate customers by sales" can be ambiguous because "corporate" might be misinterpreted. Be more specific: "For products where the customer type is corporate, rank them by sales."
-