RDS for SQL Server memory pressure: Diagnosis and optimization
When memory usage on an RDS SQL Server instance exceeds a threshold and causes performance degradation, you must identify, diagnose, and mitigate the memory pressure. Unlike CPU or I/O bottlenecks, memory issues are not always the primary performance constraint. However, in critical scenarios, they can become the root cause of a problem or amplify other bottlenecks. For example, an insufficient cache can increase disk I/O, and memory contention can cause query waits. This article covers memory pressure, including its definition, key metrics, diagnostic steps, case studies, and optimization recommendations.
Background information
SQL Server uses a dynamic memory management mechanism. To reduce expensive disk I/O, SQL Server by default maximizes its use of available memory to cache data in the buffer pool and store execution plans in the plan cache. It only trims or releases the cache when it detects internal or external memory pressure.
-
High memory usage is normal: As long as the operating system does not signal a low-memory condition, SQL Server does not proactively release the memory it has allocated. Therefore, high memory usage in SQL Server is typically normal, as it indicates the server is maximizing resource use for better performance.
-
Memory pressure: This occurs when available memory is insufficient to support the current workload, causing frequent swapping of data pages, memory allocation waits, or errors.
In RDS for SQL Server, memory pressure typically occurs in four main forms:
-
Buffer pool pressure (insufficient data cache)
When data cache space is insufficient, data pages cannot remain in memory for long, causing the Page Life Expectancy (PLE) value to drop consistently. This lowers the cache hit ratio and forces the system to retrieve data through expensive disk I/O.
-
Query workspace pressure (insufficient execution memory)
Complex queries that involve sorting or hashing require a dedicated memory grant. If available memory is insufficient, queries must wait in a queue or spill data to tempdb (known as spills), which significantly degrades execution performance.
-
Non-buffer pool pressure (internal component contention)
In addition to caching data, SQL Server requires memory for other purposes, such as execution plans, lock management, and connections (collectively known as stolen memory). If these components consume too much memory, they reduce the space available for the buffer pool, which creates memory pressure.
-
External memory pressure (non-SQL Server memory pressure)
This occurs when the host operating system has low available memory and forces SQL Server to release memory. Although RDS automatically configures parameters to protect the operating system's memory, this can still occur when resource allocation is imbalanced, for example, when using a low-memory instance (e.g., 4 cores and 8 GB of memory) to support a large dataset (e.g., 2 TB). The pressure is especially acute when a physical backup component initiates a streaming backup. The additional memory overhead intensifies memory pressure, forcing SQL Server to reclaim its cache. This can lead to performance fluctuations or out-of-memory errors.
To diagnose an issue, first identify the type of memory pressure by analyzing performance metrics to determine the correct optimization measures.
1. Determine memory usage
1.1 Identify memory pressure with monitoring and alarms
Procedure
-
Go to the RDS instance list, select a region at the top, and then click the ID of the target instance.
-
In the left-side navigation pane, click Monitoring and Alerts.
-
View the memory-related metrics
mem_usage,Page_life_expectancy, andbufferpool_hit_ratio.
Initial assessment of memory pressure
For an RDS for SQL Server instance, a mem_usage (memory usage) value of 90% or higher is typically normal. SQL Server attempts to use as much available memory as possible to improve performance, for example, for data caching. This metric also includes memory used by the SQL Server process, the operating system, and management services.
However, if an instance enables high-memory-overhead features such as Linked Server, CLR, In-Memory OLTP, or a large number of XEvents or Traces, its actual memory consumption can significantly exceed the configured value of max server memory. This increases overall memory pressure and the risk of performance fluctuations. In this case, you should lower the max server memory value to reserve the necessary memory overhead and ensure system stability.
The recommended upper limits for the mem_usage metric are as follows:
-
97% for instances with 512 GB of memory
-
96% for instances with 256 GB of memory
-
95% for instances with 192 GB or less of memory
1.2 Detailed memory analysis with DAS
The Performance Insights feature is available only in specific regions and for specific instance editions. It does not support RDS instances that run SQL Server 2008 R2 Cloud Disk Edition. Ensure your instance is in a supported region and that Database Autonomy Service (DAS) is enabled.
Procedure
-
Go to the RDS instance list, select a region at the top, and then click the ID of the target instance.
-
In the left-side navigation pane, choose Autonomy Services > Performance Optimization to go to the Performance Insight tab.
-
In the upper-right corner of the page, click Custom Metrics. In the full list of metrics, select the memory-related performance metrics, and then click Confirm. Common metric groups for memory analysis include Memory Usage Classification and AdvancedMemUsage (Advanced Memory Usage Classification).
Memory Usage Classification metrics
The metrics in the Memory Usage Classification group generally correspond to the performance counters of the SQL Server Memory Manager object. Typically:
-
Total_Server_Memory_Kb: Shows if total memory usage is approaching its limit. -
Database_Cache_Memory_KbandStolen_Server_Memory_Kb: Show the proportion of memory allocated to data caching versus other components. -
Free_Memory_Kb: Monitors short-term free memory headroom.
Analyze it in the context of performance trends and the overall workload.
|
Metric |
Description |
Abnormal scenario |
Troubleshooting and optimization |
|
Total_Server_Memory_Kb |
Current committed server memory The total amount of memory that the SQL Server Memory Manager has requested from and committed to the operating system. This value typically increases with the workload until it approaches the configured |
N/A |
N/A |
|
Stolen_Server_Memory_Kb |
Non-data page memory (Stolen) The total amount of memory "borrowed" from the buffer pool for other internal components. This includes the plan cache, lock structures, connection contexts, and auxiliary data structures. |
Internal component contention This value consistently accounts for a high percentage of the total memory (for example, over 40%). This reduces the space available for data caching, leading to frequent page churn and I/O jitter. |
An increase in stolen memory is one of the most common internal sources of memory pressure. Use the |
|
Database_Cache_Memory_Kb |
Data page cache memory The amount of memory in the buffer pool used to cache database data pages. This value directly affects the query data hit ratio. |
Insufficient cache space This value drops sharply or fluctuates significantly, accompanied by a surge in disk reads (Page Reads). This is typically a passive reduction caused by an increase in stolen memory. |
This is a passive metric:
|
|
SQL_Cache_Memory_Kb |
Total plan cache memory The total memory used to store various execution plans, such as plans for SQL requests, stored procedures, and triggers. It is a major component of stolen memory. |
Plan cache bloat This value continuously increases and consumes a large amount of memory, while the cache hit ratio is low. This often occurs when a large number of non-parameterized ad-hoc SQL queries fill the cache with single-use plans. |
|
|
Optimizer_Memory_Kb |
Query optimizer memory The dynamic memory consumed by the query optimizer during the compilation and generation of execution plans. |
Compilation storm This value remains high or shows dense spikes, which usually indicates that the system is experiencing a high volume of concurrent compilations (a compilation storm). |
Analyze this metric together with |
|
Lock_Memory_Kb |
Lock memory The memory overhead required to maintain database locks, such as row, page, and table locks, and their status information. |
Lock resource abuse This value spikes to hundreds of megabytes or even higher. This is usually caused by large uncommitted transactions that hold a massive number of row locks or by severe blocking due to lock escalation. |
|
|
Connection_Memory_Kb |
Connection context memory The memory overhead required to maintain the state of physical connections between clients and the database server. |
Connection leak or storm A surge in the number of connections over a short period causes this metric to rise rapidly. This often occurs when an application does not use a connection pool correctly or fails to close connections properly. |
|
|
Free_Memory_Kb |
Free memory The amount of committed memory that is not currently allocated to any specific request. |
Resource exhaustion (context-dependent) This value remains at or near zero for a long period, and the Page Life Expectancy (PLE) value drops at the same time. |
|
AdvancedMemUsage metrics (stolen memory breakdown)
The AdvancedMemUsage metrics help pinpoint the source of stolen memory. They break down stolen memory into categories that correspond to internal SQL Server components, allowing you to analyze usage in detail.
|
Metric |
Description |
Abnormal scenario |
Troubleshooting and optimization |
|
CACHESTORE_SQLCP_KB |
Ad-hoc query plan cache The memory used to store execution plans for ad-hoc queries, prepared statements, and server-side cursors. |
Excessive non-parameterized queries The application frequently submits SQL statements that are logically identical but have different literal values, for example, due to concatenated parameters. This causes the cache to accumulate a large number of single-use execution plans, leading to memory bloat. |
|
|
CACHESTORE_OBJCP_KB |
Object plan cache (Cache Store: OBJCP) The memory used to cache compiled execution plans for objects such as stored procedures, functions, and triggers. |
Excessive plan redundancy
|
|
|
CACHESTORE_PHDR_KB |
Parse tree and algebrizer tree cache The memory used to temporarily store the parse tree or algebrizer tree corresponding to the SQL text during query compilation. |
Excessively complex SQL text For example, the query statement is extremely long or complex, such as one that contains an IN clause with thousands of values. |
|
|
MEMORYCLERK_SOSNODE_KB |
SQLOS node memory allocation (Memory Clerk: SOSNODE) The memory allocated for internal SQL Server structures used for scheduling, memory management, and other functions. Each NUMA node has its own SOSNODE memory, which is generally stable. |
Under normal conditions, SOSNODE memory grows slightly as the instance runs and then stabilizes. However, on low-specification High-availability Edition RDS for SQL Server instances, especially those that use a Mirroring architecture, a slow memory bloat issue can occur. This manifests as a continuous increase in the |
This memory is used for internal SQL Server scheduling. On low-specification high-availability instances, it may show slow growth. For more information, see Appendix 1: SOSNODE memory growth issue. |
|
MEMORYCLERK_SQLCLR_KB |
CLR managed memory The memory resources allocated and managed for components of the integrated Common Language Runtime (CLR) in SQL Server. |
Custom CLR assemblies deployed by the user, such as stored procedures or functions written in C#, involve complex memory operations or fail to release objects correctly by using Dispose. |
|
|
MEMORYCLERK_SQLSTORENG_KB |
Storage engine internal memory The memory used by core storage engine components, including the version store in tempdb, metadata cache, and file management structures. |
Version store buildup When a database has snapshot isolation or Read Committed Snapshot Isolation (RCSI) enabled, long-running uncommitted transactions can prevent the version chain in tempdb from being cleaned up, which in turn consumes this memory. |
|
|
USERSTORE_SCHEMAMGR_KB |
User store: schema management (User Store: SCHEMAMGR) Caches metadata for database objects (such as table definitions) and for temporary objects in tempdb (such as temporary tables, table variables, and temporary procedures). |
|
|
Analyzing the AdvancedMemUsage metrics helps you identify memory-consuming components and take appropriate action. For example:
-
If metrics related to the plan cache, such as
CACHESTORE_SQLCPandCACHESTORE_OBJCP, account for a high percentage of memory usage, focus on optimizing plan reuse and parameterization. -
If
MEMORYCLERK_SQLCLRshows abnormal usage, inspect the CLR modules. -
If
MEMORYCLERK_SOSNODEshows a long-term increasing trend, it indicates an issue with the SQL Server engine that may require operational measures such as an instance restart.
2. Analyze and optimize memory pressure
After confirming that memory pressure exists, you need to analyze its specific type and optimize based on your business scenario. The following sections describe the diagnostic process and optimization methods for common scenarios.
Scenario 1: Insufficient buffer pool cache
Symptoms
The following characteristics typically indicate that data pages cannot remain in memory for long and that the buffer pool is under pressure:
-
I/O spikes: In Performance Insights, the
Page_Reads(physical read) metric increases significantly, and disk I/O throughput increases. -
Short page life: The Page Life Expectancy (PLE) is consistently below the healthy threshold.
PLE represents the average time in seconds that a data page stays in the buffer pool. The traditional 300-second threshold is no longer suitable for large-memory instances. We recommend calculating the threshold dynamically based on the memory specification. A common formula is:
PLE = (Buffer Pool Memory(GB) / 4GB) * 300PLE calculation examples:
-
16 GB instance (approx. 12 GB buffer pool): A reasonable PLE should be greater than 900 seconds (12 / 4 * 300).
-
128 GB instance (approx. 110 GB buffer pool): A reasonable PLE should be greater than 8,250 seconds (110 / 4 * 300).
Diagnostic process
-
Confirm the correlation: Check if a drop in PLE is accompanied by a simultaneous increase in
Page_Reads. If they are strongly correlated and occur during peak business hours, you can confirm that the issue is insufficient cache. -
Rule out noise: If PLE drops but I/O does not increase significantly, or if the drop occurs during a backup, index rebuild, or checkpoint, it is usually a normal, short-term fluctuation and can be safely ignored.
-
Assess capacity: Compare
database cache memorywith the size of the active working set. If the cache is full but can only accommodate a very small portion of hot data, it indicates a hardware bottleneck.
Optimization solutions
-
Scale up memory: If the working set is much larger than the instance's memory specification, upgrading the instance is the most direct way to reduce I/O latency.
-
Optimize queries: Check for full table scans or large-scale aggregations. If they exist, add indexes to change scans into seeks. This prevents a single large query from evicting all hot data from the buffer pool.
-
Reduce the working set:
-
Archive: Move historical cold data to archive tables.
-
Compress: Enable table or index data compression so that the same amount of memory can hold more data pages.
-
Maintain: Rebuild heavily fragmented indexes to increase page density, and drop unused indexes to reduce maintenance overhead.
-
Scenario 2: Plan cache bloat
Symptoms
Abnormally high stolen memory usage, which can reach engine limits and contend for buffer pool space, usually indicates poor execution plan reuse.
-
Memory characteristics:
stolen memorycontinuously grows and remains at a high level, approaching the internal quota for the plan cache. This preventsdatabase cache memoryfrom receiving sufficient memory, which in turn forces PLE to drop. -
Performance characteristics: CPU usage increases because the cache requires frequent clearing and recompilation of new plans. Disk I/O also increases because the data page cache space is compressed.
-
Common triggers: The application sends large volumes of non-parameterized ad hoc SQL, or an ORM framework generates a massive number of single-use execution plans. As a result, the cache is filled with low-value plans.
Diagnostic process
-
Confirm the correlation: Observe whether stolen memory is significantly higher than the historical baseline and shows a negative correlation with a drop in PLE.
-
Proportion of single-use plans: This metric indicates the number of plans with
usecounts = 1and their memory usage. If single-use plans occupy an extremely high proportion of the plan cache (for example, more than 50%), it indicates that a large amount of memory is being wasted. -
Identify the source: Sample the SQL text of single-use plans by using
sys.dm_exec_sql_text. If you find many queries that are structurally identical and differ only in literal values, the application lacks parameterization. The following SQL statement retrieves the top 20 single-use plans that consume the most cache space:
Optimization solutions
-
Enable the optimize for ad hoc workloads option
-
Procedure: Go to the RDS instance list, go to the instance details page, and in the left-side navigation pane, click Parameters. Search for and enable the
optimize for ad hoc workloadsparameter. -
How it works: After this parameter is enabled, the server stores only a lightweight stub for the first execution of an ad hoc SQL query. The full execution plan is stored only on the second execution.
-
Effect: This significantly reduces the stolen memory consumed by single-use queries and alleviates memory pressure. This option optimizes memory usage but does not reduce CPU compilation overhead.
-
-
Application-side optimization
-
Parameterize queries: Modify the application logic to use parameterized queries instead of string concatenation.
-
ORM configuration: Check if the ORM framework has auto-parameterization or a second-level cache enabled.
-
-
Enable Forced Parameterization
If you cannot modify the application code, you can enable database-level Forced Parameterization in the RDS console:
-
Go to the RDS instance list, go to the instance details page, and in the left-side navigation pane, click Database Management.
-
For the database where you want to enable Forced Parameterization, click View Details on the right.
-
In the Basic Information section, find the
parameterizationparameter, set it toFORCED, and click Submit.NoteVerify this change in a test environment to avoid performance regressions for some complex queries due to plan changes.
-
Scenario 3: Insufficient query memory grants
Symptoms
Unlike buffer pool pressure, this type of pressure does not necessarily cause PLE to drop. When a query involves sort or hash operations, a query can exhibit two typical symptoms if it cannot obtain enough workspace memory:
-
Queued waits
-
Symptom: The query does not start executing and remains in the
SUSPENDEDstate. -
Metric: The wait type is
RESOURCE_SEMAPHORE(extremely severe, indicating that memory is exhausted and that queries are queuing) orRESOURCE_SEMAPHORE_QUERY_COMPILE, and the value of the Memory Grants Pending performance counter increases sharply.
-
-
Spills to disk
-
Behavior: The query runs, but it is extremely slow.
-
Metrics: I/O writes to TempDB increase significantly.
-
Execution plan: A yellow warning icon appears on the sort or hash match operator with the message "Operator used tempdb to spill data..." This indicates that memory was insufficient, forcing SQL Server to write intermediate results to disk for computation.
-
Diagnostic process
You can analyze the SQL statements with the highest memory grant consumption by querying real-time or historical data. In the execution plan (query_plan) of the result, search for the Spill keyword or check for a warning icon on the Sort/Hash operators.
-
Find the statements that are currently consuming the most memory grant.
-
Analyze historical execution statistics from the cache to find the queries that have requested the most memory.
Root causes and optimization solutions
-
Stale statistics (most common cause)
-
Cause: Stale statistics cause the optimizer to severely underestimate the number of rows in the result set (e.g., estimating 1 row when 1 million rows will be processed). Based on this estimate, the optimizer requests a very small amount of memory (e.g., 1 MB), leading to frequent spills to disk during execution.
-
Solution: Update database statistics periodically or during off-peak hours to ensure the optimizer can accurately estimate memory requirements.
-
-
Contention from concurrent large queries
-
Cause: Multiple resource-intensive reporting queries that require full table sorts or large-scale hash aggregates run concurrently, exhausting available memory and forcing subsequent queries into a wait queue.
-
Solution: Schedule memory-intensive reporting tasks to run serially during off-peak hours to avoid resource contention during peak times.
-
-
Code or index design issues
-
High-memory operators: The query contains complex JOIN, GROUP BY, ORDER BY, or DISTINCT operations but lacks appropriate indexes, forcing SQL Server to build a large hash table in memory or perform intermediate sorts, causing memory demand to surge.
-
Excessive data width: Using
SELECT *or selecting unnecessary long text columns can cause individual rows of data to become bloated. BecauseMemory grant size = Estimated row count × Average row width, the wider the columns, the more total memory is required. -
Solution:
-
Create sort-friendly indexes: Create covering or ordered indexes to help the optimizer choose less memory-intensive physical operators.
-
Optimize on the application side: Select only necessary columns to reduce row width. Break down large, multi-join queries into simpler steps.
-
-
3. Troubleshooting memory pressure
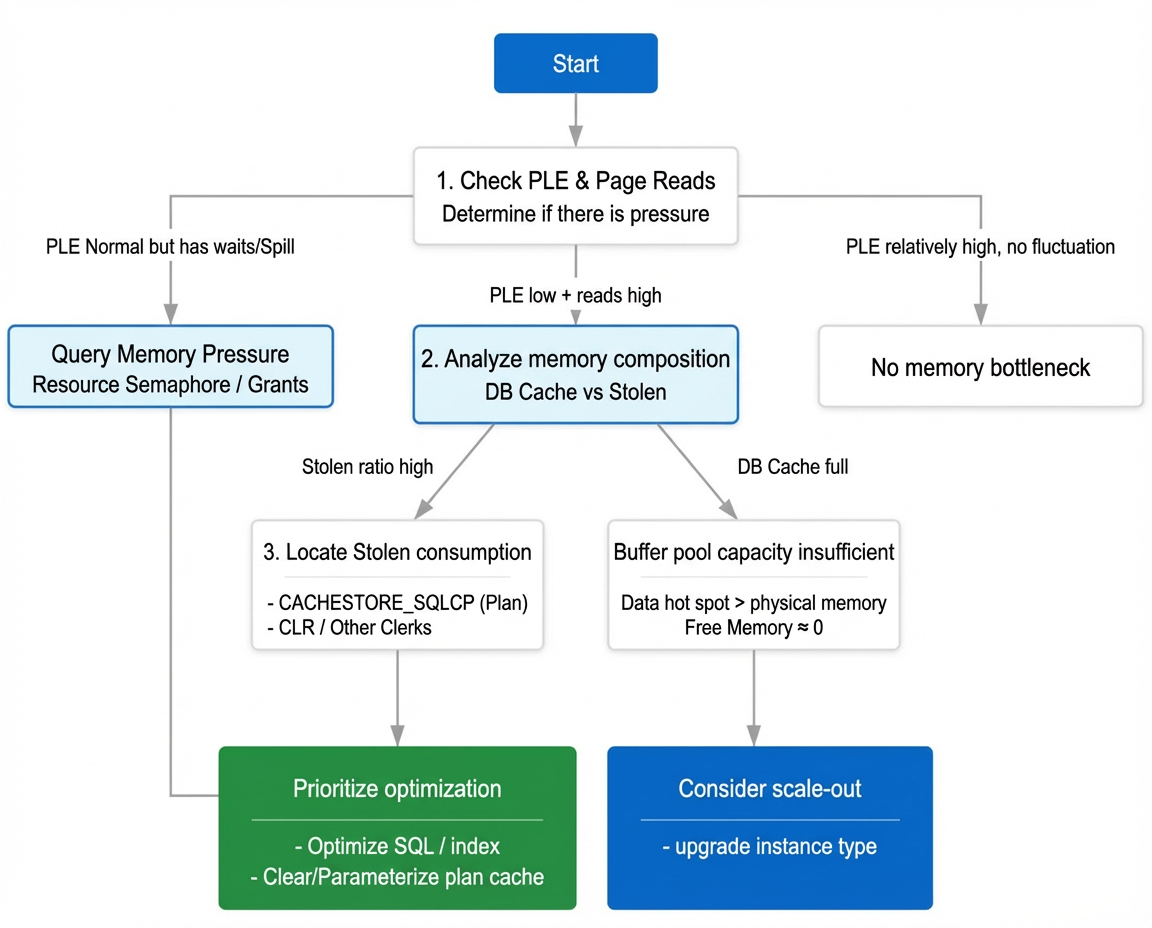
Stage 1: Preliminary assessment
First, check the Page Life Expectancy (PLE) and Page Reads metrics. You will typically encounter one of the following three scenarios:
-
No memory pressure: If PLE consistently remains above the threshold without significant fluctuations, this is normal behavior for SQL Server, even if memory usage is near 100%. In this case, disregard memory and focus on investigating CPU or I/O bottlenecks.
-
Buffer pool pressure: If PLE frequently drops below the threshold or falls sharply, accompanied by a high number of Page Reads per second, this indicates that data pages are not staying in memory long enough. Proceed to the next stage to analyze the memory composition.
-
Query Memory pressure: If PLE appears normal but the system experiences pending memory grants (Memory Grants Pending > 0) or queries frequently spill to tempdb, this indicates insufficient memory for query execution, a problem unrelated to the buffer pool. You should directly optimize the relevant SQL queries, for example, by reducing sorts or adding an index.
Stage 2: Analyze memory composition
After confirming memory pressure, examine the memory allocation to determine if it is being preempted by other components or is simply insufficient:
-
High Stolen percentage: If the Database Cache is small while Stolen Server Memory accounts for a large share (e.g., over 20%), this means a significant amount of memory is being diverted for non-data page uses, such as the plan cache, connections, or CLR. This is a typical misallocation issue; your priority is to reclaim the misused memory.
-
Database Cache is full: If the Database Cache already occupies most of the memory, the Stolen percentage is low, and Free Memory is consistently near zero, this indicates that the physical memory is insufficient for the current hot data workload. This is a true capacity bottleneck. You can resolve this by optimizing the application to reduce hot data usage or by scaling up memory.
Stage 3: Pinpoint consumption and decide
Based on the analysis from the first two stages, decide whether to pursue performance optimization or to scale up memory:
-
Performance optimization (for high Stolen usage or Query Memory pressure)
-
Pinpoint high-consumption Stolen components: Query the sys.dm_os_memory_clerks view. If CACHESTORE_SQLCP usage is high, this indicates plan cache bloat. Optimize your SQL queries with techniques like parameterization. If CLR or another component shows abnormal usage, you need to adjust the corresponding application logic.
Resolving Query Memory: For queries that request excessive memory, you can reduce their memory usage by rewriting SQL, updating statistics, or adding an index. Scaling up usually cannot resolve this type of contention issue.
-
-
Scaling up memory (for insufficient Database Cache capacity)
If memory is primarily used for data pages (Database Cache) and Stolen memory usage is low, but PLE remains low, this indicates that your workload's hot data exceeds the physical memory of the current instance type. In this case, upgrading the instance type or adding more memory is the most effective way to resolve the I/O bottleneck and improve performance.
Appendix 1: SOSNODE memory growth
If an RDS SQL Server high-availability edition instance runs for an extended period (such as several months without a restart), it may exhibit a slow, steady increase in the MEMORYCLERK_SOSNODE_KB value. This growth is not directly related to peak hours and is particularly noticeable on instances with smaller specifications, such as those with 2 cores and 4 GB of memory or 4 cores and 8 GB of memory. This consumption counts toward the Max Server Memory limit, reducing the available space for the Buffer Pool and potentially causing a significant memory bottleneck.
This behavior indicates a typical memory leak involving SOSNODE objects. Microsoft has not fully resolved this issue, and it poses a risk to multiple SQL Server versions. We recommend the following actions:
-
Upgrade to a later version to mitigate this risk.
-
Based on the rate of the memory leak, perform a scheduled restart every two to four months during off-peak hours. This releases the leaked memory and prevents long-term accumulation that could lead to out-of-memory conditions, which can result in a
701error in the Errorlog.
In addition, RDS continuously monitors for such abnormal growth trends. When the metric reaches a specific threshold, RDS automatically triggers a proactive O&M task. You can view the corresponding task in the Event Center in the console.