This topic describes how to use the lock blocking statistics page to quickly identify sessions causing prolonged blocking and view their details.
Prerequisites
-
The instance must use a cloud disk.
-
This feature is not available for ApsaraDB RDS for SQL Server 2008 R2 instances that use cloud disks.
-
This feature is available only for ApsaraDB RDS for SQL Server instances in the following regions: China (Hangzhou), China (Shanghai), China (Qingdao), China (Beijing), China (Zhangjiakou), China (Hohhot), China (Ulanqab), China (Shenzhen), China (Heyuan), China (Guangzhou), China (Chengdu), China (Hong Kong), Singapore, or UAE (Dubai).
Background information
In SQL Server, to maintain data consistency, the system acquires a lock on a resource when a session modifies it. This prevents other concurrent sessions from accessing or modifying the same resource. Under normal conditions, the lock is held for a short time and released after the modification is complete, allowing the next session to access the resource. However, issues such as a slow SQL statement can cause a resource to be locked for an extended period, which severely impacts performance.
To address this issue, ApsaraDB RDS for SQL Server provides a lock blocking statistics page. On this page, you can quickly find information such as the Server Process ID (SPID) of the blocking session, the time when the blocking occurred, and the SQL statement that caused the blocking. This information helps you pinpoint the root cause.
How it works
A session blocked for about 2 seconds typically does not cause major issues. However, if multiple sessions are repeatedly blocked for more than 2 seconds in a short period, it can significantly affect the entire system.
The system samples lock blocking every 10 seconds. At each sampling point, if a session has been executing an SQL statement for more than 2 seconds and is blocking other sessions, the system captures and records it on the lock blocking statistics page.
Procedure
Go to the Instances page. In the top navigation bar, select the region in which the RDS instance resides. Then, find the RDS instance and click the ID of the instance.
-
In the left-side navigation pane, choose Autonomy Services > Lock Optimization.
-
Click the Blocking tab to view the blocking details of the instance.
Page description
-
Blocking Overview
Shows the number of blocking events within a specified time range.
Time ranges include Last 24 Hours, Last 7 Days, Last 14 Days, and Last 30 Days.
-
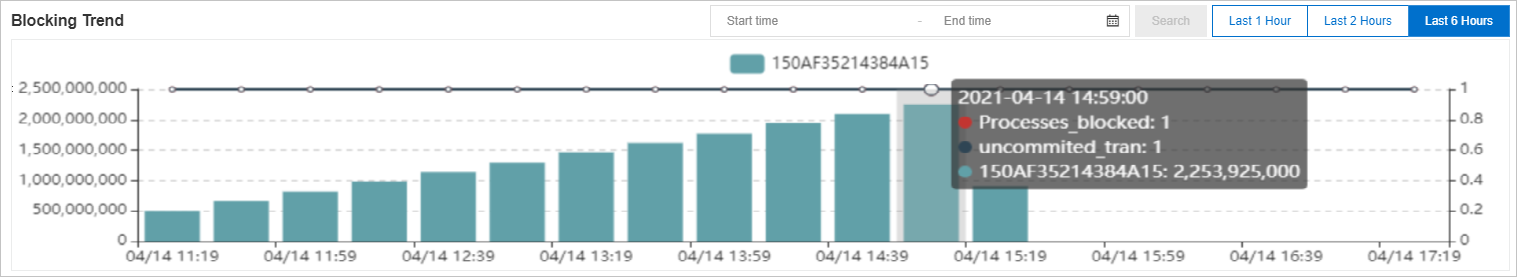
Blocking Duration Trend
Shows a trend chart of the blocking duration for the selected time period.
Hover over a point in time to view its blocking details, which include the following:
-
The time when the blocking occurred.
-
Processes_blocked: The number of blocked sessions.
-
Uncommited_tran: The number of uncommitted transactions.
NoteUncommitted transactions do not release locks.
-
The QueryHash (a hash value of a specific SQL statement) and the corresponding blocking time.
-
-
Blocking Source Details
Displays detailed information about the blocking source. The details include the following:
-
SPID: The SPID of the blocking session.
-
QueryHash: A hash value generated from the SQL statement. SQL statements of the same type share the same QueryHash.
-
Wait Type: The reason the waiting session is blocked. For more information about wait types, see Wait Types.
-
Execution Duration (ms): The duration for which the session has been running.
-
SQL: The SQL statement that caused the blocking.
NoteHover over the SQL statement and click the
 icon that appears on the right to copy the SQL statement.
 -
Time: The time when the blocking occurred.
-
Database Name: The name of the database where the blocking occurred.
Click anywhere in a row to view the corresponding Blocking Diagram at the bottom of the page.
-
-
Blocking Diagram
Shows the blocking SPID (red), the blocked SPID (blue), the lock type, and the blocking duration. For more information about lock types, see Lock Types.
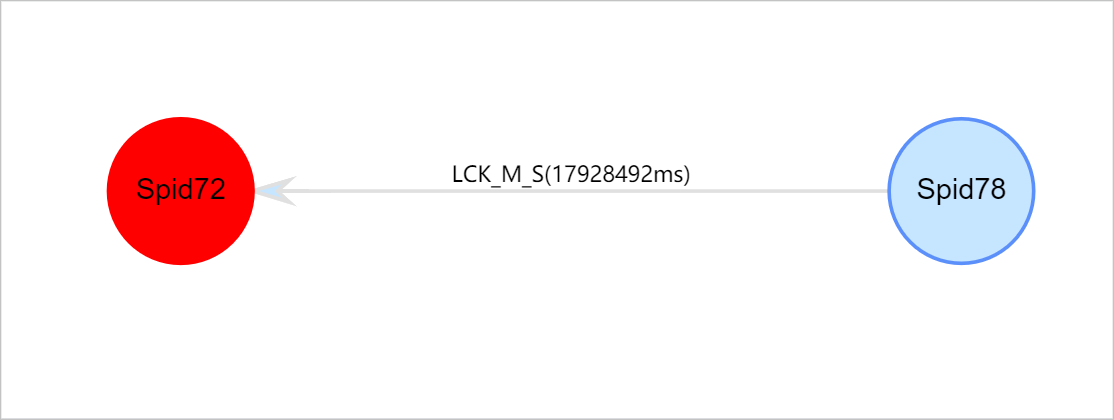
Hover over an SPID to view its blocking details, which include the following:
-
SPID: The server process ID.
-
BlockedBySpid: The SPID of the blocking session.
-
WaitType: The wait type.
-
WaitTimeMs: The blocking duration, in milliseconds.
-
CMD: The SQL command type for the current session.
-
CPU: The CPU time, in milliseconds.
-
DBName: The database name.
-
ClientAppName: The client application name.
-
HostName: The client hostname.
-
LoginId: The username.
-
PhysicalIO: The I/O consumed by the current session. 1 PhysicalIO equals 8 KB.
-
QueryHash: A hash value generated from the SQL statement. SQL statements of the same type share the same QueryHash.
-
StartTime: The start time of the current batch. A batch can contain multiple SQL statements and share resources such as variable values.
-
Status: The status of the current session.
-
SQL: Click a red or blue SPID to display the SQL execution details below the Blocking Diagram.
-
-
SQL Details
In the Blocking Diagram, click a red or blue SPID to display the SQL execution details for that session. Click Click to Copy to quickly copy the SQL statement for analysis or troubleshooting.