This document covers the test environment, tooling, methodology, and results for a performance benchmark of Tair (Enterprise Edition) SSD-based instances.
Test environment
Item | Description |
Region and zone | Hangzhou Zone J |
Instance architecture | Standard master-replica architecture. For details, see Standard architecture. |
Stress testing host | Elastic Compute Service (ECS) instance of the |
Instance types tested |
|
The benchmark covers two scenarios that represent opposite ends of the memory utilization spectrum:
Memory larger than data volume: Most data fits in memory. Memory-to-data ratio is approximately 7:1. This represents an in-memory-dominant access pattern.
Data volume larger than memory: Only a portion of data is cached in memory, and most read/write requests require disk I/O. Memory-to-data ratio is approximately 1:4. This represents an SSD-dominant access pattern.
Test tool
The benchmark uses YCSB, an open-source Java-based database benchmarking framework.
The YCSB source code is modified to support a LONG-typed recordcount parameter and to test Redis string commands. For the modified source code, see YCSB source code.
Test script
The following script runs performance tests for the data-volume-larger-than-memory scenario:
#!/bin/bash

ip=192.168.0.23
port=3100
timeout=30000
command_group=string
recordcount=640000000
run_operationcount=640000000
fieldcount=1
fieldlength=100
threads=64
load_sleep_time=600
run_sleep_time=60

echo "##################################### $command_group  ############################################"

# Load
./bin/ycsb load redis -s -P workloads/workloada \
  -p "redis.host=${ip}" -p "redis.port=${port}" \
  -p "recordcount=${recordcount}" -p "operationcount=${recordcount}" \
  -p "redis.timeout=${timeout}" -p "redis.command_group=${command_group}" \
  -p "fieldcount=${fieldcount}" -p "fieldlength=${fieldlength}" \
  -threads ${threads}
sleep ${load_sleep_time}

# Uniform-Read
./bin/ycsb run redis -s -P workloads/workloadc \
  -p "redis.host=${ip}" -p "redis.port=${port}" \
  -p "recordcount=${recordcount}" -p "operationcount=${run_operationcount}" \
  -p "redis.timeout=${timeout}" -p "redis.command_group=${command_group}" \
  -p "fieldcount=${fieldcount}" -p "fieldlength=${fieldlength}" \
  -p "requestdistribution=uniform" -threads ${threads}
sleep ${run_sleep_time}

# Zipfian-Read
./bin/ycsb run redis -s -P workloads/workloadc \
  -p "redis.host=${ip}" -p "redis.port=${port}" \
  -p "recordcount=${recordcount}" -p "operationcount=${run_operationcount}" \
  -p "redis.timeout=${timeout}" -p "redis.command_group=${command_group}" \
  -p "fieldcount=${fieldcount}" -p "fieldlength=${fieldlength}" \
  -p "requestdistribution=zipfian" -threads ${threads}
sleep ${run_sleep_time}

# Uniform-50%Read-50%Update
./bin/ycsb run redis -s -P workloads/workloada \
  -p "redis.host=${ip}" -p "redis.port=${port}" \
  -p "recordcount=${recordcount}" -p "operationcount=${run_operationcount}" \
  -p "redis.timeout=${timeout}" -p "redis.command_group=${command_group}" \
  -p "fieldcount=${fieldcount}" -p "fieldlength=${fieldlength}" \
  -p "requestdistribution=uniform" -threads ${threads}
Parameters
Parameter | Description |
| IP address of the Tair instance |
| Service port of the Tair instance |
| Command timeout. Unit: ms |
| Data type to test. Set to |
| Number of records loaded during the data loading phase |
| Number of operations during the run phase. In both scenarios, set this to the same value as |
| Number of fields per record. Set to |
| Length of each field in bytes. Set to |
| Number of YCSB client threads. Varies by instance type. |
Test metrics
Metric | Description |
QPS | Number of read and write operations processed per second |
Average latency | Average latency of read or write operations. Unit: µs |
99th percentile latency | Highest latency for the fastest 99% of operations. Unit: µs. For example, a value of 500 µs means 99% of operations complete within 500 µs. |
Test results
Memory size larger than data volume
Memory-to-data ratio is approximately 7:1. Most requests are served from memory.
Instance type | YCSB configuration | Workload | QPS | Average latency (µs) | 99th percentile latency (µs) |
| recordcount=20,000,000 run_operationcount=20,000,000 threads=64 fieldlength=100 | Load | 42,275 | 1,511 | 4,987 |
Uniform-Read | 104,303 | 611 | 2,163 | ||
Zipfian-Read | 105,217 | 605 | 2,259 | ||
Uniform-50%Read-50%Update | 52,267 | Read: 1,114 | Read: 4,191 | ||
Update: 1,329 | Update: 4,827 | ||||
| recordcount=40,000,000 run_operationcount=40,000,000 threads=128 fieldlength=100 | Load | 64,104 | 1,993 | 5,951 |
Uniform-Read | 174,533 | 730 | 2,049 | ||
Zipfian-Read | 177,612 | 718 | 2,033 | ||
Uniform-50%Read-50%Update | 75,762 | Read: 1,509 | Read: 4,667 | ||
Update: 1,864 | Update: 5,479 | ||||
| recordcount=60,000,000 run_operationcount=60,000,000 threads=192 fieldlength=100 | Load | 116,107 | 1,647 | 9,983 |
Uniform-Read | 225,613 | 847 | 3,687 | ||
Zipfian-Read | 234,014 | 816 | 3,279 | ||
Uniform-50%Read-50%Update | 138,884 | Read: 1,321 | Read: 8,131 | ||
Update: 1,435 | Update: 8,479 | ||||
| recordcount=120,000,000 run_operationcount=120,000,000 threads=384 fieldlength=100 | Load | 170,447 | 2,246 | 11,935 |
Uniform-Read | 323,136 | 1,184 | 4,005 | ||
Zipfian-Read | 330,023 | 1,159 | 3,951 | ||
Uniform-50%Read-50%Update | 207,350 | Read: 1,759 | Read: 9,031 | ||
Update: 1,934 | Update: 9,439 |
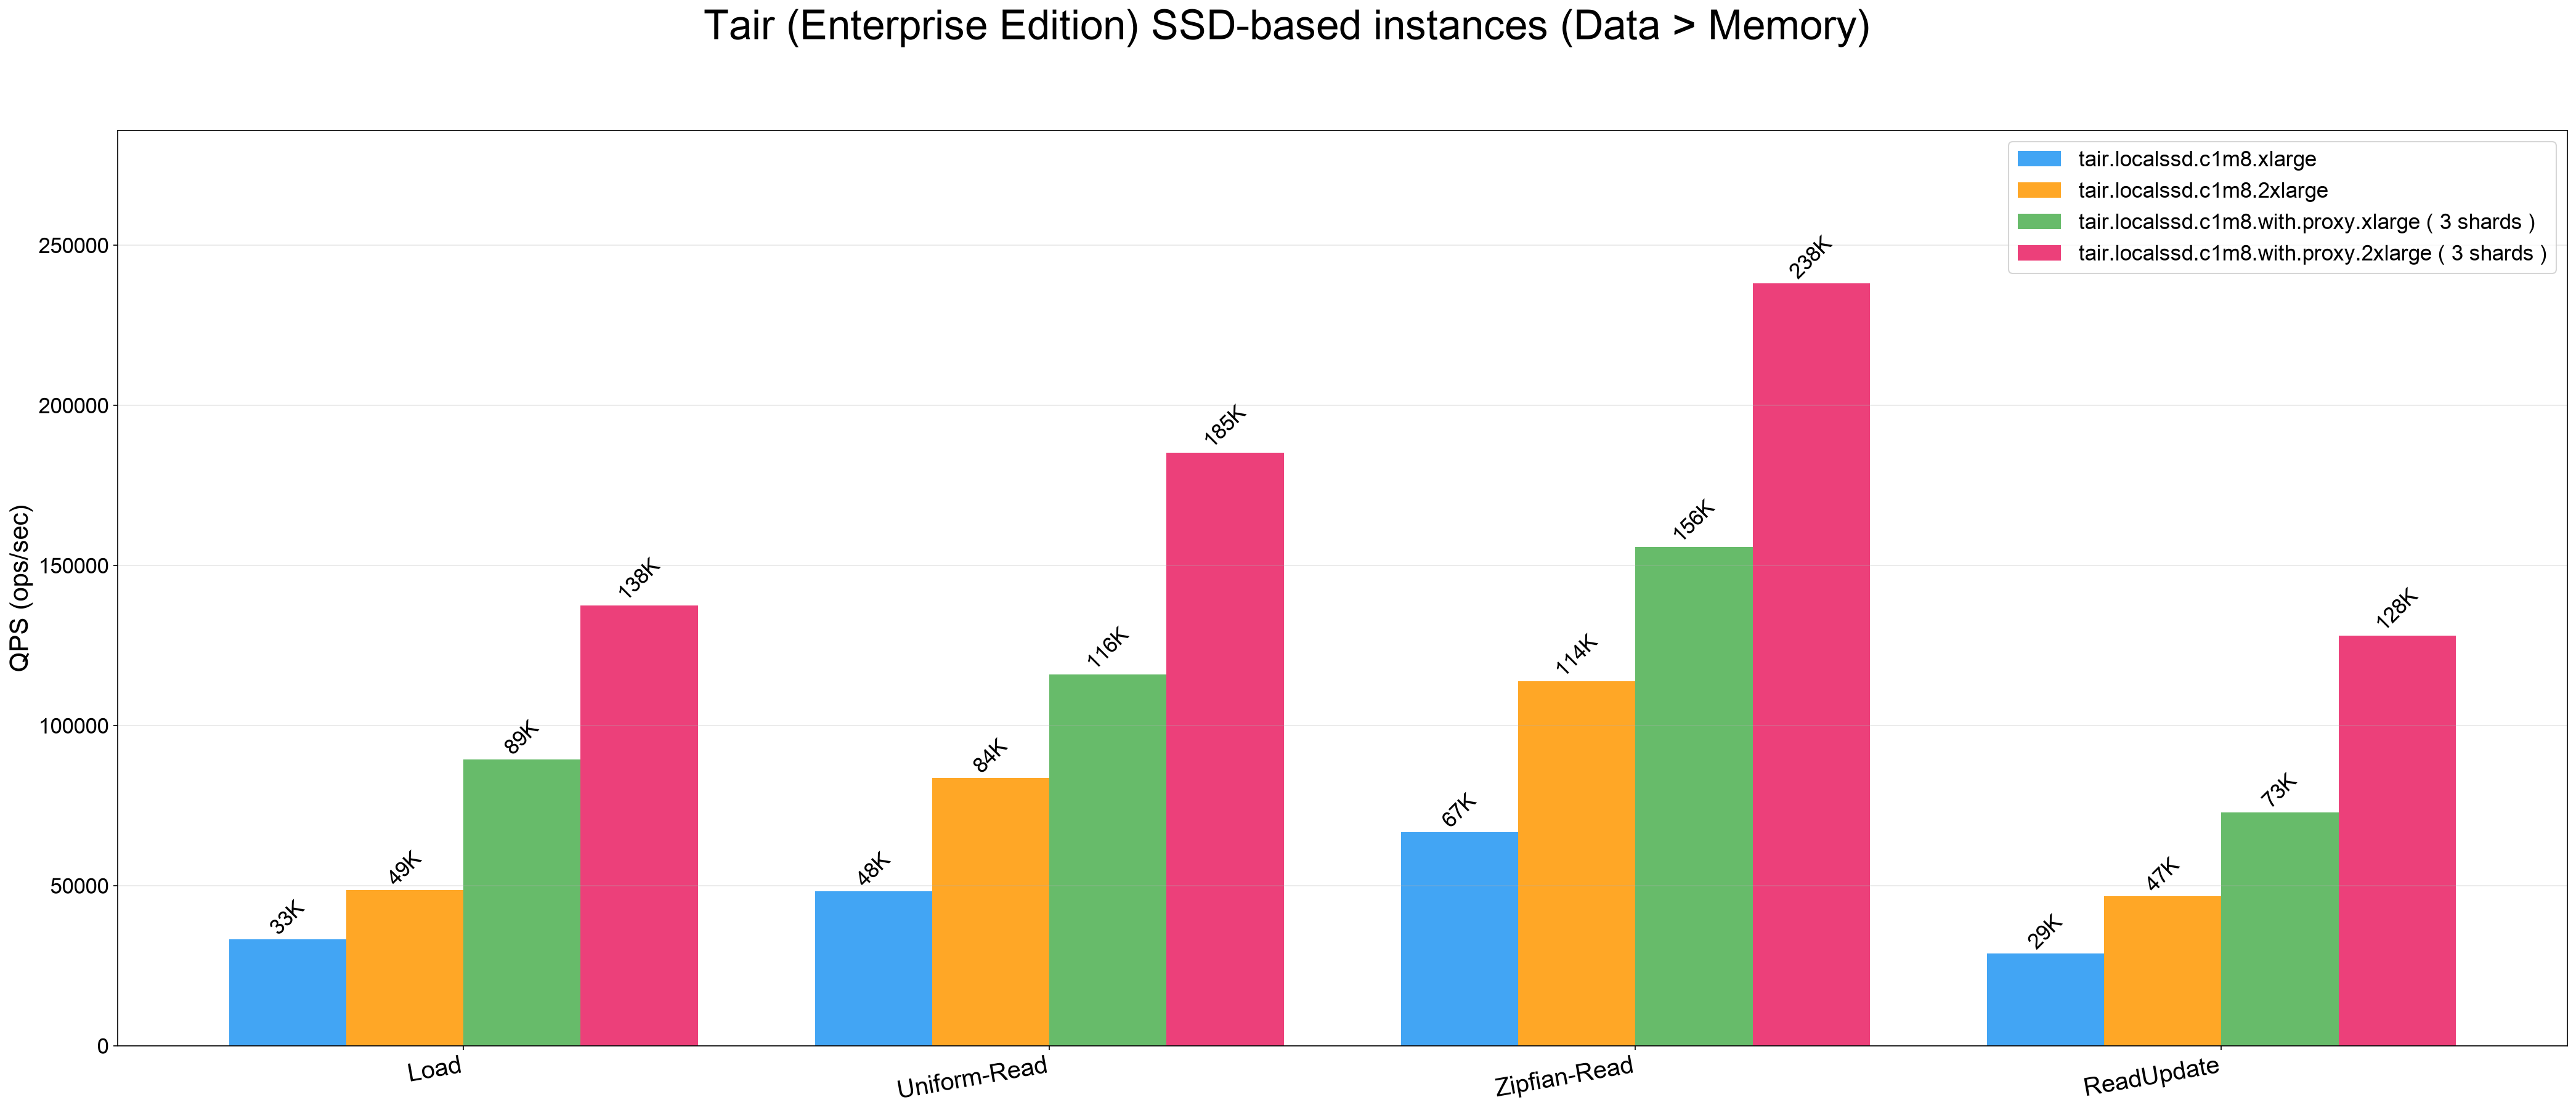
Data volume larger than memory size
Memory-to-data ratio is approximately 1:4. Most requests require disk I/O, so latency is higher than in the memory-dominant scenario above.
Instance type | YCSB configuration | Workload | QPS | Average latency (µs) | 99th percentile latency (µs) |
| recordcount=640,000,000 run_operationcount=640,000,000 threads=64 fieldlength=100 | Load | 33,198 | 1,925 | 7,699 |
Uniform-Read | 48,243 | 1,324 | 3,659 | ||
Zipfian-Read | 66,635 | 958 | 3,003 | ||
Uniform-50%Read-50%Update | 28,779 | Read: 2,169 | Read: 7,531 | ||
Update: 2,272 | Update: 7,851 | ||||
| recordcount=1,280,000,000 run_operationcount=1,280,000,000 threads=128 fieldlength=100 | Load | 48,605 | 2,631 | 8,463 |
Uniform-Read | 83,687 | 1,527 | 3,889 | ||
Zipfian-Read | 113,742 | 1,123 | 3,351 | ||
Uniform-50%Read-50%Update | 46,606 | Read: 2,652 | Read: 8,815 | ||
Update: 2,835 | Update: 9,367 | ||||
| recordcount=1,920,000,000 run_operationcount=1,920,000,000 threads=192 fieldlength=100 | Load | 89,421 | 2,144 | 15,351 |
Uniform-Read | 115,967 | 1,653 | 9,311 | ||
Zipfian-Read | 155,686 | 1,231 | 6,359 | ||
Uniform-50%Read-50%Update | 72,890 | Read: 2,585 | Read: 16,479 | ||
Update: 2,676 | Update: 16,719 | ||||
| recordcount=3,840,000,000 run_operationcount=3,840,000,000 threads=384 fieldlength=100 | Load | 137,521 | 2,789 | 16,591 |
Uniform-Read | 185,273 | 2,070 | 8,575 | ||
Zipfian-Read | 238,099 | 1,610 | 6,203 | ||
Uniform-50%Read-50%Update | 128,080 | Read: 2,930 | Read: 15,535 | ||
Update: 3,060 | Update: 15,807 |