Visual development mode
This topic describes the visual development process. For a general introduction, see Overview.
1. Create a project in visual development mode
To create a project in visual development mode, select Basic Visual Project Template when you create a new project in the editor. For more information about project development modes and saving methods, see Cloud and local projects.
2. Development interface
The visual development interface is divided into five main areas: the menu and toolbar, the left pane (Component List, Control List, and Variable List), the central flow authoring area, the right pane for node property settings, and the bottom pane (Log and Parameter panes).
Menu. Includes the following:
File: Create, open, save, and close projects. The Exit button closes the editor.
View: Show or hide panes. If you close a pane in the editor, you can select it from this menu to display it again.
Project: Manage custom software development kits (SDKs) and third-party libraries using Component Management. You can import enterprise-specific custom SDKs or third-party libraries into the project. The Publish feature lets you publish the project as an application to the enterprise marketplace.
Design: Activate the control capture tool.
Toolbar. Provides shortcut buttons for creating, opening, saving, and closing the current project, along with debugging, component management, and publishing.
Component List. Lists all available components in a tree structure, grouped by function. Drag a component to the central authoring area to add and use it.
Control List. Supports multiple ways to capture controls and provides group management. Right-click a control to copy its name, edit it, or delete it. Use the settings button to quickly select actions such as click or input.
Variable List. Contains custom variables and variables automatically generated by nodes.
Flow authoring area. Create automation flows by dragging and dropping components. You can add, delete, or disable nodes, or start running the flow from a specific node.
Node Property Settings
Log pane. Displays logs generated during flow execution, such as system logs, operation logs, and debug logs.
Parameter pane. Defines the input parameters for the flow.
3. Basic syntax
When using the visual development mode, you still need to understand the basic Python-based syntax, which includes the following:
Variables
Variables are used to save and pass data between different nodes.
In the Variable pane on the left, you can create custom variables. Basic data types, such as strings, are supported. To assign a value to a variable in the flow, see Set variable value.
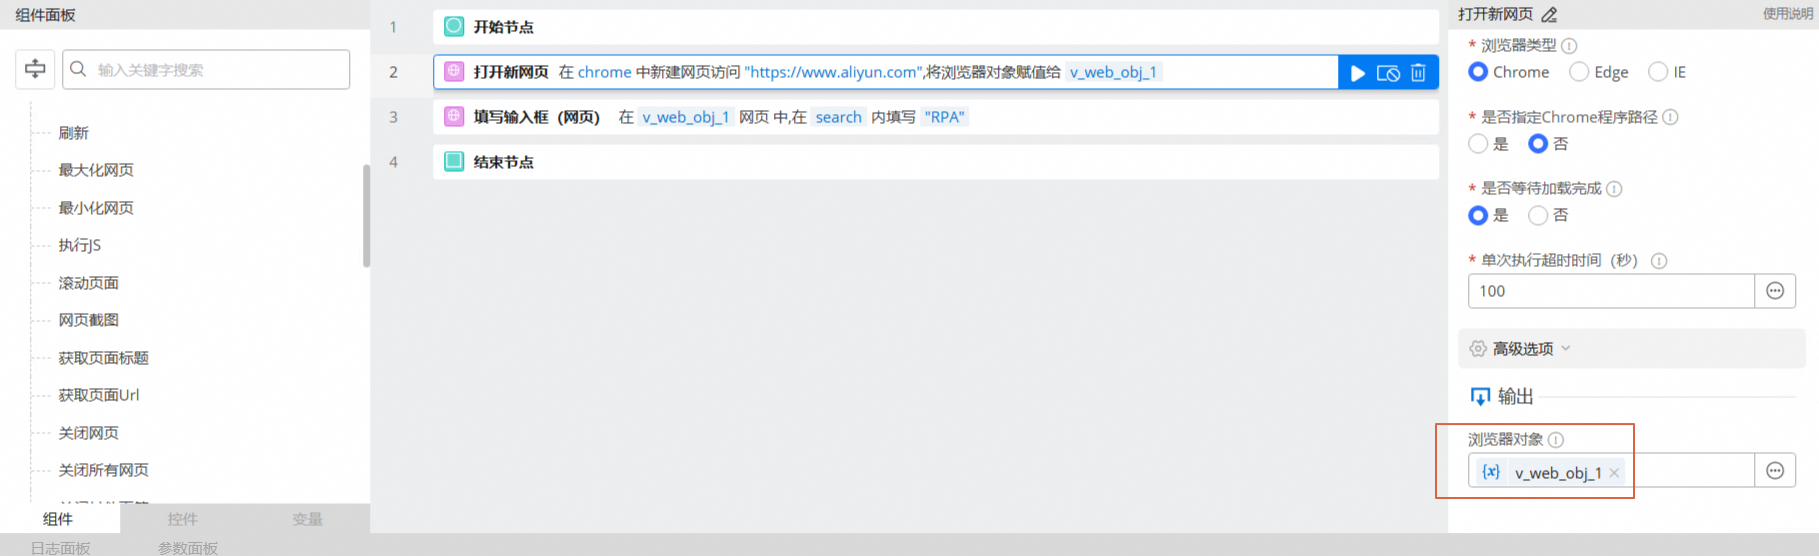
A node's output must be saved in a variable. A variable is automatically generated by default, as shown in the figure. You can use this variable in subsequent nodes.
Basic data types. The following five basic Python data types are supported.
Type
Example
Supported visual operations
String
'abcd' 'Chinese'Dictionary
dict = {} dict[1] = 'RPA Editor' dict[2] = 'RPA Robot'Number
Includes integers and decimals.
10 3.14List
['a','b','c','runoob'] [1,2,3]Boolean
True
False
None
Logic processing
Category
Purpose
Related logic processing components
Loop
Use loops for repetitive operations, such as looping a specific number of times or looping through similar controls.
Diagnosis
Use conditionals to execute different branches of actions based on different conditions, such as checking if a web page element appears or if a string consists entirely of specified content.
Exception handling
This is the try-catch-finally block.
4. Capture controls
A "control" is a basic object that an RPA robot uses to automate UI interactions. Controls represent UI elements in an application, such as input boxes, search buttons, page titles, or logon buttons. For more information, see Capture and use controls.
5. Use visual components
More than 300 visual components are built in. The following table lists common component categories.
Category |
Purpose |
Related components |
Webpage |
Operate on Chrome, Edge, and IE. |
|
Window |
Operate on window programs in Windows, such as client software. |
|
Mouse and keyboard |
Mouse and keyboard operations, such as entering keyboard shortcuts, clicking the mouse, or scrolling the mouse wheel. |
|
Excel |
Operate on Microsoft Office and WPS, such as getting the value of an Excel cell or writing to an Excel area. |
|
Word |
Operate on Microsoft Office and WPS, such as reading text from Word or replacing content in Word. |
|
Loop and conditional |
Such as looping a specific number of times, looping based on a condition, looping through similar controls, conditional branching, and checking if a web page element appears. |
|
Flow components |
Get the flow's input parameters and the robot's runtime environment context. |
|
Programming components |
Such as setting variables, calling custom scripts, delaying execution, and recording logs. |
|
Data processing |
Perform operations on basic data types, including strings, numbers, lists, and dictionaries. |
|
System components |
Perform Windows system operations, such as running commands, closing processes, locking the screen, creating files, getting the system time, and compressing files. |
|
Network components |
Send and receive emails, send notifications to WeCom and DingTalk groups, make HTTP requests, and configure proxy settings. |
|
AI capabilities |
Use Alibaba Cloud OCR and perform operations using computer vision (CV). |
6. Extension methods
The editor has a built-in Python runtime environment. For more information, see View the engine's built-in third-party Python libraries.
If the built-in libraries do not meet your needs, see Reference third-party Python libraries.
During flow development, you can extract common operations into custom components for reuse across automation flows. For more information, see Develop and use custom components.
NoteOnly projects in code development mode can be published as components. You can use custom components in visual development mode.
7. Local debugging in the editor
To record logs, use the Record Log component.
Troubleshoot errors.
Nodes with errors are marked with an indicator on the right and display a relevant error message.
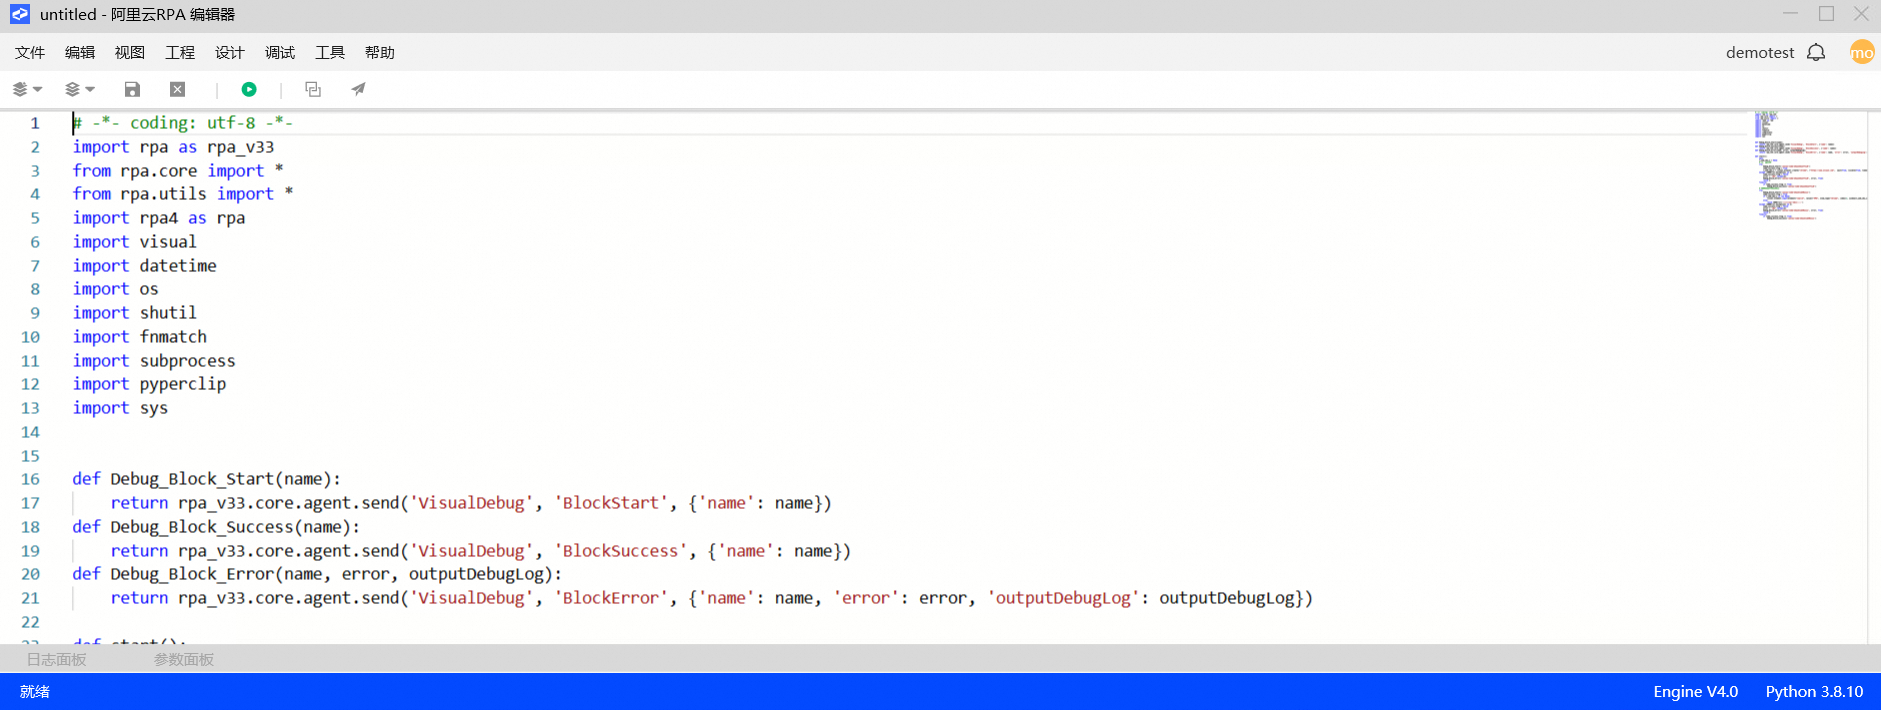
To troubleshoot further based on the error line number, press the keyboard shortcut Ctrl+Shift+P to view the code corresponding to the visual flow. Press the same shortcut to return to the visual interface.
8. Publish
After local development and debugging are complete, a project must be published as an application before it can be used by multiple robots. For more information, see Publish and manage applications.
10. Iterative development
To ensure that the iterative development and testing process does not affect online usage, see Test applications and publish them online.