The Change Trend of Instance Quantity With Scaling Metrics chart shows how SAE automatically adjusts instance counts based on your scaling policy. Use it to verify that your Auto Scaling rules are triggering at the right thresholds and to diagnose unexpected scaling behavior.
Prerequisites
Before you begin, ensure that you have:
A deployed application. For more information, see Deploy applications.
An Auto Scaling policy that has been created and enabled. For more information, see Configure an Auto Scaling policy.
View the scaling trend chart
Log on to the SAE console. In the left-side navigation pane, choose Applications > Applications. In the top navigation bar, select a region and a namespace from the Namespace drop-down list, then click the application name.
On the Basic Information page, click the Auto Scaling tab.
In the Change Trend of Instance Quantity With Scaling Metrics Instance section, set a time range to view scaling activity over the specified period.
The chart displays data for the following metrics. Select the metric that corresponds to the scaling rule configured in your Auto Scaling policy.
CPU utilization
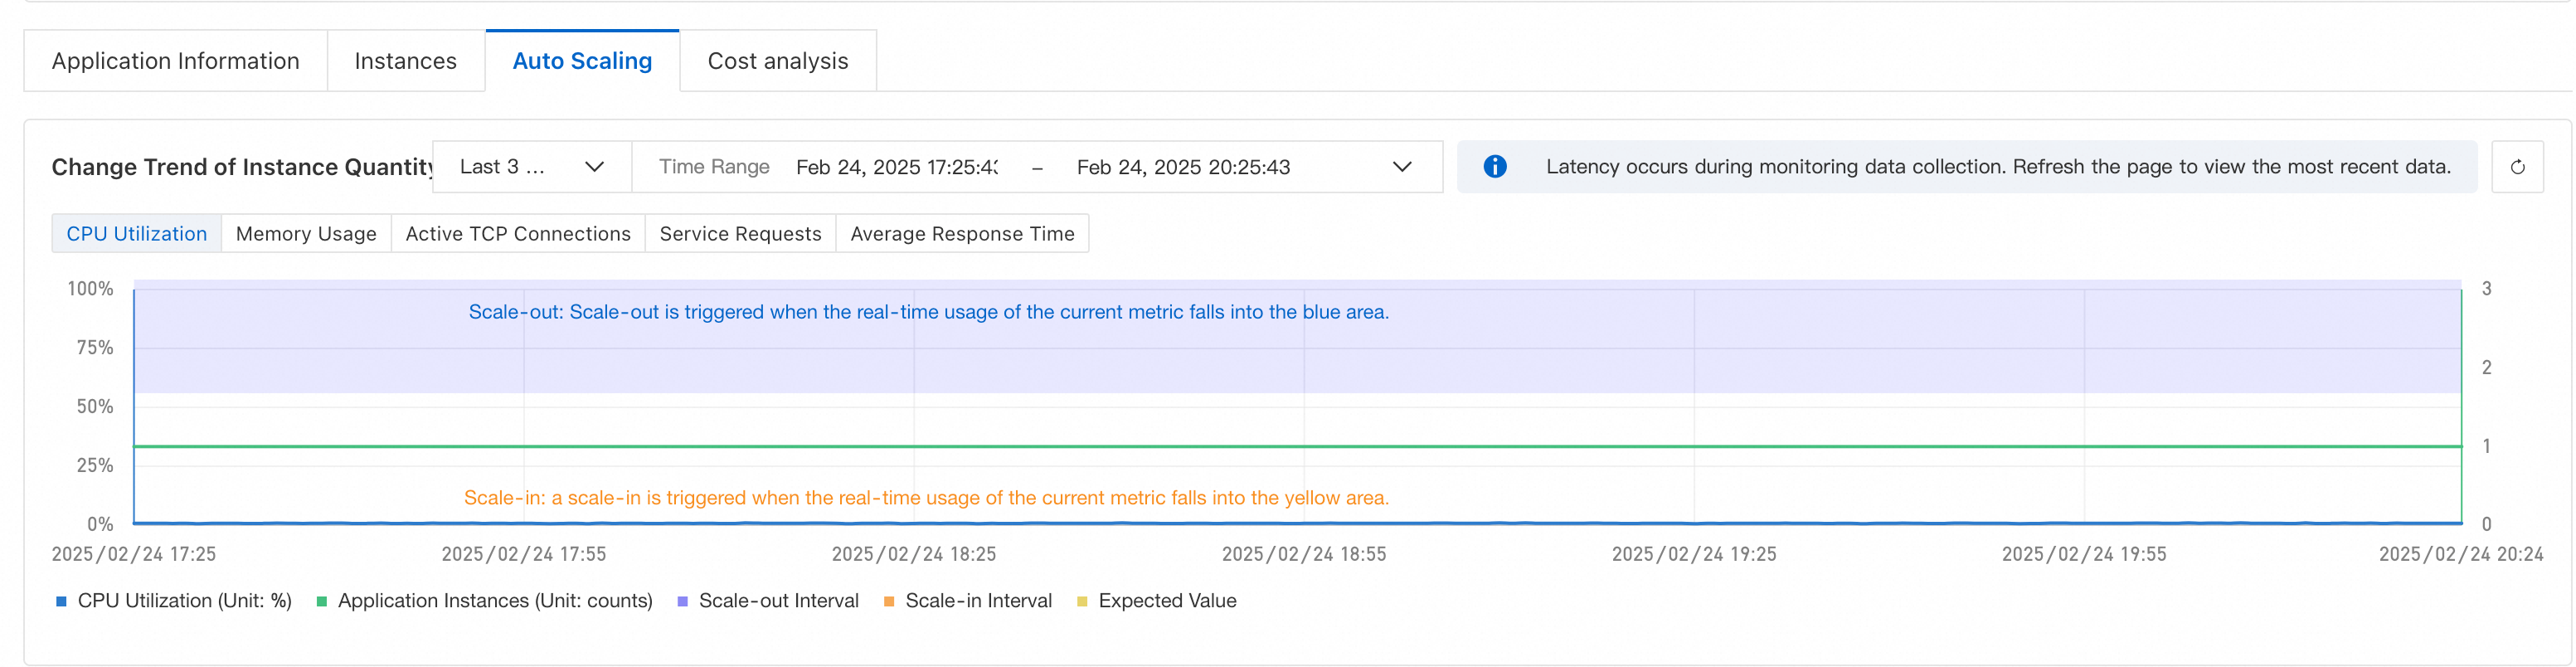
The CPU utilization chart displays six parameters:
| Parameter | Description |
|---|---|
| CPU Utilization | The percentage of CPU resources in use — the primary indicator of system load. |
| Application Instances | The number of instances deployed for application operations. |
| Scale-out Interval | The maximum increase in application instances when CPU utilization surpasses the predefined threshold. |
| Scale-in Interval | The maximum reduction in application instances when CPU utilization drops to the predefined threshold. |
| Expected Value | The scale-out and scale-in thresholds set in the Horizontal Pod Autoscaler (HPA) configuration. |
| Scaling Description | The reason for each instance count change. |
These parameters are populated from your HPA configuration. If a parameter was not configured, it does not appear in the chart. The same applies when other metrics are configured with HPA.
Memory usage
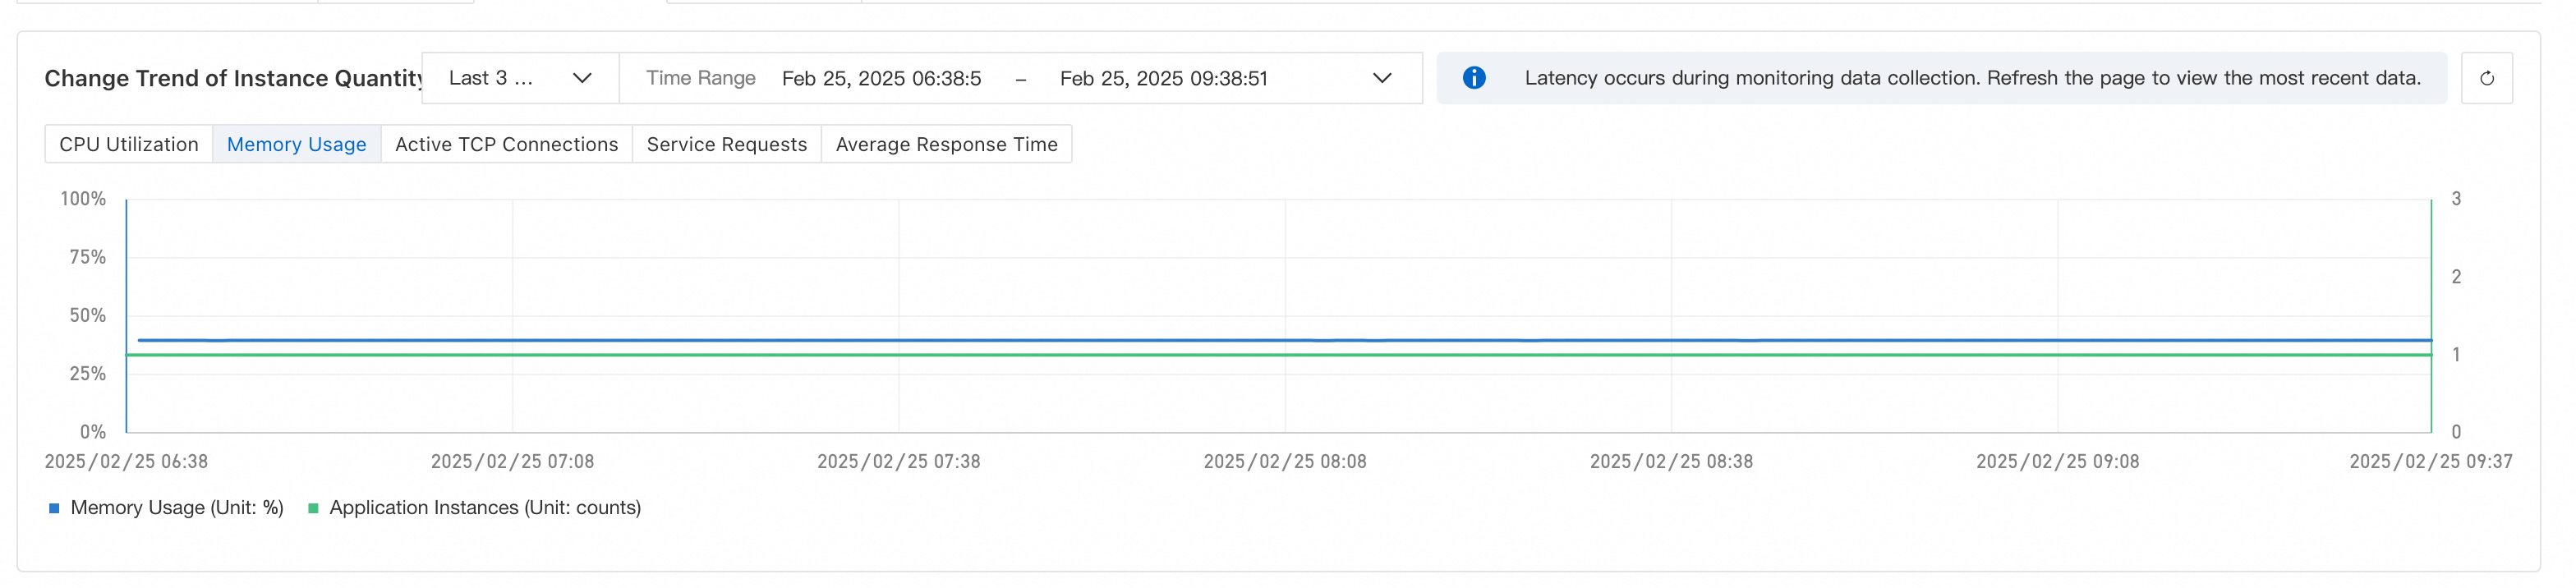
Shows the ratio of used memory to total available memory over the selected period.
Active TCP connections
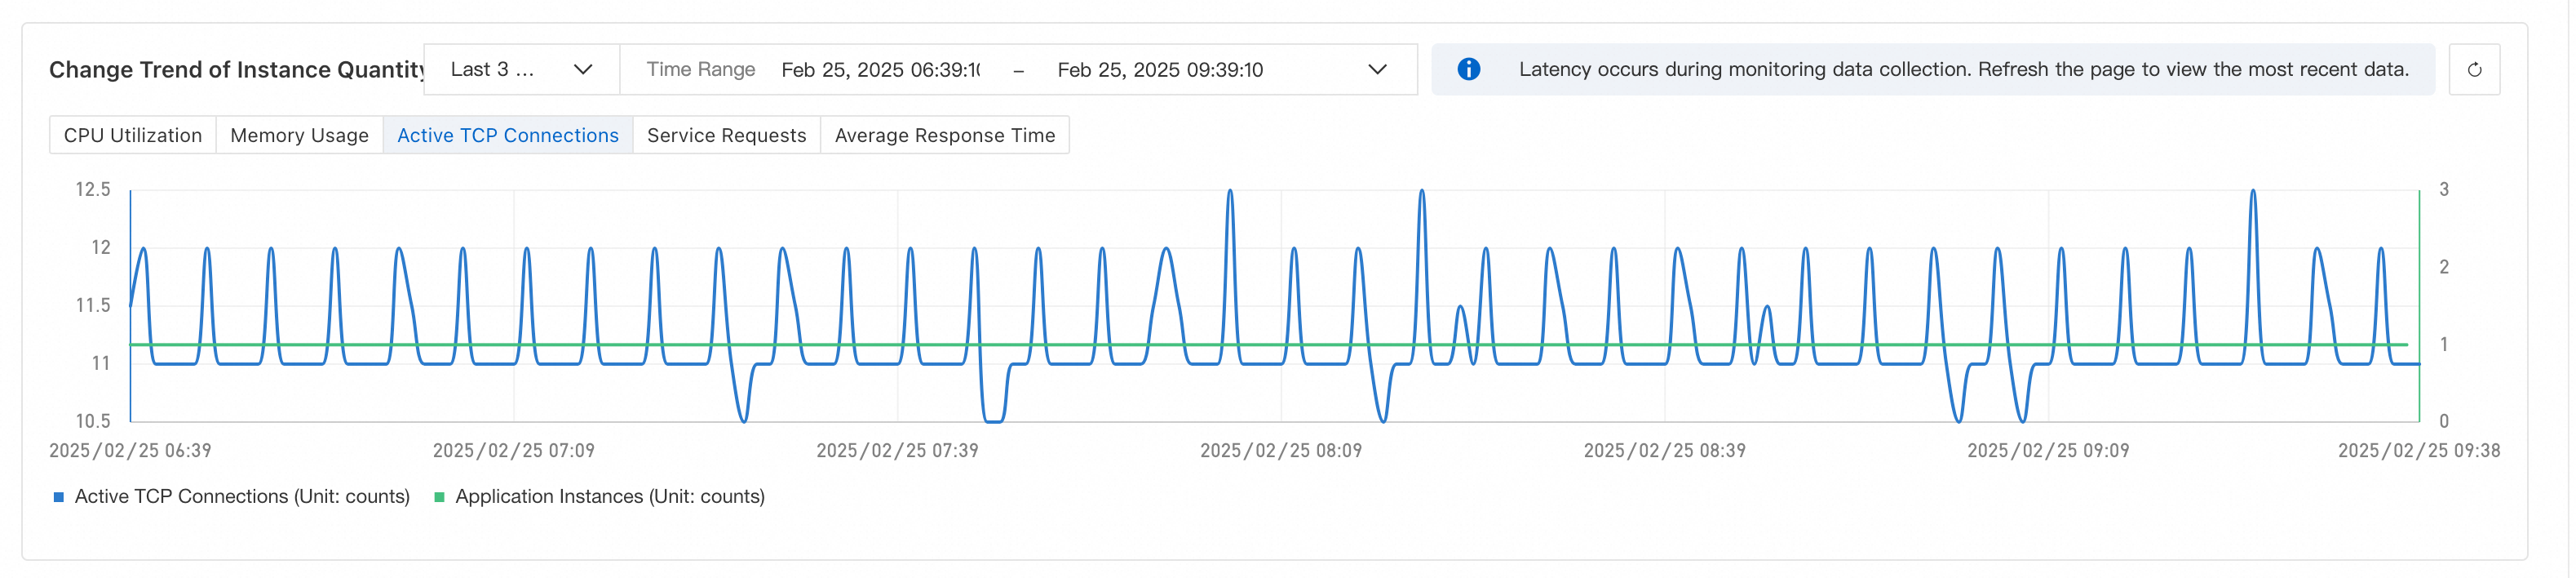
Shows the number of active TCP connections processed by the server or application over the selected period.
Service requests
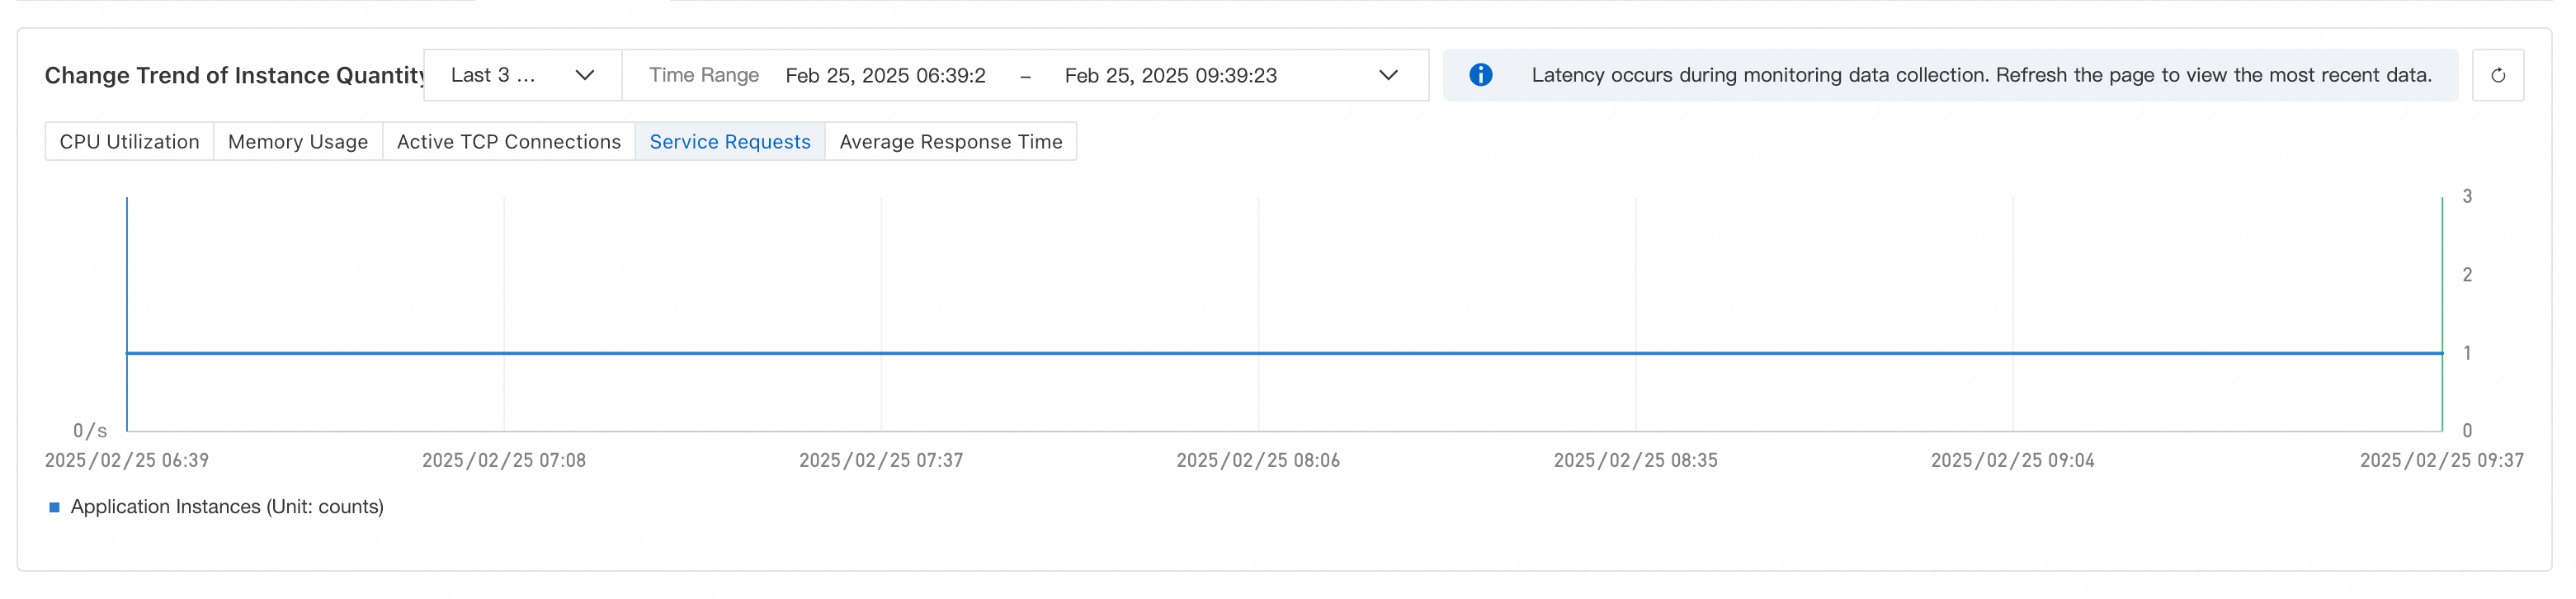
Shows the number of requests received by the application over the selected period.
Average response time
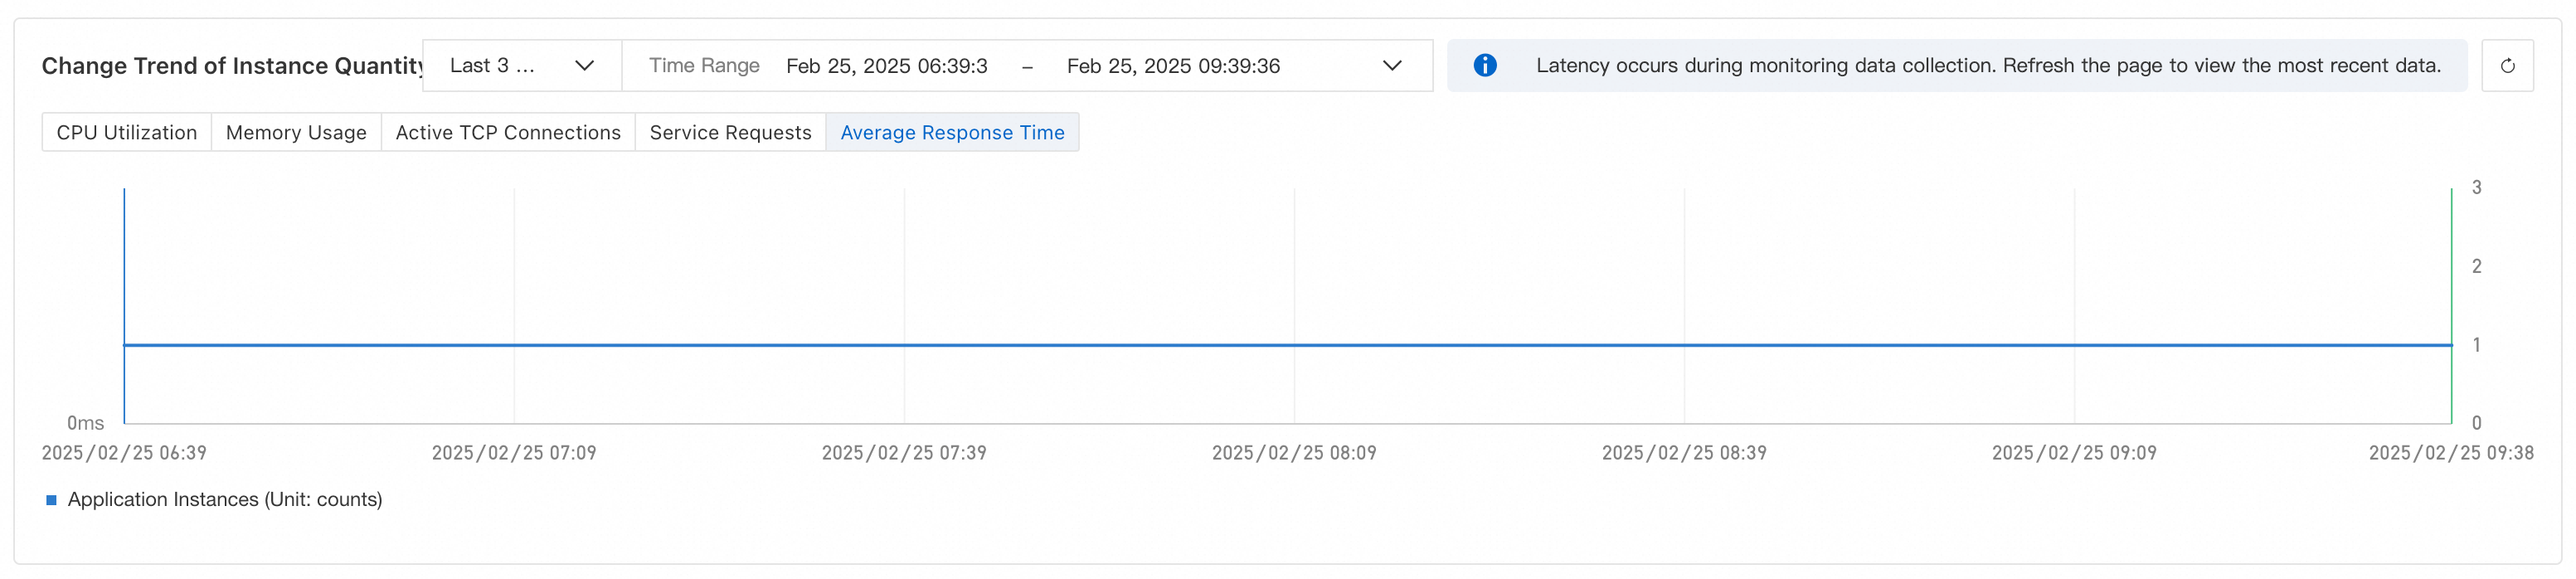
Shows the average time the application takes to process a request over the selected period.