View instance monitoring information
View monitoring information for your Simple Application Server instance—including data transfer, vCPU, memory, and system disk usage—to track resource utilization and improve operational efficiency.
Procedure
You can view instance monitoring information in either the Simple Application Server console or the CloudMonitor console, depending on your needs.
-
Simple Application Server console: Provides monitoring information for metrics such as data transfer, vCPU utilization, memory usage, network bandwidth, and disk I/O.
-
CloudMonitor console: Offers more granular monitoring.
Simple Application Server console
-
Go to the Servers page in the Simple Application Server console.
-
On the Servers page, click the instance ID on the card of the server you want to monitor.
If you have many servers, you can enter a public IP address or instance ID in the search box to filter them.
-
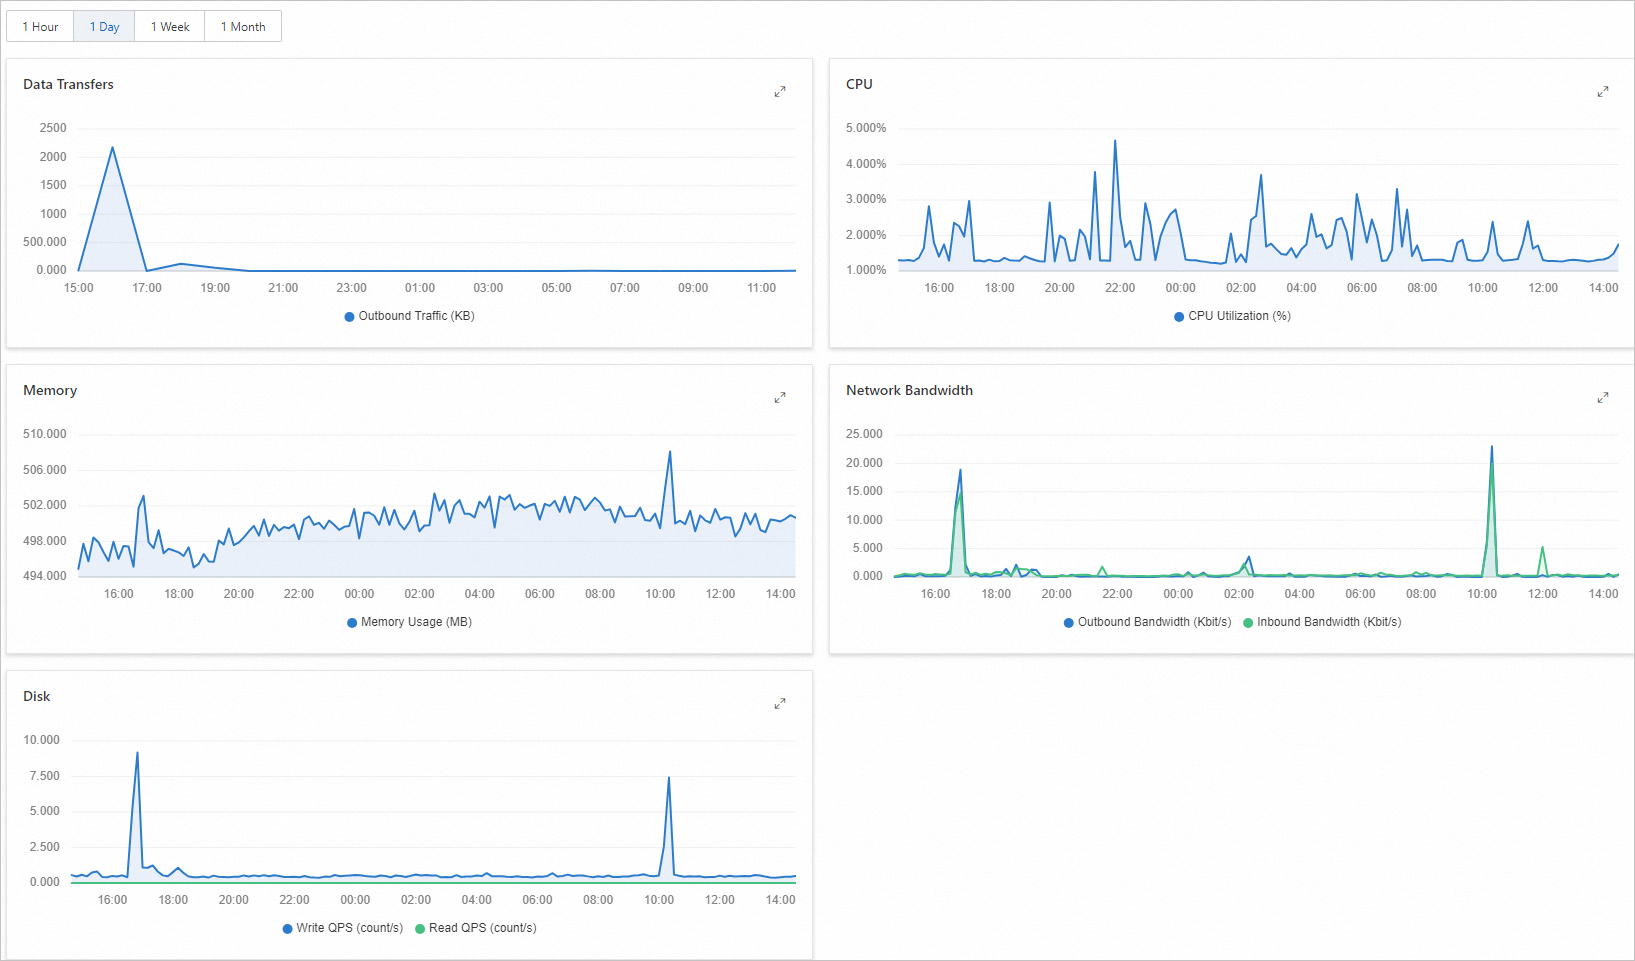
In the Server Monitoring section of the Server Overview page, view the server monitoring information.
NoteIf your plan does not include a fixed monthly data transfer package, the console does not display data transfer usage.
The monitoring information includes five metrics: data transfer, vCPU, memory, network bandwidth, and disk. For the data transfer, vCPU, and disk metrics, you can click View Details for more information.
-
Next to a metric, click View Details to view its detailed usage data.
Note-
On the monitoring information page, you can view detailed historical data for the server's data transfer, vCPU, memory, network bandwidth, and system disk.
-
The minimum query interval for data transfer is one hour. Therefore, queries for the last hour return no data.
-
CloudMonitor console
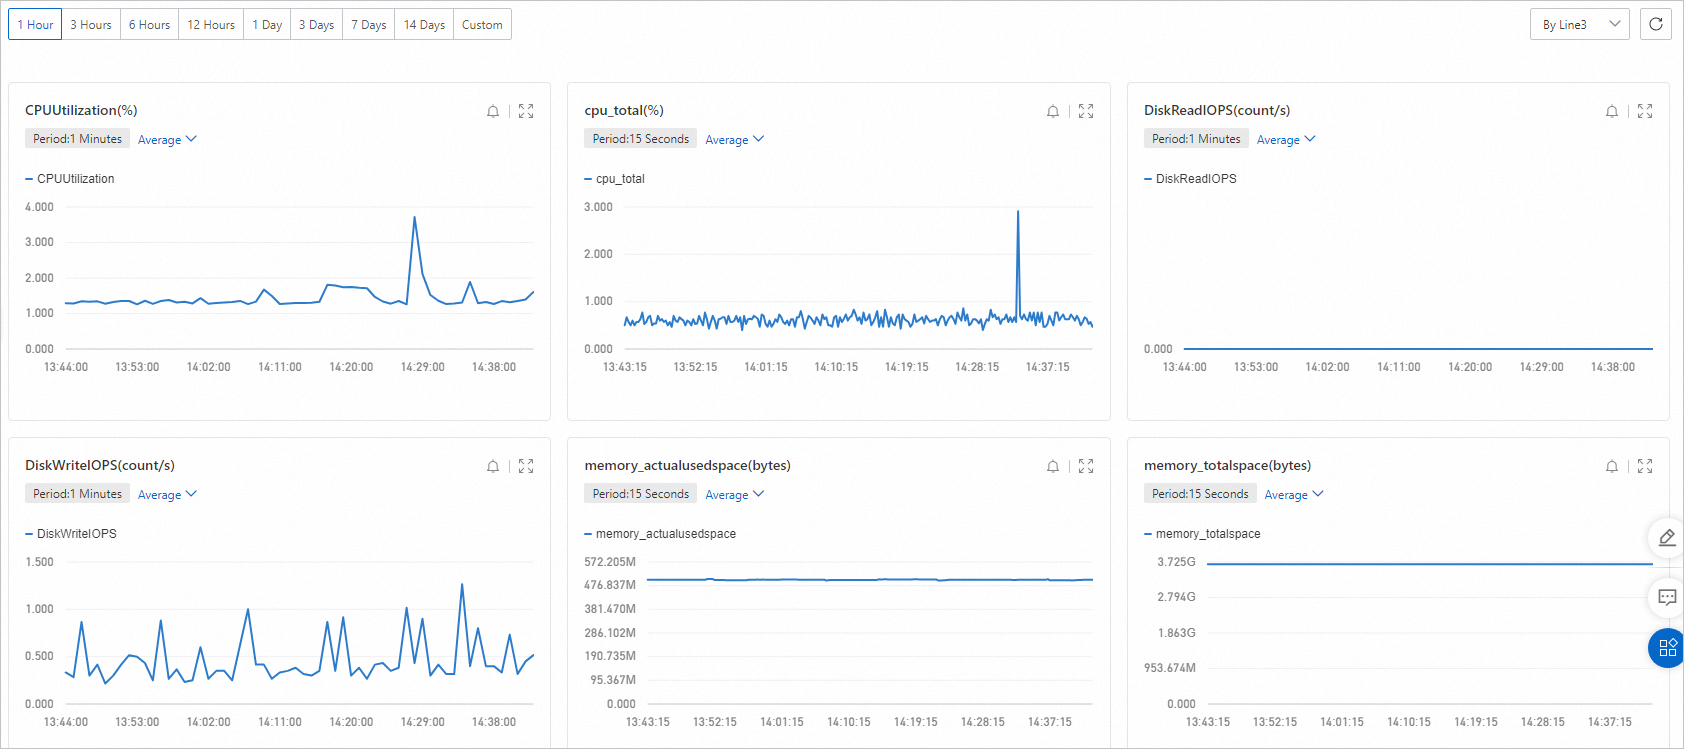
CloudMonitor provides cloud users with an out-of-the-box, enterprise-level, open, one-stop monitoring solution. You can view monitoring information for Simple Application Server in the CloudMonitor console. For more information, see Monitoring metrics.
-
Go to the Cloud Service Monitoring page in the CloudMonitor console.
-
In the Computing section of the Cloud Service Monitoring page, click Simple Application Server.
-
In the upper-left corner of the page, select the region where your server is located. Then, in the Actions column, click Monitoring Charts.
View the monitoring charts for the instance.
NoteCloudMonitor retains monitoring data for up to 30 days.
-
To receive timely resource alert notifications, create an alert rule. For more information, see Create an alert rule.