View server information
After creating a server, you can view its details, such as resource configurations, expiration date, and resource usage, in the Simple Application Server console. You can also use the remote connection feature to view and manage files on the server.
View basic server information
View the Server ID, Server Name, Server Status, Configuration Information, IP Address, and Expired At. You can also perform operations on the instance, such as Connect and Reset Password.
-
Go to the Servers page in the Simple Application Server console.
The Servers page shows basic information for all Simple Application Server instances under your account. The following figure shows an example.
NoteIf you have multiple servers, use the search box to filter them. For the search category, Server Name supports fuzzy search, while Server ID, Public IP Address, and Server Status support only exact search.
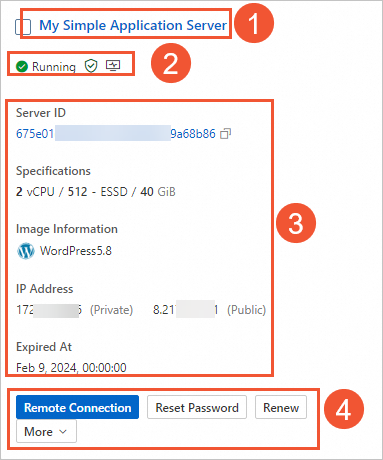
Description of the numbered items:
①: The name of the instance.
NoteYou can hover over the instance name and click the
 icon to modify the name.
②: The running status, security, and monitoring information of the instance.
For more information about instance statuses, see Instance lifecycle.
Hover over the
 icon to view firewall and security protection information. If the
  icon appears, your server has the following risks. Address them promptly.
The firewall is disabled or the default ports 22, 80, and 443 are deleted.
The server has high-risk vulnerabilities.
Hover over the
 icon and click View Monitoring to view monitoring information about the instance. For more information, see View instance monitoring information.
③: The main information about the instance, including its instance ID, specifications, image, public IP address, and expiration date.
NoteYou can hover over the instance ID or public IP address and click the
 icon to copy the instance ID or public IP address.
④: The action buttons for the instance are, in order: Remote Connection, Reset Password (or Set Password for a new instance), Renew, and More.
WarningStopping or restarting a server interrupts your services. Proceed with caution.
 icon to copy the instance ID or public IP address.
View detailed server information
View basic information like the instance's Server ID, Status, and IP Address, along with its Data Transfers usage, vCPUs utilization, Security Protection status, and the installation status of Command Assistant and the CloudMonitor Agent.
-
Log on to the Simple Application Server console.
Click the instance ID of the target server.
On the Server Overview page, view server details in the sections described in the following table.
Section
Description
Server Monitoring
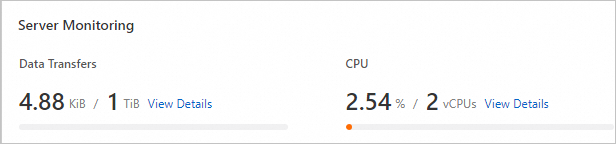
This section displays the instance's data transfer, vCPU usage, memory size, and system and data disk sizes. You can also click View Details to view more detailed data. For an example of how to view data transfer usage, see Example: Check data transfer usage.
NoteIf you purchased a plan that does not include a fixed monthly data transfer quota, bandwidth information is displayed instead of data transfer usage.
Basic Information
This section displays information such as the Server ID, image, IP Address, and Expired At.
Application building guide
This section provides steps to build an application, helping you accelerate deployment.
Security Protection
This section displays the protection types and security status. For more information about security, see Basic security services.
Command Assistant
This section displays the installation status of Command Assistant:
If the status is Installed, you can click Run Command to run O&M commands on the server without logging in. For more information, see Run commands.
If the status is Not Installed, you can click Install and follow the on-screen instructions to automatically install the Cloud Assistant agent.
CloudMonitor Agent
This section displays the status of the CloudMonitor Agent:
If the status is Running, the CloudMonitor Agent is working as expected.
If the status is Stopped, click Install. Otherwise, the Server Monitoring section will not display memory and disk monitoring information.
Related products
This section displays information about related products, including Web Hosting, ECS, and WUYING Workspace. Click a product name to visit its official product page.
Example: Check data transfer usage
The console does not display data transfer usage for plans without a fixed monthly data transfer quota.
Check the data transfer usage of a single server
-
Go to the Servers page in the Simple Application Server console.
On the Servers page, click the instance ID of the server that you want to check.
In the Server Monitoring section of the Server Overview page, view the server's data transfer usage (Used/Total).
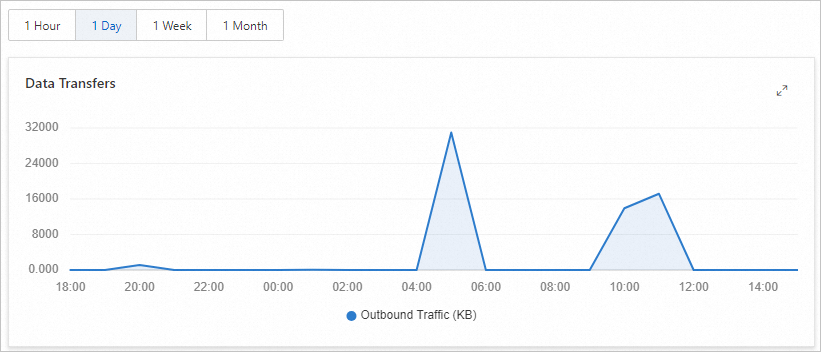
Click View Details to view the daily data transfer usage of the server.
NoteThe Monitoring page shows detailed information about the server's disk, CPU, memory, network, and data transfer over a specified time range.
Data transfer usage is sampled at intervals longer than one hour. If you query data transfer usage for the last hour, no data is displayed.
Check data transfer usage of all servers
Filter by time period at an hourly granularity to download and view detailed traffic usage for Simple Application Server.
-
Log on to Expenses and Costs.
-
In the navigation pane on the left, choose .
-
In the upper-right corner of the Bill Details page, click View Usage Details and configure the following settings.
Parameter
Description
Time Period
Select the time range you want to query. You can query and export usage details for up to the last 12 months.
Queries are supported only within calendar months. For example, if the start date is 2025-05-01, the latest end date you can select is 2025-05-31. You cannot select 2025-06-01.
Commodity Name
Select Simple Application Server.
Billable Item
Select Free transfer or Paid transfer.
Billable Item
Select Simple Application Server.
Time Unit
The default is Hours.
-
Click Export CSV.
-
On the Export Record page, wait for the file to be exported.
After the CSV file is exported, in the Action column, click Download to download the file to your local computer and view the usage details for Simple Application Server.
Note-
The unit of traffic is Byte.
-
You can filter the view by conditions such as instance ID or region.
The downloaded CSV file contains the following fields: User Account, Source, SWAS, Start Time, End Time, Instance ID, Total Traffic, Paid Traffic, Free Traffic, and Region.
-