Change point detection functions
Change point detection functions are used to detect change points in time series data.
Change point detection functions can detect the following two types of change points:
Changes in statistical attributes over a specified period.
Significant breaks in the sequence data.
Function list
Function | Description |
Detects intervals with different statistical features in a time series. The interval endpoints are change points. | |
Finds points in a time series where a statistic steeply increases or decreases. |
ts_cp_detect
Function format:
If you cannot determine the window size, you can use the following function. By default, the algorithm uses a window of 10 for detection.
select ts_cp_detect(x, y, samplePeriod)To test the results based on your business data, you can use the following function and adjust the minSize parameter.
select ts_cp_detect(x, y, minSize)
The following describes the parameters:
Parameter | Description | Value |
x | The time column, sorted in ascending order. | A Unix timestamp in seconds. |
y | The value column that contains the data for each timestamp. | - |
minSize | The minimum length of a continuous segment. | The minimum value is 3. The maximum value is 1/10 of the input data length. |
Example:
Query and analysis
* | select ts_cp_detect(stamp, value, 3) from (select '("__time__" - ("__time__" % 10))' as stamp, avg(v) as value from log GROUP BY stamp order by stamp)Output
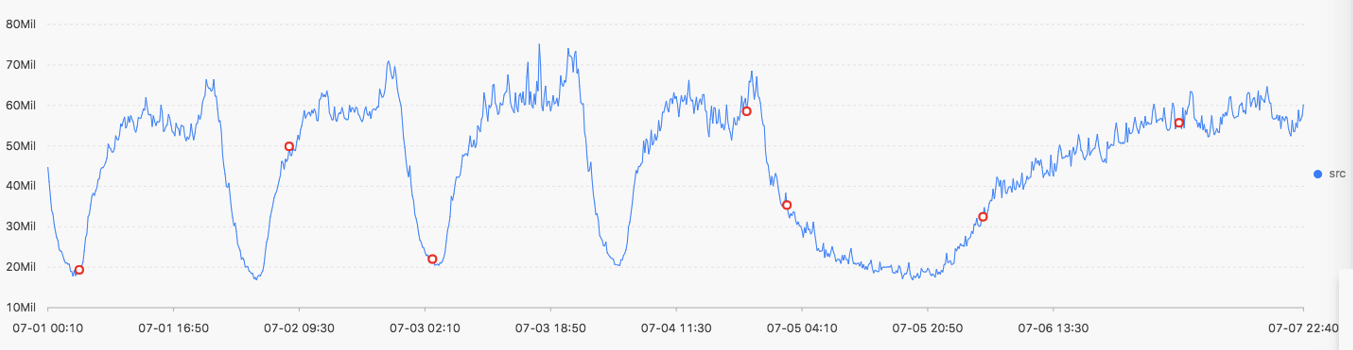
The following items are displayed:
Display item | Description | |
Horizontal axis | unixtime | The timestamp of the data in seconds. For example, 1537071480. |
Vertical axis | src | Raw data. For example, 1956092.7647745228. |
prob | The probability that the point is a change point. The value ranges from 0 to 1. | |
ts_breakout_detect
Function format:
select ts_breakout_detect(x, y, winSize) The following describes the parameters:
Parameter | Description | Value |
x | The time column, sorted in ascending order. | A Unix timestamp in seconds. |
y | The value column that contains the data for each timestamp. | - |
winSize | The minimum length of a continuous segment. | The minimum value is 3. The maximum value is 1/10 of the input data length. |
Example:
Query and analysis
* | select ts_breakout_detect(stamp, value, 3) from (select '("__time__" - ("__time__" % 10))' as stamp, avg(v) as value from log GROUP BY stamp order by stamp)Output
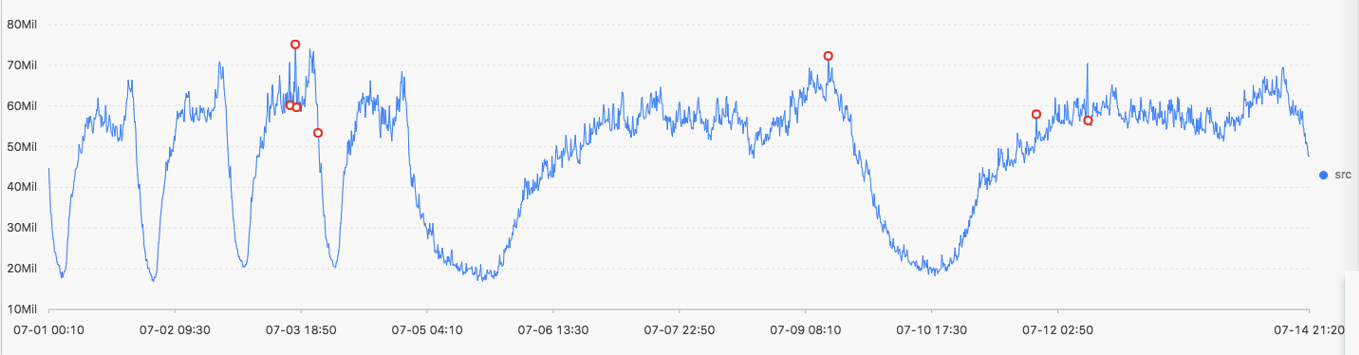
The following items are displayed:
Display item | Description | |
Horizontal axis | unixtime | The timestamp of the data in seconds. For example, 1537071480. |
Vertical axis | src | Raw data. For example, 1956092.7647745228. |
prob | The probability that the point is a change point. The value ranges from 0 to 1. | |