Docker container logs (standard output/files)
LoongCollector collects the standard output (stdout and stderr) and the text log files of Docker containers, and aggregates them from multiple nodes into a single LogStore in Simple Log Service. Centralized collection removes the need to search the logs of individual containers node by node, and it enables structured parsing, data masking, filtering, and efficient query and analysis.
Requirements
Before you deploy LoongCollector, check the following requirements and limits:
-
Permission requirements — The Alibaba Cloud account or RAM user that you use for the deployment must have the
AliyunLogFullAccesspermission. -
Docker and LoongCollector requirements:
-
If your Docker Engine version is v29.0 or later, or the minimum supported Docker API version is 1.42 or later, use LoongCollector 3.2.4 or later. Otherwise, LoongCollector cannot collect container standard output or file logs.
-
LoongCollector 3.2.4 and later supports Docker API versions 1.24 to 1.48.
-
LoongCollector 3.2.3 and earlier supports Docker API versions 1.18 to 1.41.
-
-
Limitations on collecting standard output:
-
You must add
"log-driver": "json-file"to the Docker configuration file daemon.json. -
On CentOS 7.4 or later, except CentOS 8.0, you must set
fs.may_detach_mounts=1.
-
-
Limitations on collecting text logs — Only the overlay and overlay2 storage drivers are supported. For other storage drivers, you must mount the log directory manually.
Decide the following before you run the deployment commands in Step 1, because each decision is encoded in the
docker pullanddocker runcommands: -
Image and region — The image that you pull, and the region ID that you pull it from.
-
Log upload channel — The network transmission type that the
${sls_upload_channel}variable encodes. For a comparison of the internal network, Internet, and transfer acceleration options, see the Appendix: Network transmission types section of this topic. -
Machine group identifier — The custom identifier that you pass in the
${user_defined_id}variable. The identifier must be unique within the region, and the machine group must use the same value.
Collection configuration workflow
The following list maps the collection workflow to the sections of this topic:
-
Preparations: Create a project and a LogStore. A project is a resource management unit that isolates logs from different applications, and a LogStore stores logs.
-
Step 1: Configure a machine group (install LoongCollector): Install LoongCollector on the servers from which you want to collect logs and add them to a machine group. Use the machine group to centrally manage collection nodes, and to distribute configurations to and monitor the status of your servers.
-
Step 2: Create and configure a log collection rule
-
Global and input configuration: Define the name of the collection configuration, and the source and scope of log collection.
-
Log processing and structuring: Configure processing rules based on the log format.
-
Multi-line logs: This applies when a single log entry spans multiple lines, such as a Java exception stack or a Python traceback. Use a first-line regular expression to identify the starting line of each entry.
-
Structured parsing: Configure a parsing plugin, such as regular expression, delimiter, or NGINX mode, to extract structured key-value pairs from raw strings for easier querying and analysis.
-
-
Log filtering (Data Filtering): Configure a collection blacklist and content filtering rules to keep only useful log content and reduce redundant data transmission and storage.
-
Log categorization: Configure topics and log tagging to flexibly distinguish logs from different applications, containers, or source paths.
-
Output configuration: Keep the collected logs in the current LogStore or distribute them to multiple LogStores.
-
-
Step 3: Configure query and analysis (Query and Analysis Configurations): A full-text index is enabled by default and supports keyword searches. We recommend that you also enable a field index so that you can run precise queries and analysis on structured fields and improve search efficiency.
-
Step 4: Validation and troubleshooting: After you finish the configuration, verify that logs are collected. If you encounter issues such as no collected data, heartbeat failures, or parsing errors, see FAQ.
Preparations
Before you collect logs, plan and create the project and LogStore that manage and store your logs. If you already have these resources, skip this section and go to Step 1: Configure a machine group (install LoongCollector).
To create a project
-
Log on to the Simple Log Service console.
-
Click Create Project and configure the following parameters:
-
Region: Select a region based on the location of your log sources. You cannot change this setting after creation.
-
Project Name: The name must be globally unique within Alibaba Cloud. You cannot change it after creation.
-
-
Leave the other settings at their default values and click Create. For more information about the other parameters, see Create a project.
To create a LogStore
-
Click the project name to go to the destination project.
-
In the left-side navigation pane, choose
 Logstores and click +.
 -
On the Create LogStore page, complete the following core settings:
-
Logstore Name: Enter a name that is unique within the project. You cannot change the name after creation.
-
Logstore Type: Select Standard or Query based on the specification comparison.
-
Billing Mode:
-
Pay-by-feature (Cannot Be Changed): You are billed separately for each resource, such as storage, indexing, and read/write operations. This mode suits small-scale scenarios or scenarios in which your feature usage is not yet certain.
-
Pay-by-ingested-data: You are billed only for the raw data ingested. This mode provides 30 days of free storage and free features such as data transformation and data shipping. It suits business scenarios with a retention period close to 30 days or with complex data processing pipelines.
-
-
Data Retention Period: Specify the number of days to retain logs. Valid values: 1 to 3,650. A value of 3,650 indicates permanent retention. Default value: 30.
-
-
Leave the other settings at their default values and click OK. For more information about the other settings, see Manage a LogStore.
Step 1: Configure a machine group (install LoongCollector)
Deploy LoongCollector as a container on the Docker host machine and add it to a machine group. Use the machine group to centrally manage multiple collection nodes, distribute configurations, and monitor status.
1. Pull the image
On a host machine that has Docker installed, run the following command to pull the LoongCollector image. Replace ${region_id} with the region ID of the region that hosts the host machine or of a nearby region, such as cn-hangzhou, to improve download speed and stability.
# LoongCollector image address (recommended)
docker pull aliyun-observability-release-registry.${region_id}.cr.aliyuncs.com/loongcollector/loongcollector:v3.0.12.0-25723a1-aliyun
# Logtail image address
docker pull registry.${region_id}.aliyuncs.com/log-service/logtail:v2.1.11.0-aliyun
2. Start the LoongCollector container
Run the following command to start the container. Make sure that you mount the required directories and set the required environment variables:
docker run -d \
    -v /:/logtail_host:ro \
    -v /var/run/docker.sock:/var/run/docker.sock \
    --env ALIYUN_LOGTAIL_CONFIG=/etc/ilogtail/conf/${sls_upload_channel}/ilogtail_config.json \
    --env ALIYUN_LOGTAIL_USER_ID=${aliyun_account_id} \
    --env ALIYUN_LOGTAIL_USER_DEFINED_ID=${user_defined_id} \
aliyun-observability-release-registry.${region_id}.cr.aliyuncs.com/loongcollector/loongcollector:v3.0.12.0-25723a1-aliyunContainer restart policy: When you start the LoongCollector container, we recommend that you specify --restart=unless-stopped or --restart=always so that Docker automatically restarts the container after an unexpected exit or a Docker daemon restart. Otherwise, if the container is forcibly killed by an external operation or exits abnormally, it is not automatically recovered. The container loses its self-healing capability, and log collection stops silently.
Parameters:
-
${aliyun_account_id}: The ID of your Alibaba Cloud account. -
${user_defined_id}: The custom identifier of the machine group, which binds the container to the machine group, such asuser-defined-docker-1. The identifier must be unique within the region. -
${sls_upload_channel}: The log upload channel. The value consists of the region that hosts the project and the network transmission type, as described in the following table.
|
Transmission type |
Value format |
Example |
Scenario |
|
Internal network |
|
|
The ECS instance and the project are in the same region. |
|
Internet |
|
|
The ECS instance and the project are in different regions, or the server belongs to another cloud provider or a self-managed data center. |
|
Transfer acceleration |
|
|
Cross-region communication between Chinese mainland and other countries or regions. |
For the network characteristics behind each transmission type, see the Appendix: Network transmission types section of this topic.
Required startup conditions:
-
Correctly configure the three key environment variables:
ALIYUN_LOGTAIL_CONFIG,ALIYUN_LOGTAIL_USER_ID, andALIYUN_LOGTAIL_USER_DEFINED_ID. -
Mount
/var/run/docker.sockto listen for container lifecycle events. -
Mount
/to/logtail_hostto access the file system of the host machine.
3. Verify the container status
Run the following command:
docker ps | grep loongcollectorThe following output is returned:
6ad510001753 aliyun-observability-release-registry.cn-beijing.cr.aliyuncs.com/loongcollector/loongcollector:v3.0.12.0-25723a1-aliyun "/usr/local/ilogtail…" About a minute ago Up About a minute recursing_shirley4. Configure the machine group
In the left-side navigation pane, choose . Click  > Create Machine Group, configure the following parameters, and then click OK:
-
Name: Enter a custom name for the machine group, such as
docker-host-group. -
Machine Group Identifier: Select Custom Identifier.
-
Custom Identifier: Enter the
${user_defined_id}that you set when you started the container. The values must be identical. Otherwise, the association fails.
5. Verify the heartbeat of the machine group
Click the name of the new machine group to go to its details page, and check the Machine Group Status:
-
OK: LoongCollector is connected to Simple Log Service.
-
FAIL: See Summary of heartbeat issues to troubleshoot the issue.
Step 2: Create and configure a log collection rule
Define which logs LoongCollector collects, how it parses the log structure, and how it filters content, and then bind the configuration to a registered machine group.
-
On the
 LogStores page, click the
  icon next to the name of the destination LogStore to expand it.
 -
Click the
 icon next to Import Data. In the Quick Data Import dialog box, select a template based on your log source and click Integrate Now:
-
Docker standard output: Select Docker Stdout and Stderr - Old Version.
-
Docker file logs: Select Docker File - Container. 3. Configure the Machine Group Configurations and then click Next:
-
Scenario: Select Docker Containers.
-
Move the machine group that you created in Step 1 from the Source Machine Group list to the Applied Machine Group list on the right. 4. On the Logtail Configuration page, complete the settings described in the following sections and click Next.
-
1. Global and input configuration
Before you begin, make sure that you have selected a data import template and bound a machine group. This step defines the name of the collection configuration, the log source, and the collection scope.
Collect Docker standard output
Global Configurations
-
Configuration Name: Enter a custom name for the collection configuration. The name must be unique within the project and cannot be changed after creation. Naming conventions:
-
The name can contain only lowercase letters, digits, hyphens (-), and underscores (_).
-
The name must start and end with a lowercase letter or a digit.
-
Input configuration
-
Turn on the Stdout and Stderr switch or the Standard Error switch. Both are turned on by default. We recommend that you enable only standard output or only standard error to prevent out-of-order log collection.
Collect text logs from Docker containers
Global Configurations:
-
Configuration Name: Enter a custom name for the collection configuration. The name must be unique within the project and cannot be changed after creation. Naming conventions:
-
The name can contain only lowercase letters, digits, hyphens (-), and underscores (_).
-
The name must start and end with a lowercase letter or a digit.
Input Configurations:
-
-
File Path Type:
-
Path in Container: Collect log files inside the container.
-
Host Path: Collect local service logs on the host machine.
-
-
File Path: The absolute path for log collection.
-
Linux: The path starts with a forward slash (/), such as
/data/mylogs/**/*.log, which indicates all files with the .log extension in the/data/mylogsdirectory. -
Windows: The path starts with a drive letter, such as
C:\Program Files\Intel\**\*.Log.
-
-
Maximum Directory Monitoring Depth: The maximum directory depth matched by the
**wildcard in the File Path. Default value: 0, which indicates the current directory only. Valid values: 0 to 1000. We recommend that you set this parameter to 0 and configure the path down to the directory that contains the files.
2. Log processing and structuring (optional)
Collect Docker standard output
Standard output has a standard structure and usually requires no additional processing configuration. You can proceed directly to Step 3: Configure query and analysis.
In special cases, you can enable multiline mode and configure a first-line regex to merge consecutive lines of the same log into a complete log entry.
To transform the format of raw logs, you can also click Add Processor and configure processing plugins based on the actual format. Standard output supports only extended plugins, not native plugins.
Collect text logs from Docker containers
Configure log processing rules to convert raw unstructured logs into structured data and improve log query and analysis efficiency. We recommend that you add a log sample first:
On the Logtail Configuration page, in the Processor Configurations section, click Add Sample Log and enter the log content that you want to collect. Simple Log Service identifies the log format from the sample and helps generate regular expressions and parsing rules, which simplifies the configuration.
Scenario 1: Process multi-line logs, such as Java stack logs
Logs such as Java exception stacks and JSON usually span multiple lines. In the default collection mode, they are split into several incomplete entries and the context is lost. To prevent this, turn on multi-line mode and configure a first-line regular expression to merge consecutive lines of the same log into one complete entry.
Example:
|
Raw log |
Default collection mode: each line is a separate log, the stack is split, and the context is lost |
Multi-line mode: a first-line regular expression identifies the complete log and preserves the full semantic structure |
|
```log |
||
|
[2025-11-13T10:52:20,557] [ERROR] java.sql.SQLException: No suitable driver found for jdbc:mysql://db.host:3306/prod_db |
||
|
at com.datastore.util.DataProcessor.save(DataProcessor.java:434) |
||
|
at io.awesomeapp.util.PaymentGateway.fetchData(PaymentGateway.java:463) |
||
|
at org.awesomeapp.util.UserService.processRequest(UserService.java:252) |
||
|
at io.datastore.service.DatabaseConnector.fetchData(DatabaseConnector.java:172) |
||
|
at org.datastore.service.UserService.fetchData(UserService.java:517) |
||
|
``` |
|
|


Procedure: On the Logtail Configuration page, in the Processor Configurations section, turn on Multi-line Mode:
-
Type: Select Custom or Multi-line JSON.
-
Custom: The format of the raw logs is not fixed. Configure a Regex to Match First Line to identify the starting line of each log.
-
Regex to Match First Line: You can generate the expression automatically or enter it manually. The regular expression must match a complete line. In the preceding example, the expression is
\[\d+-\d+-\w+:\d+:\d+,\d+]\s\[\w+]\s.*.-
Automatic generation: Click Automatically Generate Regular Expression, select the log content that you want to extract in the Log Sample text box, and then click Generate Regular Expression.
-
Manual input: Click Manually Enter Regular Expression. After you enter the expression, click Validate.
-
-
-
Multi-line JSON: If all raw logs are in standard JSON format, Simple Log Service automatically handles the line breaks inside a single JSON log.
-
-
Processing Method If Splitting Fails:
-
Discard: If a text segment does not match the first-line rule, the segment is discarded.
-
Retain Single Line: Unmatched text is split and retained in the original single-line mode.
-
Scenario 2: Structure logs
When raw logs are unstructured or semi-structured text, such as NGINX access logs or application output logs, querying and analyzing them directly is inefficient. Simple Log Service provides multiple data parsing plugins that automatically convert raw logs in different formats into structured data, which provides a solid data foundation for subsequent analysis, monitoring, and alerting.
Example:
|
Raw log |
Log after structured parsing |
|
```plaintext |
|
|
192.168.. - - [15/Apr/2025:16:40:00 +0800] "GET /nginx-logo.png HTTP/1.1" 0.000 514 200 368 "-" "Mozilla/5.0 (Windows NT 10.0; Win64; x64) AppleWebKit/537.36 (KHTML, like Gecko) Chrome/131.0.. Safari/537.36" |
|
|
|
|
|
body_bytes_sent: 368 |
|
|
http_referer: - |
|
|
http_user_agent : Mozilla/5.0 (Windows NT 10.0; Win64; x64) AppleWebKit/537.36 (KHTML, like Gecko) Chrome/131.0.x.x Safari/537.36 |
|
|
remote_addr:192.168.. |
|
|
remote_user: - |
|
|
request_length: 514 |
|
|
request_method: GET |
|
|
request_time: 0.000 |
|
|
request_uri: /nginx-logo.png |
|
|
status: 200 |
|
|
time_local: 15/Apr/2025:16:40:00 |
|
|
``` |
Procedure: On the Logtail Configuration page, in the Processor Configurations section:
-
Add a parsing plugin: Click Add Processor and configure a plugin such as regular expression parsing, delimiter parsing, or JSON parsing based on the actual format. For the parameters of each plugin, see the Appendix: Native parsing plugins section of this topic. The following example collects NGINX logs, so select .
-
NGINX Log Configuration: Copy the complete
log_formatdefinition from the NGINX server configuration file (nginx.conf) and paste it into this text box. Example:log_format main '$remote_addr - $remote_user [$time_local] "$request" ''$request_time $request_length ''$status $body_bytes_sent "$http_referer" ''"$http_user_agent"';exactly the same as the format that generates the logs on the server. Otherwise, log parsing fails.
-
-
General configuration parameters: The following parameters appear in multiple data parsing plugins and have the same function and usage.
-
Source field: The name of the source field to parse. Default value:
content, which is the entire collected log content. -
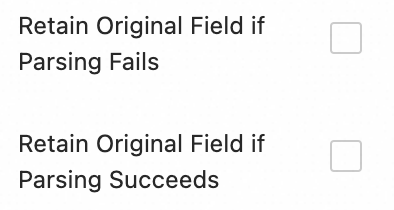
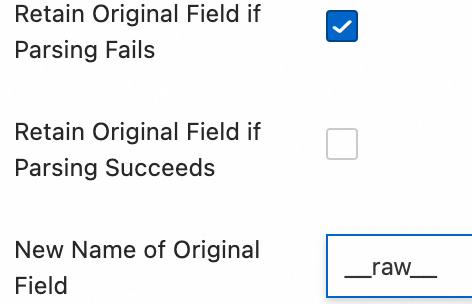
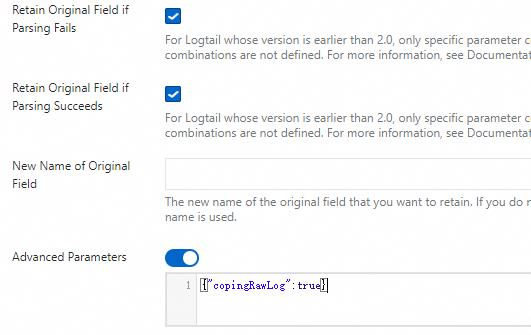
Keep source field on parse failure: We recommend that you turn on this option. If a plugin cannot parse a log, for example, because of a format mismatch, this option keeps the complete raw log content in the specified source field instead of dropping it.
-
Keep source field on parse success: If you select this option, the raw log content is retained even when the log is parsed successfully.
-
3. Log filtering (optional)
Collecting large volumes of low-value or irrelevant logs, such as DEBUG or INFO logs, wastes storage resources, increases costs, degrades query efficiency, and creates a data leak risk. Use fine-grained filtering policies for efficient and secure log collection.
Filtering is configured in two places in the console: content filtering is a processing plugin in the Processor Configurations section, whereas the collection blacklist and container filtering are switches in the Input Configurations section.
Reduce costs with content filtering
Filter by log content field, for example, collect only logs whose level is WARNING or ERROR.
Example:
|
Raw log |
Collect only |
|
```shell |
|
|
{"level":"WARNING","timestamp":"2025-09-23T19:11:40+0800","cluster":"yilu-cluster-0728","message":"Disk space is running low","freeSpace":"15%"} |
|
|
{"level":"ERROR","timestamp":"2025-09-23T19:11:42+0800","cluster":"yilu-cluster-0728","message":"Failed to connect to database","errorCode":5003} |
|
|
{"level":"INFO","timestamp":"2025-09-23T19:11:47+0800","cluster":"yilu-cluster-0728","message":"User logged in successfully","userId":"user-123"} |
|
|
|
|
|
{"level":"WARNING","timestamp":"2025-09-23T19:11:40+0800","cluster":"yilu-cluster-0728","message":"Disk space is running low","freeSpace":"15%"} |
|
|
{"level":"ERROR","timestamp":"2025-09-23T19:11:42+0800","cluster":"yilu-cluster-0728","message":"Failed to connect to database","errorCode":5003} |
|
|
``` |
Procedure: On the Logtail Configuration page, in the Processor Configurations section, click Add Processor and select :
-
Field Name: The log field to filter.
-
Field Value: The regular expression used for filtering. Only full-text matching is supported. Partial keyword matching is not supported.
Control the collection scope with a blacklist
Use a blacklist to exclude specified directories or files and prevent irrelevant or sensitive logs from being uploaded.
Procedure: On the Logtail Configuration page, in the section, turn on Collection Blacklist and click Add.
Directory and file names support exact matching and wildcard matching. The only supported wildcards are the asterisk (*) and the question mark (?).
-
File Path Blacklist: The file paths to ignore. Examples:
-
/home/admin/private*.log: Ignores all files in the/home/admin/directory that start with private and end with .log during collection. -
/home/admin/private*/*_inner.log: Ignores files that end with _inner.log in directories that start with private under the/home/admin/directory during collection.
-
-
File Blacklist: The file names to ignore during collection. Example:
-
app_inner.log: Ignores all files namedapp_inner.logduring collection.
-
-
Directory Blacklist: The directory path cannot end with a forward slash (/). Examples:
-
/home/admin/dir1/: The directory blacklist does not take effect. -
/home/admin/dir*: Ignores files in all subdirectories that start with dir under the/home/admin/directory during collection. -
/home/admin/*/dir: Ignores all files in second-level subdirectories named dir under the/home/admin/directory during collection. For example, files in the/home/admin/a/dirdirectory are ignored, and files in the/home/admin/a/b/dirdirectory are collected.
-
Container filtering
Set collection conditions based on container metadata, such as environment variables, Pod labels, namespaces, and container names, to precisely control which container logs are collected.
Procedure: On the Logtail Configuration page, in the Input Configurations section, turn on Container Filtering and click Add.
Multiple conditions are combined with a logical AND. All regular expression matching is based on the Go RE2 engine, which is more limited than engines such as PCRE. Write your regular expressions according to Appendix: Regular expression limitations (container filtering).
The following conditions apply to Docker containers:
-
Environment variable blacklist/whitelist: Specifies the environment variable conditions of the containers from which to collect logs.
-
Container label blacklist/whitelist: Collects logs from containers whose labels meet the conditions. Use this parameter in Docker scenarios. We do not recommend it in Kubernetes scenarios.
The following conditions apply to containers that are managed by Kubernetes:
-
Kubernetes Pod label blacklist/whitelist: Specifies the label conditions of the Pods that host the containers from which to collect logs.
-
Kubernetes Pod name regular expression matching: Specifies the containers from which to collect logs by Pod name.
-
Kubernetes namespace regular expression matching: Specifies the containers from which to collect logs by namespace name.
-
Kubernetes container name regular expression matching: Specifies the containers from which to collect logs by container name.
4. Log categorization (optional)
When multiple applications or instances share the same log format, log sources are hard to tell apart, which leaves queries without context and reduces analysis efficiency. To address this, configure topics and log tagging for automated context association and logical categorization.
Configure a topic
When multiple applications or instances produce logs in the same format but at different paths, such as /apps/app-A/run.log and /apps/app-B/run.log, the collected logs are hard to trace back to their source. In this case, generate a topic based on the machine group, a custom name, or file path extraction to flexibly distinguish logs from different applications or source paths.
Procedure:: Select how the topic is generated. The following three types are supported:
-
machine group topic: When a collection configuration is applied to multiple machine groups, LoongCollector automatically uploads the name of the machine group that the server belongs to as the
__topic__field. This type suits scenarios in which logs are divided by host cluster. -
Custom: The format is
customized://<custom_topic_name>, such ascustomized://app-login. This type suits static topic scenarios with a fixed application identifier. -
File path extraction: Extracts key information from the full path of the log file to dynamically mark the log source. This type suits scenarios in which multiple users or applications share the same log file name at different paths.
When multiple users or services write logs to different top-level directories but the lower-level paths and file names are identical, the file name alone cannot distinguish the source. For example:
/data/logs
├── userA
│   └── serviceA
│       └── service.log
├── userB
│   └── serviceA
│       └── service.log
└── userC
    └── serviceA
        └── service.log
In this case, configure File Path Extraction and use a regular expression to extract key information from the full path. The matched result is uploaded to the LogStore as the topic.
Extraction rules: capturing groups in the regular expression
When you configure the regular expression, Simple Log Service determines the output field format from the number and naming of the capturing groups, as described in the following table. In a regular expression for a file path, you must escape the forward slash (/).
|
Capturing group type |
Scenario |
Generated field |
Regular expression example |
Matched path example |
Generated field example |
|
Single capturing group (only one |
Only one dimension is needed to distinguish the source, such as user name or environment. |
Generates the |
|
|
|
|
Multiple unnamed capturing groups (multiple |
Multiple dimensions are needed, but semantic labels are not. |
Generates the tag field |
|
|
|
|
Multiple named capturing groups (using |
Multiple dimensions are needed, and field names must be self-explanatory for easier querying and analysis. |
Generates the tag field |
|
|
|
Log tagging
Turn on log tag enrichment to extract key information from container environment variables or Kubernetes Pod labels and attach it as tags for fine-grained log grouping.
Procedure: On the Logtail Configuration page, in the Input Configurations section, turn on Log Tag Enrichment and click Add.
-
Environment Variables: Configure an environment variable name and a tag name. The value of the environment variable is stored under the tag name.
-
Environment variable name: The name of the environment variable to extract.
-
Tag name: The name of the environment variable tag.
-
-
Pod Labels: Configure a Pod label name and a tag name. The value of the Pod label is stored under the tag name.
-
Pod label name: The name of the Kubernetes Pod label to extract.
-
Tag name: The name of the tag.
-
5. Output configuration
By default, all logs are sent to the current LogStore with lz4 compression. To distribute logs from the same source to different LogStores, perform the following steps.
Dynamic distribution to multiple targets
-
Sending to multiple targets requires LoongCollector 3.0.0 or later. Logtail does not support this feature.
-
You can configure a maximum of five output targets.
-
After you configure multiple output targets, the collection configuration no longer appears in the collection configuration list of the current LogStore. To view, modify, or delete a multi-target distribution configuration, see How do I manage multi-target distribution configurations?.
Procedure: On the Logtail Configuration page, in the Output Configurations section:
-
Click
 to expand the output configuration.
 -
Click Add Output Targets and complete the following settings:
-
Logstores: Select the destination LogStore.
-
Compression Method: lz4 and zstd are supported.
-
Route Settings: Routes and distributes logs based on their tag fields. Logs that meet the routing configuration are uploaded to the destination LogStore. If the routing configuration is empty, all collected logs are uploaded to the destination LogStore.
-
Tag Name: The name of the tag field used for routing. Enter the field name directly, such as
__path__, without the__tag__:prefix. Tag fields fall into the following two categories:-
Agent-related: Related to the collection agent itself and independent of plugins, such as
__hostname__and__user_defined_id__. -
Input plugin-related: Provided by an input plugin, which enriches the logs with the related information, such as
__path__for file collection and_pod_name_and_container_name_for Kubernetes collection.For more information about tags, see Manage collection tags.
-
-
Tag Value: Logs whose tag field value matches this value are sent to the destination LogStore.
-
Discard this tag?: If you turn on this switch, the uploaded logs do not contain this tag field.
-
-
 to expand the output configuration.
Step 3: Configure query and analysis
After you finish the log processing and plugin configuration, click Next to go to the Query and Analysis Configurations page:
-
A full-text index is enabled by default and supports keyword searches on the raw log content.
-
To run precise queries by field, wait until Preview Data loads on the page and then click Automatic Index Generation. Simple Log Service generates a field index based on the first entry in the preview data.
After you finish the configuration, click Next to complete the entire collection setup.
Step 4: Validation and troubleshooting
After you finish the collection configuration and apply it to a machine group, Simple Log Service automatically distributes the configuration and starts collecting incremental logs.
View uploaded logs
-
Confirm that the log file has new content: LoongCollector collects only incremental logs. Run
tail -f /path/to/your/log/fileand trigger an application operation to make sure that new logs are being written. -
Query logs: Go to the query and analysis page of the destination LogStore and click Search & Analyze. The default time range is the last 15 minutes. Check whether new logs are arriving. By default, each collected Docker container text log contains the following fields:
|
Field |
Description |
|
|
The IP address of the LoongCollector (Logtail) container. |
|
|
The IP address of the application container. |
|
|
The name of the Docker host machine that runs LoongCollector (Logtail). |
|
|
The log collection path. |
|
|
The time when the log arrived on the server-side. |
|
|
The custom identifier of the machine group. |
Troubleshoot common issues
The heartbeat of the machine group is FAIL
Check the user identifier
If your server is not an ECS instance, or if the ECS instance and the project belong to different Alibaba Cloud accounts, use the following methods to check whether the correct user identifier exists in the specified directory:
-
Linux: Run the
cd /etc/ilogtail/users/ && touch <uid>command to create the user identifier file. -
Windows: Go to the
C:\LogtailData\users\directory and create an empty file named<uid>.If a file named after the Alibaba Cloud account ID that owns the current project exists in the specified path, the user identifier is configured correctly.
Check the machine group identifier
If you use a custom identifier-based machine group, check whether the user_defined_id file exists in the specified directory. If it exists, check whether its content is the same as the custom identifier configured for the machine group.
|
System |
Specified directory |
Solution |
|
Linux |
|
```shell |
Configure the custom identifier. If the directory does not exist, create it manually.
echo "user-defined-1" > /etc/ilogtail/user_defined_id `` |
| Windows |C:\LogtailData\user_defined_id| In theC:\LogtailDatadirectory, create auser_defined_id` file and write the custom identifier to it. If the directory does not exist, create it manually. |
If both the user identifier and the machine group identifier are configured correctly, see Troubleshoot LoongCollector (Logtail) machine group issues for further troubleshooting.
No log data is collected
-
Check for incremental logs: After you configure LoongCollector (Logtail) collection, LoongCollector (Logtail) does not collect a log file if no new logs are written to it.
-
Check the heartbeat status of the machine group: Go to the Resource Group > Machine Groups page, click the name of the destination machine group, and check the Heartbeat status in the Machine Group Configurations > Machine Group Status section.
-
If the heartbeat is OK, the machine group is connected to the Simple Log Service project.
-
If the heartbeat is FAIL, see The heartbeat of the machine group is FAIL to troubleshoot the issue.
-
Confirm that the LoongCollector (Logtail) collection configuration is applied to the machine group: Even if the LoongCollector (Logtail) collection configuration is created, logs are not collected until you apply the configuration to a machine group.
-
Go to the Resource Group > Machine Groups page and click the name of the destination machine group to go to the Machine Group Configurations page.
-
On the page, check Manage Configuration. The All Logtail Configurations list appears on the left and the Applied Logtail Configs list appears on the right. If the destination LoongCollector (Logtail) collection configuration has been moved to the applied area on the right, the configuration is applied to the destination machine group.
-
If the destination LoongCollector (Logtail) collection configuration has not been moved to the applied area on the right, click Modify, select the name of the destination LoongCollector (Logtail) configuration in the All Logtail Configurations list on the left, click
to move it to the applied area on the right, and then click OK.
 to move it to the applied area on the right, and then click OK.
Log collection errors or format errors
Troubleshooting approach: This situation indicates that the network connection and the basic configuration are working, and that the problem lies in a mismatch between the log content and the parsing rules. Check the specific error message to locate the problem:
-
On the Logtail Configuration page, click the name of the LoongCollector (Logtail) configuration that reports collection errors. On the Log Collection Error tab, click Select Time Range to set the query time.
-
In the Collection Exception Monitoring > Complete Error Information section, check the alert type of the error log and find the corresponding solution in Common error types in data collection.
Common commands
View the running status of LoongCollector (Logtail)
Run the following command:
docker exec ${logtail_container_id} /etc/init.d/ilogtaild statusView the version, IP address, start time, and other information of LoongCollector (Logtail)
Run the following command:
docker exec ${logtail_container_id} cat /usr/local/ilogtail/app_info.jsonView the operational logs of LoongCollector (Logtail)
The operational logs of LoongCollector (Logtail) are stored in the /usr/local/ilogtail/ directory inside the container. The file name is ilogtail.LOG, and rotated files are compressed and stored as ilogtail.LOG.x.gz. Example:
# View the operational logs of LoongCollector

docker exec a287de895e40 tail -n 5 /usr/local/ilogtail/loongcollector.LOG

# View the operational logs of Logtail

docker exec a287de895e40 tail -n 5 /usr/local/ilogtail/ilogtail.LOG
The following output is returned:
[2025-08-25 09:17:44.610496]    [info]  [22]    /build/loongcollector/file_server/polling/PollingModify.cpp:75          polling modify resume:succeeded
[2025-08-25 09:17:44.610497]    [info]  [22]    /build/loongcollector/file_server/polling/PollingDirFile.cpp:100                polling discovery resume:starts
[2025-08-25 09:17:44.610498]    [info]  [22]    /build/loongcollector/file_server/polling/PollingDirFile.cpp:103                polling discovery resume:succeeded
[2025-08-25 09:17:44.610499]    [info]  [22]    /build/loongcollector/file_server/FileServer.cpp:117            file server resume:succeeded
[2025-08-25 09:17:44.610500]    [info]  [22]    /build/loongcollector/file_server/EventDispatcher.cpp:1019              checkpoint dump:succeeded
Restart LoongCollector (Logtail)
Run the following commands:
# Stop LoongCollector

docker exec a287de895e40 /etc/init.d/ilogtaild stop

# Start LoongCollector

docker exec a287de895e40 /etc/init.d/ilogtaild start
FAQ
Common error messages
|
Symptom |
Cause |
Solution |
|
|
The region of the project does not match the region of the LoongCollector (Logtail) container. |
Check the region configuration in |
|
|
The file path is misconfigured. |
Confirm that the log path in the application container matches the collection configuration. |
Error log: The parameter is invalid : uuid=none
Problem description: The LoongCollector (Logtail) log file (/usr/local/ilogtail/ilogtail.LOG) contains the error log The parameter is invalid : uuid=none.
Solution: On the host machine, create a product_uuid file, enter any valid UUID in it, such as 169E98C9-ABC0-4A92-B1D2-AA6239C0D261, and mount the file to the /sys/class/dmi/id/product_uuid directory in the LoongCollector (Logtail) container.
How do I collect the same log file or container standard output with multiple collection configurations?
By default, to prevent duplicate data, Simple Log Service allows each log source to be collected by only one collection configuration:
-
A text log file can be matched by only one Logtail collection configuration.
-
Container standard output (stdout):
-
If you use the old standard output template, collection by multiple configurations is supported by default and requires no extra configuration.
To allow the same log source to be collected by multiple collection configurations, perform the following steps:
-
Log on to the Simple Log Service console and go to the destination project.
-
In the left-side navigation pane, choose
LogStores and find the destination LogStore. -
Click the
icon next to its name to expand the LogStore. -
Click Logtail Configuration, find the destination Logtail configuration in the configuration list, and click Manage Logtail Configuration in the Actions column.
-
On the Logtail configuration page, click Edit and scroll down to the Input Configurations section: - To collect text file logs: Turn on Allow File to Be Collected for Multiple Times. - To collect container standard output: Turn on Allow Collection by Different Logtail Configurations.
How do I manage multi-target distribution configurations?
Because a multi-target distribution configuration is associated with multiple LogStores, you must maintain this type of configuration on the project-level management page:
-
Log on to the Simple Log Service console and click the name of the destination project.
-
On the destination project page, in the left-side navigation pane, click
Resource Group > Configurations.This page centrally manages all collection configurations in the project, including configurations left behind after a LogStore was deleted by mistake.
 Resource Group > Configurations.
Appendix: Native parsing plugins
On the Logtail Configuration page, in the Processor Configurations section, you can add processing plugins to structure raw logs. To add a processing plugin to an existing collection configuration, perform the following steps:
-
In the left-side navigation pane, choose
LogStores and find the destination LogStore. -
Click the
icon next to its name to expand the LogStore. -
Click Logtail Configuration, find the destination Logtail configuration in the configuration list, and click Manage Logtail Configuration in the Actions column.
-
On the Logtail configuration page, click Edit.
This section describes only the common processing plugins, which cover typical log processing scenarios. For more features, see Extended processing plugins.
 LogStores and find the destination LogStore.
 icon next to its name to expand the LogStore.
Rules for combining plugins (applies to LoongCollector / Logtail 2.0 and later):
-
You can use native processing plugins and extended processing plugins independently or combine them as needed.
-
We recommend that you use native processing plugins first, because they deliver better performance and higher stability.
-
If the native features cannot meet your business needs, add extended processing plugins after the configured native processing plugins for supplementary processing.
Order constraint:
All plugins form a processing chain in the order in which they are configured and run in that order. Note: All native processing plugins must precede any extended processing plugin. After you add an extended processing plugin, you cannot add any more native processing plugins.
Regular expression parsing
Extracts log fields with a regular expression and parses the log into key-value pairs so that each field can be queried and analyzed independently.
Example:
|
Raw log |
Result of the regular expression parsing plugin |
|
```plaintext |
|
|
127.0.0.1 - - [16/Aug/2024:14:37:52 +0800] "GET /wp-admin/admin-ajax.php?action=rest-nonce HTTP/1.1" 200 41 "http://www.example.com/wp-admin/post-new.php?post_type=page" "Mozilla/5.0 (Windows NT 10.0; Win64; x64) AppleWebKit/537.36 (KHTML, like Gecko) Chrome/127.0.0.0 Safari/537.36 Edg/127.0.0.0" |
|
|
|
|
|
body_bytes_sent: 41 |
|
|
http_referer: http://www.example.com/wp-admin/post-new.php?post_type=page |
|
|
http_user_agent: Mozilla/5.0 (Windows NT 10.0; Win64; x64) AppleWebKit/537.36 (KHTML, like Gecko) Chrome/127.0.0.0 Safari/537.36 Edg/127.0.0.0 |
|
|
remote_addr: 127.0.0.1 |
|
|
remote_user: - |
|
|
request_method: GET |
|
|
request_protocol: HTTP/1.1 |
|
|
request_uri: /wp-admin/admin-ajax.php?action=rest-nonce |
|
|
status: 200 |
|
|
time_local: 16/Aug/2024:14:37:52 +0800 |
|
|
``` |
Procedure: On the Logtail Configuration page, in the Processor Configurations section, click Add Processor and select Native Processor > Data Parsing (Regex Mode):
-
Regular Expression: The expression used to match logs. You can generate it automatically or enter it manually:
-
Automatic generation:
-
Click Automatically Generate Regular Expression.
-
In the Log Sample section, highlight the log content that you want to extract.
-
Click Generate Regular Expression.
Confirm that log content in the correct format is pasted in the Log Sample section, such as an Apache Combined access log, and then click Generate Regular Expression in that section to automatically generate the parsing expression. - Manual input: Manually enter a regular expression based on the log format.
After you finish the configuration, click Validate to test whether the regular expression parses the log content correctly. - Extracted Field: Set a field name (Key) for each piece of extracted log content (Value). - For information about the other parameters, see the general configuration parameters described in Scenario 2: Structure logs.
-
Delimiter parsing
Structures log content with a delimiter and parses it into multiple key-value pairs. Single-character and multi-character delimiters are supported.
Example:
|
Raw log |
Fields split by the specified |
|
```plaintext |
|
|
05/May/2025:13:30:28,10.10..,"POST /PutData?Category=YunOsAccountOpLog&AccessKeyId=**&Date=Fri%2C%2028%20Jun%202013%2006%3A53%3A30%20GMT&Topic=raw&Signature=****** HTTP/1.1",200,18204,aliyun-sdk-java |
|
|
|
|
|
ip:10.10.. |
|
|
request:POST /PutData?Category=YunOsAccountOpLog&AccessKeyId=**&Date=Fri%2C%2028%20Jun%202013%2006%3A53%3A30%20GMT&Topic=raw&Signature=****** HTTP/1.1 |
|
|
size:18204 |
|
|
status:200 |
|
|
time:05/May/2025:13:30:28 |
|
|
user_agent:aliyun-sdk-java |
|
|
``` |
Procedure: On the Logtail Configuration page, in the Processor Configurations section, click Add Processor and select Native Processor > Data Parsing (Delimiter Mode):
-
Delimiter: Specify the character used to split the log content. Example: For a CSV file, select Custom and enter a comma (,).
-
Quote: If a field value contains the delimiter, specify a quote character to enclose the field and prevent incorrect splitting.
-
Extracted Field: Set a field name (Key) for each column in the order in which the columns are split. The following rules apply:
-
A field name can contain only letters, digits, and underscores (_).
-
A field name must start with a letter or an underscore (_).
-
Maximum length: 128 bytes.
-
For information about the other parameters, see the general configuration parameters described in Scenario 2: Structure logs.
Standard JSON parsing
Structures an Object-type JSON log and parses it into key-value pairs.
Example:
|
Raw log |
Automatic extraction of standard JSON key-value pairs |
|
```json |
|
|
{"url": "POST /PutData?Category=YunOsAccountOpLog&AccessKeyId=U0Ujpek**&Date=Fri%2C%2028%20Jun%202013%2006%3A53%3A30%20GMT&Topic=raw&Signature=pD12XYLmGxKQ%2Bmkd6x7hAgQ7b1c%3D HTTP/1.1", "ip": "10.200.98.220", "user-agent": "aliyun-sdk-java", "request": {"status": "200", "latency": "18204"}, "time": "05/Jan/2025:13:30:28"} |
|
|
|
|
|
ip: 10.200.98.220 |
|
|
request: {"status": "200", "latency" : "18204" } |
|
|
time: 05/Jan/2025:13:30:28 |
|
|
url: POST /PutData?Category=YunOsAccountOpLog&AccessKeyId=U0Ujpek**&Date=Fri%2C%2028%20Jun%202013%2006%3A53%3A30%20GMT&Topic=raw&Signature=pD12XYLmGxKQ%2Bmkd6x7hAgQ7b1c%3D HTTP/1.1 |
|
|
user-agent:aliyun-sdk-java |
|
|
``` |
Procedure: On the Logtail Configuration page, in the Processor Configurations section, click Add Processor and select Native Processor > Data Parsing (JSON Mode):
-
Original Field: Default value: content. This field stores the raw log content to be parsed.
-
For information about the other parameters, see the general configuration parameters described in Scenario 2: Structure logs.
Nested JSON parsing
Parses a nested JSON log into key-value pairs by specifying an expansion depth.
Example:
|
Raw log |
Expansion depth: 0, with the expansion depth as the prefix |
Expansion depth: 1, with the expansion depth as the prefix |
|
```json |
||
|
{"s_key":{"k1":{"k2":{"k3":{"k4":{"k51":"51","k52":"52"},"k41":"41"}}}}} |
||
|
|
||
|
0_s_key_k1_k2_k3_k41:41 |
||
|
0_s_key_k1_k2_k3_k4_k51:51 |
||
|
0_s_key_k1_k2_k3_k4_k52:52 |
||
|
|
||
|
1_s_key:{"k1":{"k2":{"k3":{"k4":{"k51":"51","k52":"52"},"k41":"41"}}}} |
||
|
``` |
Procedure: On the Logtail Configuration page, in the Processor Configurations section, click Add Processor and select :
-
Original Field: The name of the original field to expand, such as
content. -
JSON Expansion Depth: The expansion level of the JSON object. A value of 0 indicates full expansion (default value), a value of 1 indicates the current level, and so on.
-
Character to Concatenate Expanded Keys: The character used to concatenate field names during JSON expansion. Default value: underscore (_).
-
Name Prefix of Expanded Keys: The prefix of the field names after JSON expansion.
-
Expand Array: Turn on this option to expand an array into key-value pairs with indexes. Example:
{"k":["a","b"]}is expanded to{"k[0]":"a","k[1]":"b"}.To rename an expanded field, for example, to change prefix_s_key_k1 to new_field_name, add a Rename Fields plugin afterwards to complete the mapping.
-
For information about the other parameters, see the general configuration parameters described in Scenario 2: Structure logs.
JSON array parsing
Use the json_extractfunction to extract JSON objects from a JSON array.
Example:
|
Raw log |
Extracted JSON array structure |
|
```json |
|
|
[{"key1":"value1"},{"key2":"value2"}] |
|
|
|
|
|
json1:{"key1":"value1"} |
|
|
json2:{"key2":"value2"} |
|
|
``` |
Procedure: On the Logtail Configuration page, in the Processor Configurations section, switch Processing Method to SPL, configure the SPL statement, and use the json_extract function to extract JSON objects from the JSON array.
Example: Extract the elements of the JSON array from the content log field and store the results in the new json1 and json2 fields.
* | extend json1 = json_extract(content, '$[0]'), json2 = json_extract(content, '$[1]')Apache log parsing
Structures log content based on the definitions in the Apache log configuration file and parses it into multiple key-value pairs.
Example:
|
Raw log |
Parsing with the Apache Common Log Format |
|
```plaintext |
|
|
1 192.168.1.10 - - [08/May/2024:15:30:28 +0800] "GET /index.html HTTP/1.1" 200 1234 "https://www.example.com/referrer" "Mozilla/5.0 (Windows NT 10.0; Win64; x64) AppleWebKit/537.36 (KHTML, like Gecko) Chrome/123.0.X.X Safari/537.36" |
|
|
|
|
|
http_referer:https://www.example.com/referrer |
|
|
http_user_agent:Mozilla/5.0 (Windows NT 10.0; Win64; x64) AppleWebKit/537.36 (KHTML, like Gecko) Chrome/123.0.X.X Safari/537.36 |
|
|
remote_addr:192.168.1.10 |
|
|
remote_ident:- |
|
|
remote_user:- |
|
|
request_method:GET |
|
|
request_protocol:HTTP/1.1 |
|
|
request_uri:/index.html |
|
|
response_size_bytes:1234 |
|
|
status:200 |
|
|
time_local:[08/May/2024:15:30:28 +0800] |
|
|
``` |
Procedure: On the Logtail Configuration page, in the Processor Configurations section, click Add Processor and select :
-
Log Format: combined
-
APACHE LogFormat Configuration: Simple Log Service automatically populates this setting based on Log Format. Check the automatically populated content to make sure that it is identical to the LogFormat defined in the Apache configuration file on your server, which is usually located at /etc/apache2/apache2.conf.
-
For information about the other parameters, see the general configuration parameters described in Scenario 2: Structure logs.
Data masking
Masks sensitive data in logs.
Example:
|
Raw log |
Masking result |
|
```plaintext |
|
|
[{'account':'1812213231432969','password':'04a23f38'}, {'account':'1812213685634','password':'123a'}] |
|
|
|
|
|
[{'account':'1812213231432969','password':'*'}, {'account':'1812213685634','password':'*'}] |
|
|
``` |
Procedure: On the Logtail Configuration page, in the Processor Configurations section, click Add Processor and select :
-
Original Field: The original field that stores the log content before parsing.
-
Data Masking Method:
-
const: Replaces the sensitive content with the specified string.
-
md5: Replaces the sensitive content with its MD5 value.
-
-
Replacement String: If you set Data Masking Method to const, enter the string used to replace the sensitive content.
-
Content Expression that Precedes Replaced Content: Locates the sensitive content. Configure it with the RE2 syntax.
-
Content Expression to Match Replaced Content: The expression of the sensitive content. Configure it with the RE2 syntax.
Time parsing
Parses the time field in the log and sets the parsing result as the __time__ field of the log.
Example:
|
Raw log |
Time parsing |
|
```shell |
|
|
{"level":"INFO","timestamp":"2025-09-23T19:11:47+0800","cluster":"yilu-cluster-0728","message":"User logged in successfully","userId":"user-123"} |
|
|
``` |
Parses the time value of the |
Procedure: On the Logtail Configuration page, in the Processor Configurations section, click Add Processor and select Native Processor > Time Parsing:
-
Original Field: The original field that stores the log content before parsing.
-
Time Format: Set the matching time format based on the time content in the log.
-
Time Zone: Select the time zone of the time field in the log. The machine time zone is used by default, which is the time zone of the environment that hosts the LoongCollector (Logtail) process.
Appendix: Regular expression limitations (container filtering)
The regular expressions used for container filtering are based on the Go RE2 engine, which has some syntax limitations compared with other engines such as PCRE. Note the following items when you write regular expressions:
-
Differences in named group syntax
Go uses the
(?P<name>...)syntax to define a named group and does not support the(?<name>...)syntax of PCRE.
-
Correct example:
(?P<year>\d{4}) -
Incorrect example:
(?<year>\d{4})2. Unsupported regular expression featuresThe following common but complex regular expression features are unavailable in RE2. Do not use them:
-
Lookarounds:
(?=...),(?!...),(?<=...),(?<!...) -
Conditionals:
(?(condition)true|false) -
Recursion:
(?R),(?0) -
Subroutine references:
(?&name),(?P>name) -
Atomic groups:
(?>...)3. RecommendationsWhen you debug regular expressions with a tool such as Regex101, select the Golang (RE2) mode to validate them and ensure compatibility. If you use any of the unsupported syntax, the plugin cannot parse or match your expression correctly.
More information
Global parameters
Input parameters
Processor parameters
|
Parameter |
Description |
|
Log sample |
A sample of the log you want to collect. Use a log sample from your actual use case. The sample helps you configure processing parameters more easily. You can add multiple samples. The total length cannot exceed 1,500 characters. |
|
Multi-line mode |
|
|
Processing mode |
Processors, which includes the Native Processor and the Extended Processor. For more information about processors, see Use native and extended processors. Important
For processor usage limitations, refer to the console prompts.
|
Regions
-
Log on to the Simple Log Service console. In the project list, click the destination project.
-
Click the
icon next to the project name to go to the project overview page. -
In the Basic Information section, view the region name of the current project. The following table maps region names to their corresponding Region IDs.
A region is the geographical location of the physical data center for a cloud service. A Region ID is its unique identifier.
Region name
Region ID
China (Qingdao)
cn-qingdao
China (Beijing)
cn-beijing
China (Zhangjiakou)
cn-zhangjiakou
China (Hohhot)
cn-huhehaote
China (Ulanqab)
cn-wulanchabu
China (Hangzhou)
cn-hangzhou
China (Shanghai)
cn-shanghai
China (Nanjing - Local Region - Decommissioning)
cn-nanjing
China (Fuzhou - Local Region - Decommissioning)
cn-fuzhou
China (Shenzhen)
cn-shenzhen
China (Heyuan)
cn-heyuan
China (Guangzhou)
cn-guangzhou
Philippines (Manila)
ap-southeast-6
South Korea (Seoul)
ap-northeast-2
Malaysia (Kuala Lumpur)
ap-southeast-3
Japan (Tokyo)
ap-northeast-1
Thailand (Bangkok)
ap-southeast-7
China (Chengdu)
cn-chengdu
Singapore
ap-southeast-1
Indonesia (Jakarta)
ap-southeast-5
China (Hong Kong)
cn-hongkong
Germany (Frankfurt)
eu-central-1
US (Virginia)
us-east-1
US (Silicon Valley)
us-west-1
UK (London)
eu-west-1
UAE (Dubai)
me-east-1
SAU (Riyadh)
me-central-1
 icon next to the project name to go to the project overview page.
|
Network type |
Domain name type |
Description |
Scenario |
|
Alibaba Cloud internal network |
Private domain name |
The Alibaba Cloud internal network is a gigabit shared network. Transferring log data over the Alibaba Cloud internal network is faster and more stable than transferring it over the Internet. The internal network includes VPCs and the classic network. |
The ECS instance and the Simple Log Service project are in the same region, or the server is connected to a VPC through Express Connect. We recommend that you create the Simple Log Service project in the region that hosts the ECS instance and collect logs from the ECS instance over the Alibaba Cloud internal network, which consumes no Internet bandwidth. |
|
Internet |
Public domain name |
Transferring log data over the Internet is limited by network bandwidth. Network jitter, latency, and packet loss can also affect the speed and stability of data collection. |
You can transfer data over the Internet in the following two cases: the ECS instance and the Simple Log Service project are in different regions, or the server belongs to another cloud provider or a self-managed data center. |
|
Transfer acceleration |
Transfer acceleration domain name |
This method accelerates log collection with Alibaba Cloud CDN edge nodes. It offers significant advantages over Internet-based collection in network latency and stability, but the traffic is billed separately. |
If your application server and Simple Log Service project are in a Chinese mainland region and a region outside the Chinese mainland respectively, transferring data over the Internet may cause high network latency and unstable transmission. In this case, you can use transfer acceleration. For more information, see Transfer acceleration. |
Next steps
-
Data visualization: Monitor the trends of key metrics on visualization dashboards.
-
Automatic alerting for data anomalies: Configure an alert policy to detect system anomalies in real time.