Log Service can automatically and intelligently predict time series data, helping you understand future trends and proactively monitor key system or business metrics.
Prerequisites
-
Data is stored in a LogStore or MetricStore. For more information, see Data collection overview.
-
If data is stored in a LogStore, you must configure an index for it. For more information, see Create an index.
-
You have created an Intelligent Anomaly Analysis instance. For more information, see Create an instance.
Procedure
Log on to the Simple Log Service console.
-
Navigate to the job creation page.
-
In the Log Application section, click Intelligent Anomaly Analysis.
-
In the instance list, click the target instance.
-
In the left navigation pane, click Time Series Forecasting.
-
In the Time series prediction task section, click Create Now.
-
-
In the Basic information step of the Basic Information wizard, configure the following parameters and click Next.
Parameter
Description
Task Name
Enter a name for the time series forecasting job.
Project
Select the Project that contains the source LogStore or MetricStore.
Region
Displays the region of the selected Project.
Logstore Type
Select the store type based on where your data is stored.
-
If your data is stored in a LogStore, select Logstore.
-
If your data is stored in a MetricStore, select Metricstores.
Source Logstore
If you set Logstore Type to Logstore, specify the source Source Logstore that contains your data.
Metricstores
If you set Logstore Type to Metricstores, specify the source Metricstores that contains your data.
Role
If you granted the required permissions during instance creation, the ARN of the AliyunLogETLRole role is automatically displayed.
Target Store
The destination LogStore, fixed to internal-ml-log.
-
-
In the Data Feature Settings step of the Create Time Series Forecasting Job configuration wizard, enter query and analysis statements, and then complete the following configurations.
The following example obtains time series data by using
queryandanalysisstatements. For more information, see Query overview and Query and analysis overview.* | select (__time__ - __time__%60) as time, 'entity' as entity, count(1) as metric from log group by time, entity order by timeParameter
Description
Time
The field in your source data that represents the timestamp. Aggregate your data at a granularity of one minute or more.
Entity
The field that identifies a time series entity. After you specify this field, a list of available entities appears.
The job predicts the time series for selected entities. If you do not select any entity, the job predicts the time series for all entities.
Feature
The field in your source data that identifies a specific feature. The time series forecasting job predicts each feature for each entity. If the number of entities is m and the number of features is n, the job forecasts m × n time series.
Each job can predict a maximum of 5 time series. If this limit is exceeded, the job randomly selects 5 time series to predict.
-
In the Algorithm Configurations step of the Create Time Series Forecasting Job configuration wizard, complete the following configurations, and then click Complete.
Parameter
Description
Time series prediction period
Period configuration
The period of the time series, measured in days. Use decimals for periods shorter than a day, such as 2.4 days.
Time series forecasting jobs by default consider the impact of Day, Week, and Year periodicities on the trend. You do not need to configure these periodicities.
Holiday configuration
Country
Select the country where your data originates. The job considers that country's national holidays in its predictions.
Other holidays
Specify any other holidays or event dates that may affect the time series trend.
Include holidays from both the historical training data and the future prediction period.
Prediction configuration
Length of series to predict
The length of the future time series you want to predict.
The time unit affects the number of data points in the forecast. For example, to forecast time series data for the next 2 hours, if you set Forecast Length to 2 hours, the forecast contains only 2 data points, which is one data point per hour. If you set Forecast Length to 120 minutes, the forecast contains 120 data points, which is one data point per minute.
Confidence Level
The confidence level for the prediction, from 0.5 to 0.99. A higher value widens the range between the upper and lower bounds, increasing the probability that actual values fall within them.
Number of samples
The number of samples to use, from 0 to 100. A higher value improves the accuracy of the predicted upper and lower bounds.
Prediction frequency
How often the job runs to generate a new prediction.
Observation period
The duration of historical time series data to use for each prediction run.
Scheduling Settings
Time Range
The start time for the time series forecasting job.
-
Preview the algorithm's performance with the current parameter settings in the preview area.
-
Set a time range and click Data Query. The system uses the query from the Data Feature Settings step to generate a time series from the data in this range.
-
Select an entity and click Preview to run the prediction on its time series. The results appear in the chart below. Click Show Parameters to view the current algorithm configuration.
-
The prediction results include upper and lower bounds based on historical data. Data points outside these bounds are potential anomalies. You can adjust the anomaly threshold to display anomalies with a score greater than the threshold.
-
Prediction results
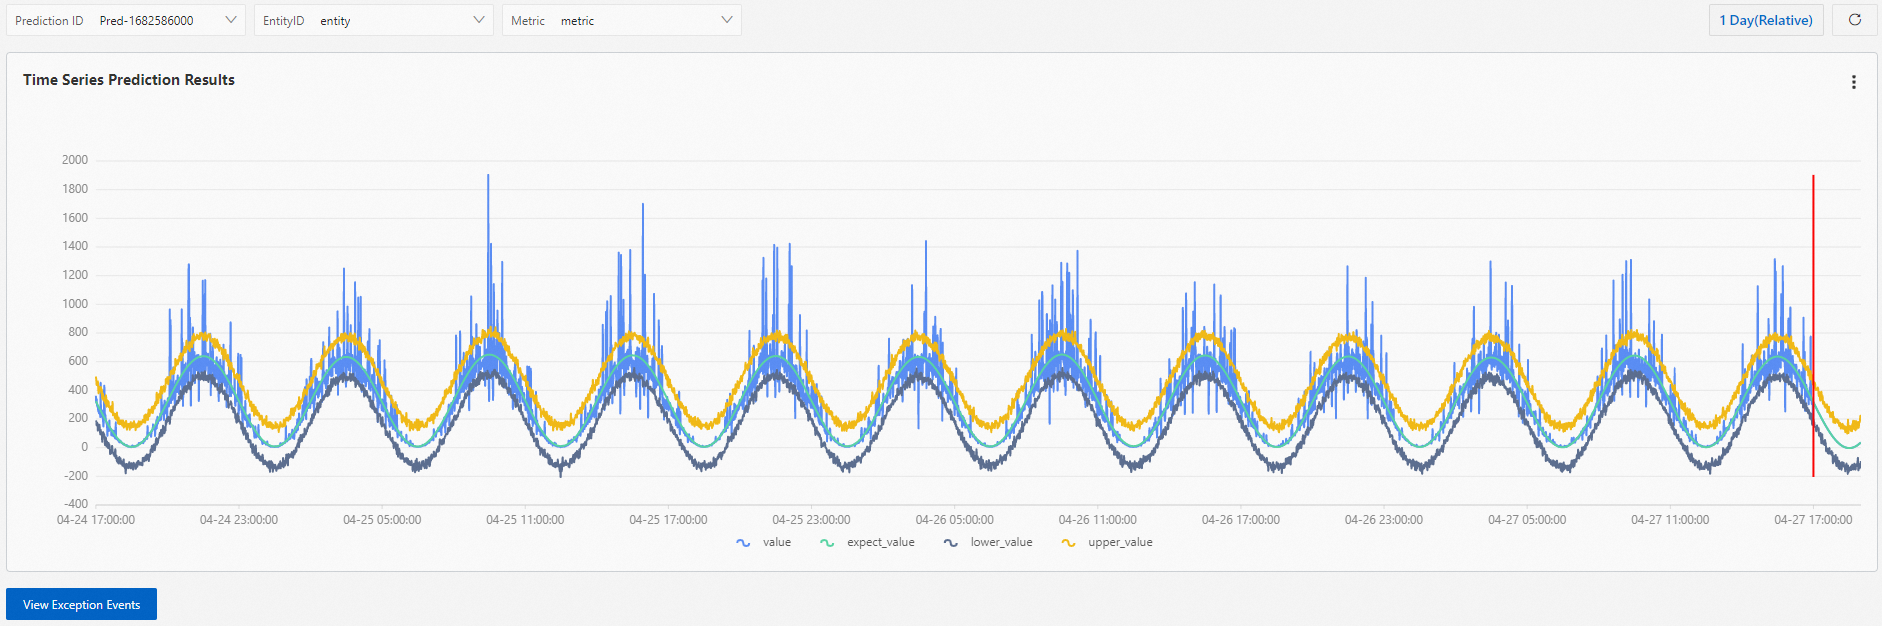
After creating a time series forecasting job, find it in the job list. Click a job to view its details. Filter the results by Prediction ID, Entity ID, metric, and time.
|
Parameter |
Description |
|
Time |
Select a different time range to view the prediction results for that period. |
|
Prediction ID |
Because the job runs continuously, each forecast run is assigned a unique Prediction ID. The ID is in the format |
|
Entity ID |
Select an Entity ID to view the time series for that specific entity. |
|
Metric |
Select a metric to view the time series for that specific metric. |
In the chart, the curve to the left of the vertical red line is the historical data, and the curve to the right is the predicted data.
Click View Anomaly Events to see errors from the forecasting process.
Related operations
After you create a job, manage, modify, or delete it from the Time Series Forecasting page.
A deleted time series forecasting job cannot be recovered. Proceed with caution.