The Network Quality Analyzer application provides network quality analysis reports that show trends in data latency, packet loss rate, probe counts, and daily active users to help you understand the network quality of your application.
Data filters
Trend analysis
The Network Quality Analyzer application displays trends for data latency, packet loss rate, and probe counts based on the filters that you set.
- Latency: Shows the data latency trend based on the filters that you set.
You can click the average value or any point on the line chart to view latency rankings by region and ISP. This helps you quickly understand the network quality for a specific region and ISP during a specific time period.
- Packet loss rate: Shows the packet loss rate trend based on the filters that you set.
You can click the average value or any point on the line chart to view packet loss rate rankings by region and ISP. This helps you quickly understand the network quality for a specific region and ISP during a specific time period.
- Probe counts: Shows the probe count trend based on the filters that you set.
You can click the total count or any point on the line chart to view probe count rankings by region and ISP.
Comparative analysis
Based on the filters that you set, the Network Quality Analyzer application displays the latency, packet loss rate, number of users, and comparison rankings for different regions and ISPs in a specified time period.
Quality map
- You can view specific end-to-end latency and packet loss rates.
- Latency is differentiated by color. This helps you quickly and visually identify high-latency paths.
- You can click a destination region to view its user density.
Daily active users
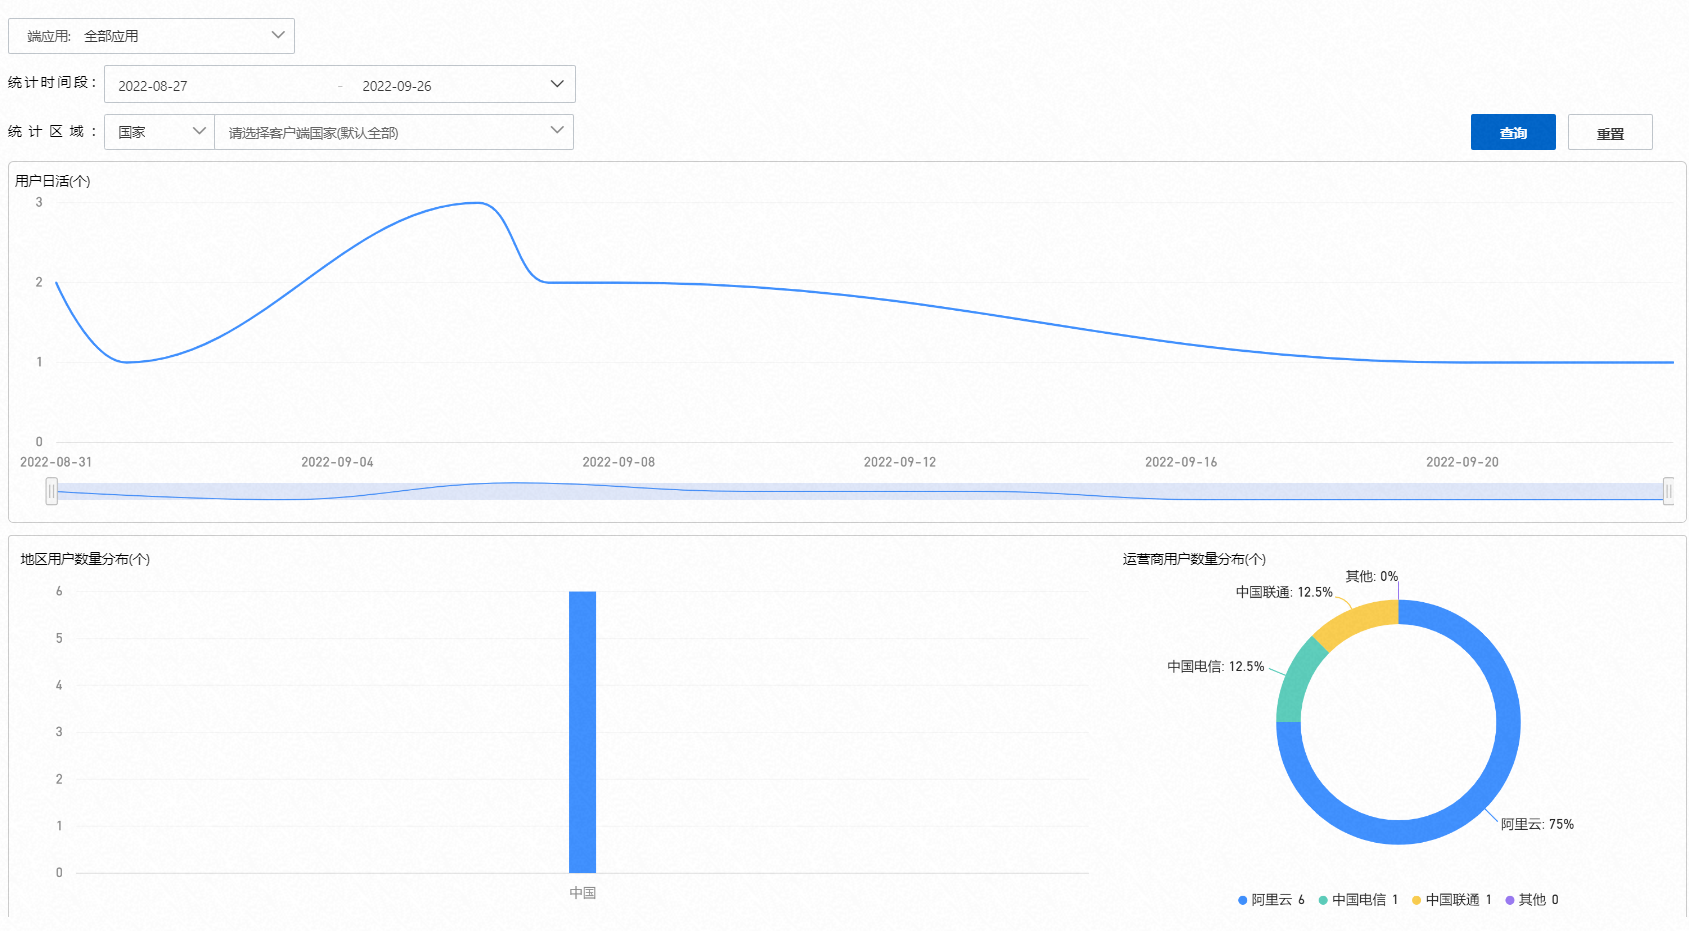
Based on the filters that you set, the Network Quality Analyzer application displays the daily active user trend, the number of users per region, and the number of users per ISP.