Query and analyze application logs
Simple Log Service provides query statements and SQL-compatible syntax for querying, associating, and statistically analyzing application logs to support troubleshooting and performance analysis.
Background information
Application logs are essential for application operations and maintenance, but their diverse formats, large volumes, distributed storage, and complex runtime environments make them difficult to collect and analyze. Simple Log Service addresses these challenges by providing diverse log collection methods and a unified analysis platform. You can analyze logs in real time by using query statements and SQL-92 syntax, and visualize the analysis results in charts.
Application logs have the following characteristics:
Arbitrary formats: Different developers have different coding styles, and the styles of the logs that they generate also differ. This makes the log formats difficult to unify.
Large data volume: Application logs are typically much larger than access logs.
Distribution across many servers: Most applications are stateless and run on different frameworks, such as cloud servers and container services. The number of instances ranges from a few to thousands. Therefore, a cross-server log collection solution is required.
Complex runtime environments: Applications run in different environments, and the logs that they generate are also stored in different environments. For example, application-related logs are stored in containers, API-related logs are stored in Function Compute, legacy system logs are stored in on-premises data centers, mobile app logs are stored on the user side, and web page logs are stored in browsers.
Simple Log Service supports three analysis approaches for application logs:
Query: Search for specific log entries by keywords or conditions. Use this approach to quickly locate issues such as errors or high-latency requests.
Association analysis: Correlate related log entries within a process or across processes. Use this approach to trace a request through multiple services or to view the context around a specific log entry.
Statistical analysis: Aggregate and compute statistics over log data with SQL syntax. Use this approach to identify patterns such as error distribution or frequency trends.
Query application logs
When an application encounters issues such as order errors or request latency, you can use a query statement to locate the relevant log entries. You can specify a time range and query keywords to narrow results.
The following examples show common query patterns:
Query request data whose latency is greater than 1 second and whose request method starts with Post.
Latency > 1000000 and Method=Post*Query logs that contain the error keyword but do not contain the merge keyword.
error not mergeAssociate application logs
Association analysis correlates related log entries to reconstruct the flow of a request. It includes intra-process association and cross-process association.
Intra-process association
Intra-process association correlates log entries within the same process. Because the preceding and following logs of the same process are in the same file, this type of association is generally straightforward. In a multi-threaded environment, you need only to perform row filtering by thread ID.

Use a contextual query to view the associated logs. For example, you can locate an abnormal log entry by using a keyword query, and then click Context View to view the N log entries that precede and follow the log entry. For more information about the procedure, see contextual query. On the Raw Logs tab of Simple Log Service, select the Raw display mode, and then click the context view icon (the magnifier icon) to the left of the target log entry to view the context information of the log entry and perform intra-process association analysis.
In the Context View page, the current log entry (position 0) is highlighted, and the context range covers 3 log entries before and 3 log entries after the current entry (-3 to +3). The page also provides the Highlight and Filter input fields to help you quickly locate key information.
Cross-process association
Cross-process association correlates log entries across different processes or services. Cross-process requests generally have no explicit clues and are associated by using the TracerId that is passed in a remote procedure call (RPC).
Cross-process association is also referred to as tracing. Common tools include EagleEye, Dapper, Stackdriver Trace, Zipkin, Appdash, and X-Ray.
You can implement basic tracing based on Simple Log Service. Output identifier fields that can be associated, such as Request_id and OrderId, in the logs of each module, and then search different LogStores to obtain all related logs.
In the search bar of the Simple Log Service (SLS) query page, enter the request_id value 595F9A92D30E8E444FC971F4 to run a query, and set the time range to 15 Minutes (Relative). A total of 15 associated logs are found, and the query status is Exact Results.
If you expand the details of the first log entry, you can see that the Nginx access log of the request has the status code status:404, the log time 22/Oct/2020:11:08:52, the source IP address 172.16.64.165, and the log file path /root/testnginx/acce...1.log. You can use request_id to perform cross-process log association analysis and quickly locate the complete path of a problematic request.
You can also use an SDK to query the logs of frontend servers, backend servers, payment systems, and order systems. After you obtain the results, you can create a frontend page to associate the cross-process analysis.
In a tracing system, after you select a specific trace ID, you can view the complete call chain in a tree structure, including the call hierarchy and the time consumption of each method. For example, KVEngine::QueryInterval under ServerBase::HandleRequest takes 61935 μs, which accounts for 98.99% of the total time consumption and is the major performance bottleneck. YouchaoFile::CreateBlock takes 19603 μs, which accounts for 31.32%. Call chain analysis helps you quickly locate the methods that cause performance bottlenecks in cross-process requests.
Perform statistical analysis on application logs
After you query the logs, you can perform further statistical analysis.
Execute the following query and analytic statement to collect statistics on the distribution of the types and locations of all errors.
__level__:error | select __file__, __line__, count(*) as c group by __file__, __line__ order by c desc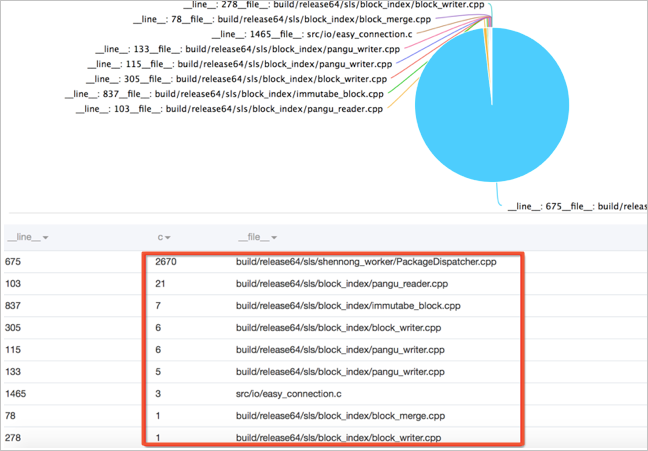
The preceding statement filters error-level log entries and groups them by source file (__file__) and line number (__line__). The c column shows the number of errors at each location, sorted in descending order. The image above illustrates the resulting error distribution.