Query and analyze metric data in a Log Service Metricstore, and customize legend formats for time series charts.
Prerequisites
Metric data is collected.
Procedure
The Metricstore query page supports only PromQL syntax. To use SQL or SQL+PromQL, choose to switch to the corresponding Logstore query page.
Log on to the Simple Log Service console.
In the Projects section, click the one you want.

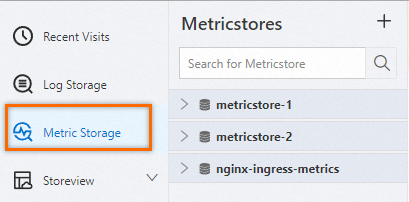
On the tab, click the metricstore you want.
-
In the upper-right corner of the page, click 15 Minutes (Relative) to set the time range for your query.
NoteThe query and analysis results may differ from the specified time range by up to one minute.
-
Run a query.
Enter a query statement in one of the following ways:
-
Enter a PromQL statement and click Execute Now.
You can add multiple queries. Results are overlaid in the same time series chart.
-
In the Metrics Explore pane, click the
 icon next to a metric to auto-generate a query statement.
You can also click Continue to Explore for a metric in the Metrics Explore pane to set label values and auto-generate a query. Metric exploration.
The editor auto-completes PromQL functions (such as
abs,avg, andavg_over_time) and metric names as you type. -
Validate PromQL syntax
With automatic tree parsing enabled, the editor suggests PromQL functions, aggregate functions, metric names, label keys, label values, and time ranges as documented in the official Prometheus documentation.
Log Service validates PromQL syntax in real time as you type.
-
Valid syntax
If The syntax is valid. appears, validation succeeded and a syntax parsing tree is generated.
-
Invalid syntax
If an error message appears, validation failed. A partial syntax tree shows the error location and cause.
In this example,
[5]is missing a time unit (m,s, orh), causing the error4:1 parse error: unexpected <aggr:sum>:label_replace( sum by(pod_name)( rate(container_cpu_usage_seconds_total{namespace= "redash"}[5]) ), "pod", "$1", "pod_name", "(.+)" )
During validation, you can also:
-
Click the
 icon to refresh the syntax parsing tree.
 -
Click the
 icon to simplify the node information in the syntax parsing tree.
 -
Click the
 or icon to expand or collapse nodes.
 -
Click the
or icon to enable or disable the automatic tree parsing feature.
Metric exploration
Click Metrics Explore to browse metrics and their label data. Use the search bar to filter metrics by name. The results table lists metrics such as cpu_count, cpu_guest_util, and cpu_sys_util, along with the total count and time range. Each metric provides Continue to Explore, Copy, and Add actions.
On the Metrics Explore panel:
-
Set a time range: The default time range is 5 minutes. To change it, click Change to modify the time range.
Click the
icon to reset the time range. -
Filter metrics: In the search box, enter a metric name to filter metrics.
-
Copy a metric name: Click the
icon to copy the metric name. -
Add to the query box: Click the
icon to add the metric name to the query box. -
Continue to explore: Click Continue to Explore to view label keys, unique value counts, and sample values for a metric.
Click Filter to filter by label values using four PromQL operators, selectable or manual conditions, and regular expressions.
The system generates a query based on your filters. Click Copy Query Statement or Add to Search Box to run the query.
Legend format
Customize legend display names in the time series chart after running a query.
The step auto-adjusts based on the time range, but you can customize it.
By default, legend names combine the metric name and labels. Use {{value_name}} variables to reference specific label values. For example, if a label is {ip="192.0.2.1"}, setting Legend Format to {{ip}} displays 192.0.2.1 as the legend name. Enter a custom format in the Legend Format input box below the query input box.
Related operations
|
Actions |
Description |
|
Metric statistics |
Click Metric Statistics to open the Metric Statistics dashboard, which shows data volume, metric counts, timelines, data entries, top metrics, and period-over-period and year-over-year changes. |
|
Metric governance |
Click Metric Governance to open the Metric Governance dashboard, which provides time series scenario analysis, metric trend charts, summary statistics, and an end-to-end workflow for native statistics, data analysis, optimization, and anomaly diagnosis. |
|
View table data |
Toggle Table Data to display query results in a table. |
|
Preview raw data |
Click Preview Raw Data to view raw metric data. |
|
Data transformation |
Choose to perform data transformation. Overview of data transformation. |
|
Custom analysis |
Choose . This opens the corresponding Logstore query page, which supports SQL and SQL+PromQL queries. |
|
Save analysis results as a Scheduled SQL job |
Choose to process metric data with a Scheduled SQL job and store results in a destination Metricstore. Create a Scheduled SQL job to import data from a Metricstore to another Metricstore. |
|
Add to dashboard |
Click Add to New Dashboard to add the current chart to a dashboard. Add a chart to a dashboard. Customize chart properties after adding it to a dashboard. Time series chart. |
|
Save as alert |
Click Save as Alert to configure an alert for the query results. Create an alert. |
|
Copy query and analysis window |
Click the |
|
Delete query and analysis window |
Click the |
|
Refresh data |
Click the |
|
Share |
Click the |
 icon to delete the current query and analysis window.
 icon to copy the URL of the current Metricstore query page. Share this link with users who have Metricstore access. The link preserves all your settings.