Display data using Grafana
After you connect Tablestore to Grafana, you can use Grafana to visualize data from Tablestore.
Prerequisites
In the Resource Access Management (RAM) service, perform the following operations:
Create a RAM user and grant the user the AliyunOTSFullAccess permission to manage Tablestore.
WarningIf the AccessKey for your Alibaba Cloud account is leaked, all your resources are at risk. To mitigate this risk, use the AccessKey of a RAM user for all operations.
Complete the following operations in the Tablestore service:
You have created a data table and a time series table.
Install open source Grafana version 8.0.0 or later. This topic uses Grafana v10.4.2 as an example. For more information about how to install Grafana, see the official Grafana documentation.
NoteYou can also use Alibaba Cloud Managed Service for Grafana, which includes Tablestore integration by default. For more information, see Add and use a Tablestore data source.
Background information
Grafana is an open source visualization and analytics platform. It supports data query and visualization for various data sources, such as Prometheus, Graphite, OpenTSDB, InfluxDB, Elasticsearch, MySQL, and PostgreSQL. For more information, see the official Grafana documentation.
After you ingest table data from Tablestore into Grafana, Grafana can generate dashboards based on the table data. This lets you display data to users in real time.
Notes
Tablestore supports data visualization with Grafana in the following regions: China (Hangzhou), China (Shanghai), China (Beijing), China (Zhangjiakou), China (Shenzhen), and Singapore.
Step 1: Install the Tablestore plugin
Windows
Download the Tablestore Grafana plugin package.
Decompress the Tablestore Grafana plugin package and move the resulting folder to the plugins-bundled directory in your Grafana installation.
Modify the Grafana configuration file.
Use a text editor to open the defaults.ini configuration file in the conf directory of your Grafana installation.
In the [plugins] section of the configuration file, set the allow_loading_unsigned_plugins parameter.
allow_loading_unsigned_plugins = aliyun-tablestore-grafana-datasource
In Task Manager, restart the grafana-server.exe process.
Mac/Linux
Run the following command to download the Tablestore Grafana plugin package.
wget https://help-static-aliyun-doc.aliyuncs.com/file-manage-files/zh-CN/20220527/ygdf/tablestore-grafana-plugin-1.0.0.zipDecompress the Tablestore Grafana plugin package to the Grafana plugins directory.
Run the command that corresponds to your Grafana installation method.
For Grafana installed using Yellowdog Updater, Modified (YUM) or RPM Package Manager (RPM) (Linux only): unzip tablestore-grafana-plugin-1.0.0.zip -d /var/lib/grafana/plugins
For Grafana installed from a .zip file: unzip tablestore-grafana-plugin-1.0.0.zip -d {PATH_TO}/grafana-{VERSION}/data/plugins
NoteIn this path,
{PATH_TO}/grafana-{VERSION}is the installation path of Grafana and{VERSION}is the version number of Grafana.
Modify the Grafana configuration file.
Open the configuration file from the appropriate directory.
For Grafana installed using YUM or RPM (Linux only): /etc/grafana/grafana.ini
For Grafana installed from a .zip file: {PATH_TO}/grafana-{VERSION}/conf/defaults.ini
NoteIn this path,
{PATH_TO}/grafana-{VERSION}is the installation path of Grafana and{VERSION}is the version number of Grafana.
In the [plugins] section of the configuration file, set the allow_loading_unsigned_plugins parameter.
allow_loading_unsigned_plugins = aliyun-tablestore-grafana-datasource
Restart Grafana.
Use the kill command to stop the Grafana process.
Run the following command to start Grafana.
For Grafana installed using YUM or RPM (Linux only): systemctl restart grafana-server
For Grafana installed from a .zip file: ./bin/grafana-server web
Step 2: Configure the data source
Log on to Grafana.
In a browser, enter
http://<x.x.x.x>:3000/to open the Grafana logon page.Note<x.x.x.x>represents the IP address of the server where Grafana is installed. For example, if Grafana is installed on Windows, the logon address ishttp://localhost:3000.Enter your Email or username and Password, and click Log in.
NoteThe default username and password for the initial logon are both admin. When you log on for the first time, you are prompted to change the initial password.
On the Grafana home page, click the
 icon in the upper-left corner.
In the navigation pane on the left, choose .
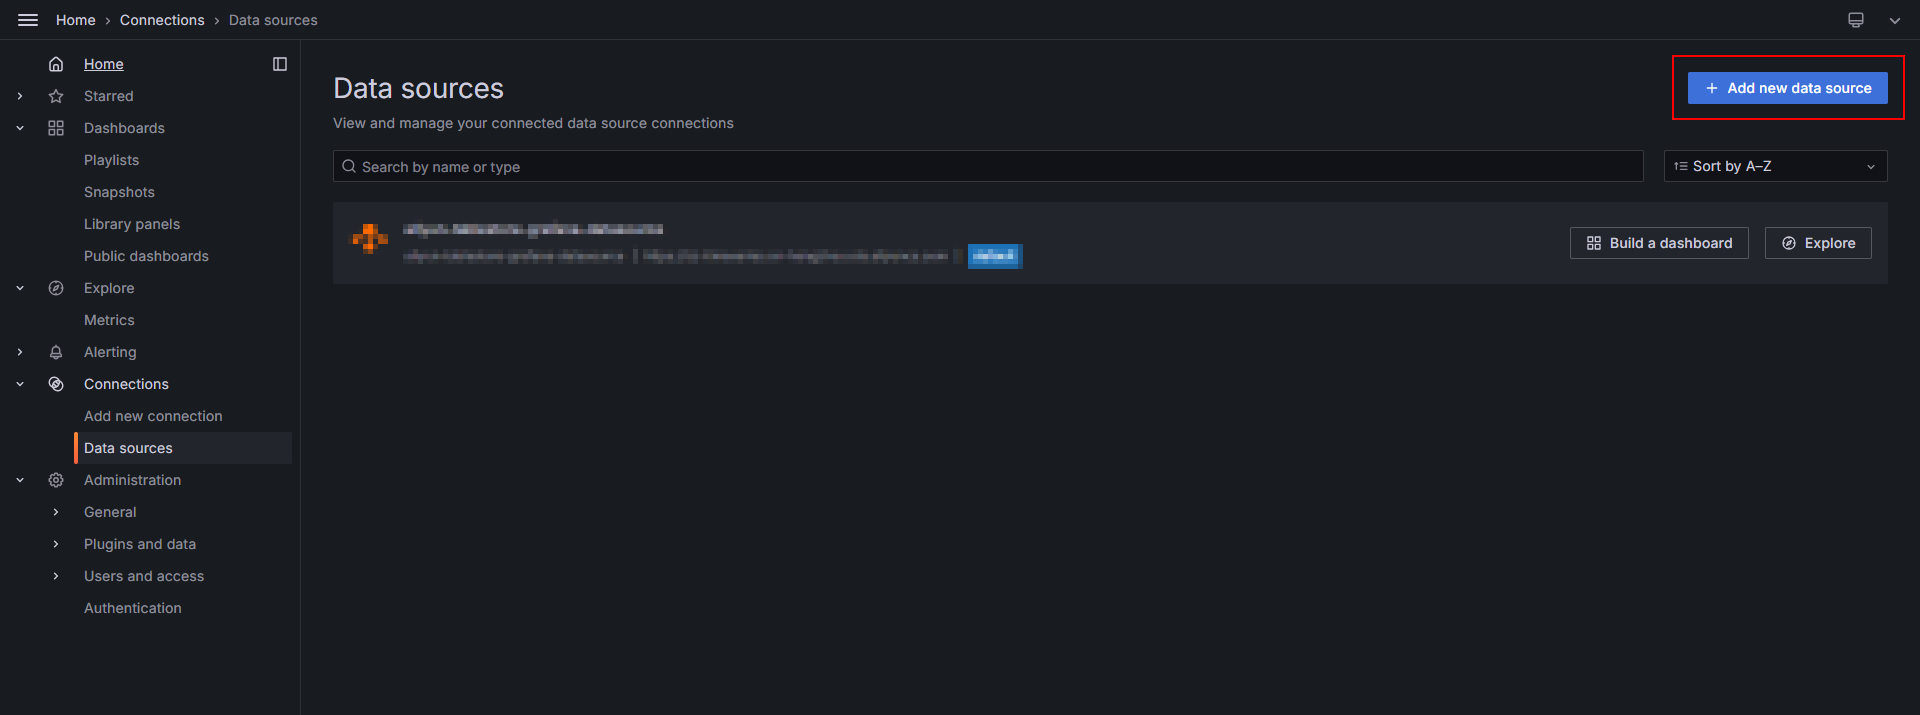
On the Data Sources page, click + Add New Data Source.
On the Add data source page, under Others, click aliyun-tablestore-grafana-datasource.
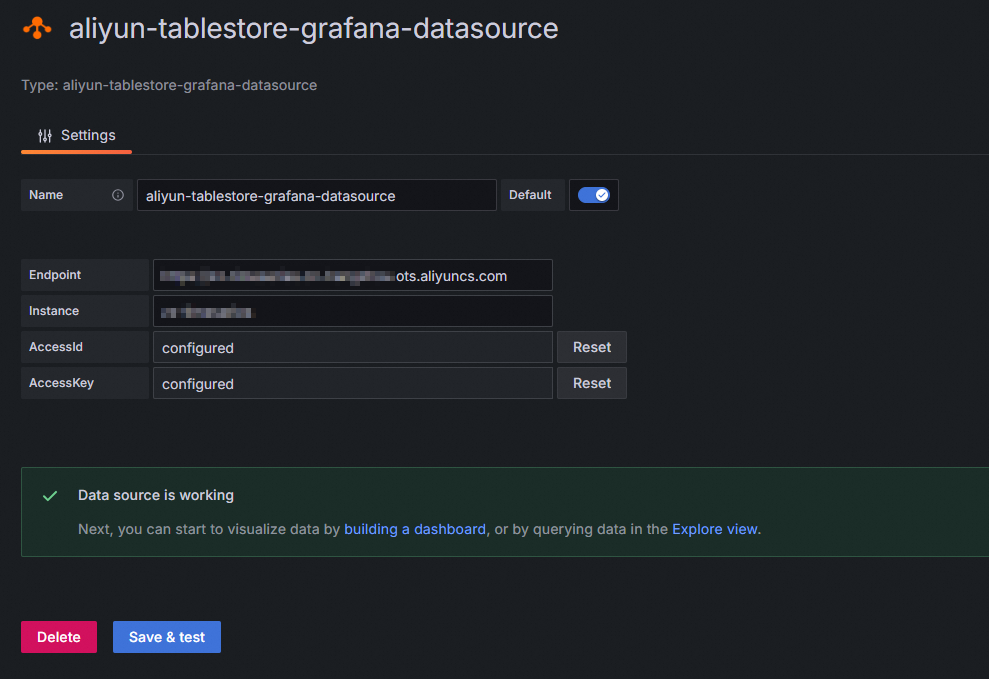
On the Settings page, configure the parameters as described in the following table.
Parameter
Example
Description
Name
aliyun-tablestore-grafana-datasource
The name of the data source. You can customize the name. The default value is aliyun-tablestore-grafana-datasource.
Endpoint
https://myinstance.cn-hangzhou.ots.aliyuncs.com
The endpoint of the Tablestore instance. Enter the endpoint based on the Tablestore instance that you want to access. For more information, see Endpoints.
Instance
myinstance
The name of the Tablestore instance.
AccessId
************************
The AccessKey ID of the Alibaba Cloud account or RAM user that has permissions to access Tablestore.
AccessKey
********************************
The AccessKey secret of the Alibaba Cloud account or RAM user that has permissions to access Tablestore.
Click Save & test.
If the connection is successful, the Data source is working message is displayed.
Step 3: Create a dashboard panel
On the Grafana home page, click the
icon in the upper-left corner.In the left navigation pane, click Dashboards.
On the Dashboards page, click New and select New dashboard.
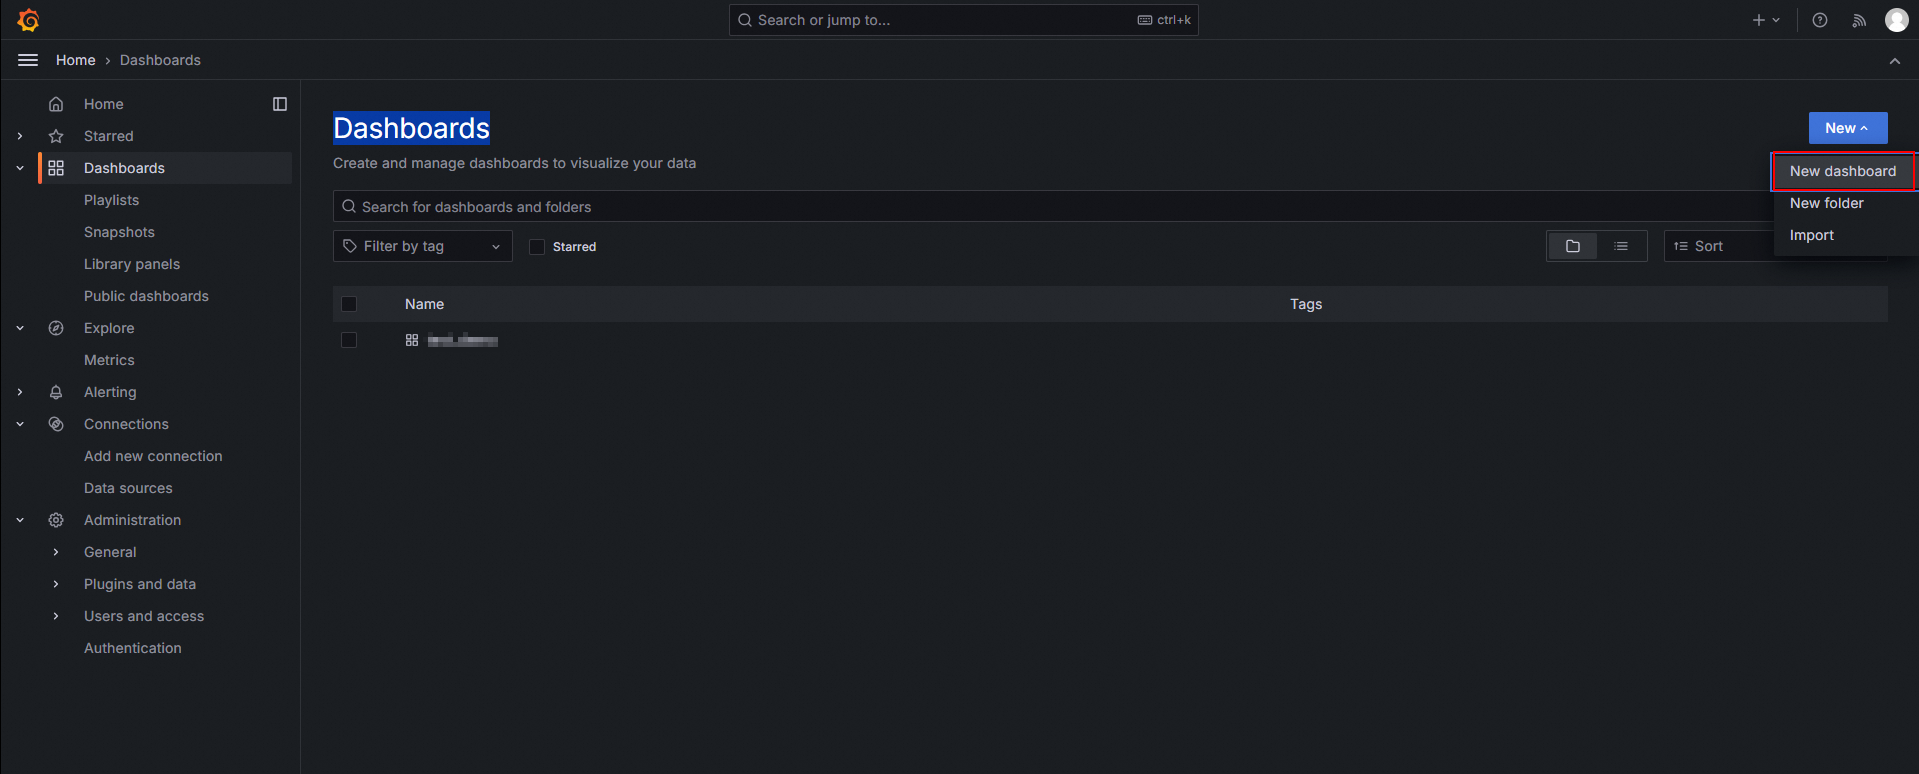
On the New dashboard page, click + Add visualization.
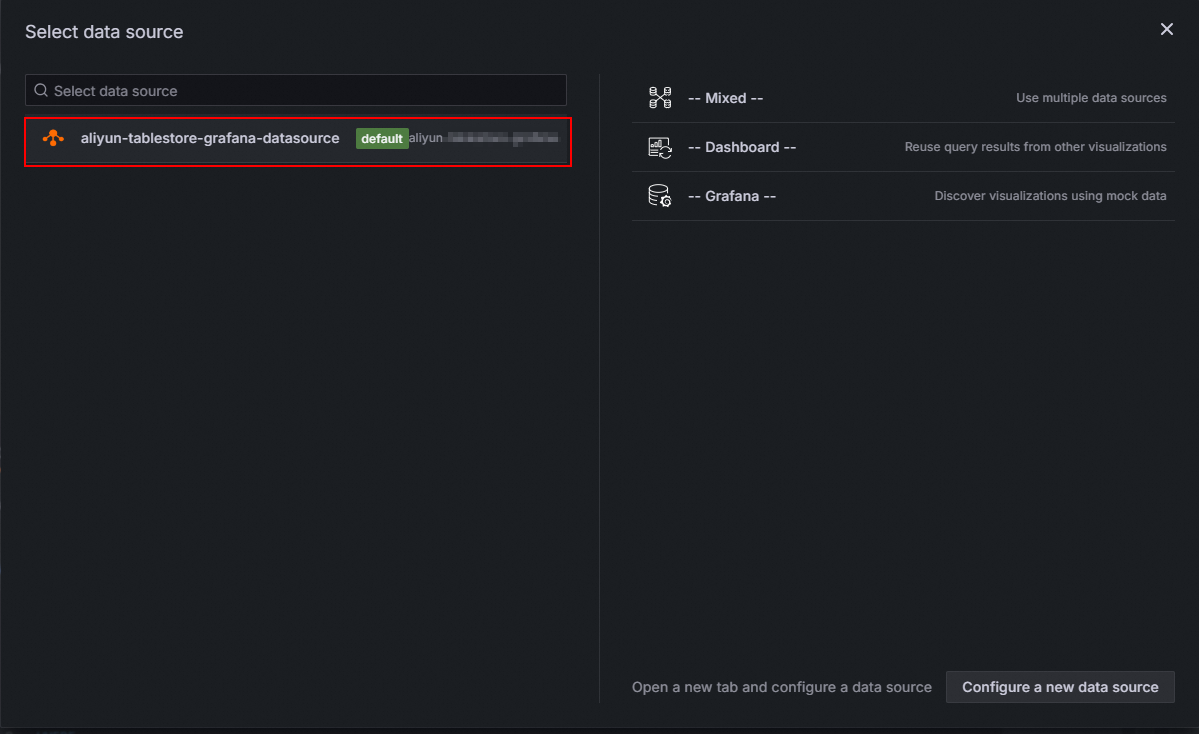
In the Select data source dialog box, select the configured Tablestore data source.

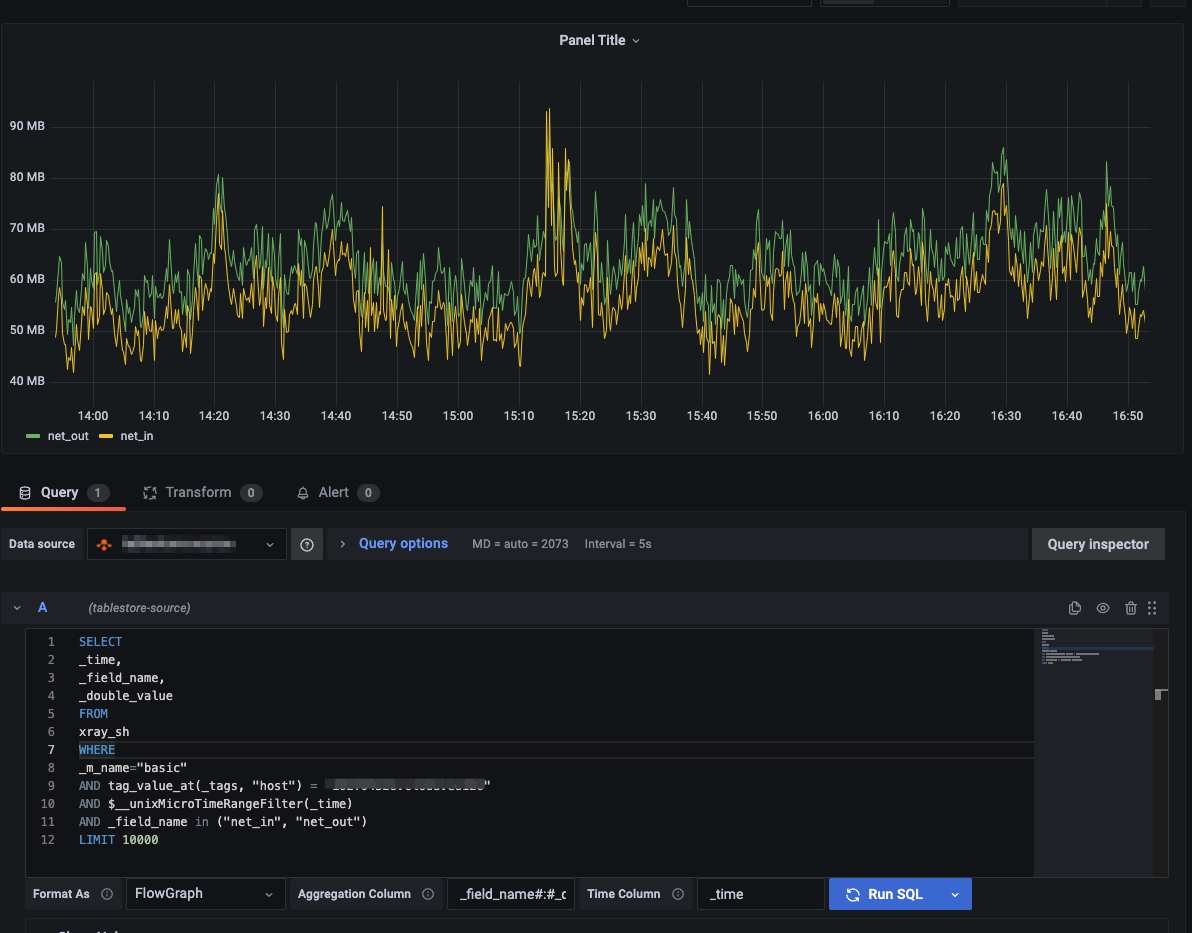
On the Edit page, configure the query conditions in the Query section.
The following table describes the parameters.
Parameter
Example
Description
Query
SELECT * FROM your_table WHERE $__unixMicroTimeRangeFilter(_time)AND _m_name = "your_measurement" AND tag_value_at(_tags, "your_tag")="your_tag_value"LIMIT 1000The SQL query statement. For more information, see Query data.
ImportantIn the WHERE clause, use a predefined macro to filter the time range. For example, use
$__unixMicroTimeRangeFilter. To view more time macro functions, click Show Help on the configuration page.If you display the data in a time series chart, you must return a time column that is represented as a numeric timestamp and configure the name of the time column.
Format As
Timeseries
The format for processing the results. Valid values:
Timeseries (default): A standard time series chart.
FlowGraph: A multi-dimensional chart.
Table: A standard table.
Time Column
_time
The name of the time column in the returned data. The time column is used as the horizontal axis of the time series chart. This parameter is available when you set Format As to Timeseries or FlowGraph.
Aggregation Column
_field_name#:#_double_value
Converts multi-row, single-column data at the same point in time to single-row, multi-column data at the same point in time. This is useful for transforming single-value model data generated by Tablestore time series SQL into multi-value model data. This parameter is available when you set Format As to FlowGraph. The format is
<data_point_name_column>#:#<numeric_value_column>.Click Run SQL to execute the SQL statement and debug the data.
Set and save the dashboard panel.
In the panel on the right, set the name, type, and display style of the monitoring chart.
In the upper-right corner, click Apply.
In the upper-right corner, click Save. In the Save dashboard dialog box, set the Title, Description, and Folder, and then click Save.
Step 4: View monitoring data
On the Grafana home page, click the
icon in the upper-left corner.In the navigation pane on the left, choose Dashboards. Click the monitoring dashboard in the target directory to view all of its monitoring charts.