Incremental synchronization performance benchmark
Incremental synchronization in Tablestore Tunnel Service scales with the number of table partitions and with the number of consumer machines. In this benchmark, throughput ranges from 19,000 rows/sec on one machine with a single partition to approximately 1 million rows/sec on two machines with 128 partitions, where the client-side 1-gigabit network interface controller (NIC) becomes the limiting resource. Use these measurements to size partitions and consumer machines for a target incremental synchronization rate.
Benchmark scope
The results in this document are bounded by the following conditions:
Test period — January 30 to January 31, 2019. All measurements reflect the ECS instance type, NIC, and operating system available at that time.
Variable under test — the number of table partitions, which equals the number of channels in an incremental tunnel, and the number of consumer machines. All other conditions remain constant.
Workload — rows of approximately 220 bytes, distributed evenly across all partitions. The Test data section describes the full data model.
Client hardware — one or two ECS instances, each with 16 cores, 64 GB of memory, and a 1-gigabit NIC. The Test environment section lists the full configuration.
Known bottleneck — the 1-gigabit NIC of the client machine. Where throughput stops increasing with the partition count, client bandwidth saturation is the cause, not Tablestore server capacity.
Out of scope — the performance limits of the service. This benchmark applies a relatively small load to the Tablestore server and measures performance from the perspective of actual usage. End-to-end latency between a write on the server and its consumption by the client is not measured.
Test environment
Tablestore instance
Instance type — high-performance instance.
Region — China (Hangzhou).
Endpoint — private endpoint, which prevents network uncertainty from affecting the results.
Client machines
Type — Alibaba Cloud ECS.
Region — China (Hangzhou).
Model — shared general-purpose (mn4)
ecs.mn4.4xlarge.CPU — 16 cores.
Memory — 64 GB.
NIC — Red Hat, Inc. Virtio network device with 1-gigabit bandwidth.
Operating system — CentOS 7u2.
Test tools
Three tools produce the measurements in this benchmark. The load generator and the pre-partitioning tool are internal Tablestore tools and are not available for self-service use.
Load generator — the load testing tool used internally by Tablestore. It writes data in concurrent batches, based on the
BatchWriteoperation of the Tablestore Java SDK.Pre-partitioning tool — the same internal Tablestore load testing tool. It creates tables and pre-partitions them automatically, based on the table name and partition count that you configure. This capability belongs to the internal tool and is not exposed for self-service use.
Rate monitoring tool — measures the real-time incremental consumption rate by using the Tunnel Java SDK. Add rate statistics logic similar to the following example to the callback that you pass in, and the tool reports the rate and the total number of consumed rows in real time.
private static final Gson GSON = new Gson();
private static final int CAL_INTERVAL_MILLIS = 5000;
static class PerfProcessor implements IChannelProcessor {
    private static final AtomicLong counter = new AtomicLong(0);
    private static final AtomicLong latestTs = new AtomicLong(0);
    private static final AtomicLong allCount = new AtomicLong(0);
    @Override
    public void process(ProcessRecordsInput input) {
        counter.addAndGet(input.getRecords().size());
        allCount.addAndGet(input.getRecords().size());
        if (System.currentTimeMillis() - latestTs.get() > CAL_INTERVAL_MILLIS) {
            synchronized (PerfProcessor.class) {
                if (System.currentTimeMillis() - latestTs.get() > CAL_INTERVAL_MILLIS) {
                    long seconds = TimeUnit.MILLISECONDS.toSeconds(System.currentTimeMillis() - latestTs.get());
                    PerfElement element = new PerfElement(System.currentTimeMillis(), counter.get() / seconds, allCount.get());
                    System.out.println(GSON.toJson(element));
                    counter.set(0);
                    latestTs.set(System.currentTimeMillis());
                }
            }
        }
    }
    @Override
    public void shutdown() {
        System.out.println("Mock shutdown");
    }
}
The example prints one JSON record per statistics interval with the timestamp, speed, and totalCount fields. The rate logs in the Test details section use the same format.
Test plan
When you synchronize data by using Tunnel Service, data within a single channel is synchronized serially to keep your data in order, whereas different channels are synchronized in parallel. In an incremental scenario, the number of channels equals the number of table partitions. Because the overall performance of Tunnel Service is closely related to the number of table partitions, this benchmark uses the number of partitions, that is, the number of channels, as its only variable.
The number of partitions grows automatically with the data volume. To create partitions in advance, contact Tablestore technical support.
Test scenarios
The benchmark covers seven scenarios:
Single machine, 1 partition
Single machine, 4 partitions
Single machine, 8 partitions
Single machine, 32 partitions
Single machine, 64 partitions
Two machines, 64 partitions
Two machines, 128 partitions
Test procedure
Every scenario follows the same sequence: prepare the table and the tunnel, apply the write load, and then collect rate, resource, and bandwidth data.
Create a data table and pre-partition it. Each partition-count scenario uses a separate table.
Create an incremental tunnel.
Use the load generator to write incremental data.
Use the rate monitoring tool to collect QPS in real time, and observe the system resources, such as CPU and memory, that the program consumes.
Obtain the total network bandwidth consumed by incremental data synchronization from the monitoring data.
Test metrics
The benchmark reports the following metrics:
QPS (rows/sec) — the number of rows synchronized per second.
Avg latency (ms/1,000 rows) — the average time in milliseconds required to synchronize 1,000 rows, derived from the measured QPS. This value is the inverse of throughput. It does not represent the end-to-end delay between a write and its consumption.
CPU (cores) — the total number of single-core CPUs consumed by data synchronization. This document states CPU in cores and gives the measured single-core percentage in parentheses.
Mem (GB) — the total physical memory consumed by data synchronization.
Bandwidth (MBps) — the total network bandwidth consumed by data synchronization.
Test data
The sample data consists of four primary key columns and one or two attribute columns. Each row is approximately 220 bytes. The values of the first primary key column, which is the partition key, are generated by using a 4-byte hash, which distributes the test data evenly across all partitions.
The four primary key columns are uid, name, class, and time. The attribute columns are col0 and col1. The name and class columns contain random strings. The time, col0, and col1 columns contain 13-digit timestamps.
Test results
Incremental synchronization throughput increases with the number of partitions in every tested scenario, and adding a second consumer machine raises total throughput beyond what one machine with a 1-gigabit NIC delivers. The following table compares all seven scenarios and is the authoritative source for the measured values.
| Scenario | Machines | Partitions | Stable QPS (rows/sec) | Peak QPS (rows/sec) | Avg latency (ms/1,000 rows) | CPU (cores) | Mem (GB) | Bandwidth (MBps) |
| Single machine, 1 partition | 1 | 1 | Approximately 19,000 | 21,800 | Approximately 50 | 0.25 (25%) | 0.256 (0.4%) | Approximately 4 (4,000 KB/s) |
| Single machine, 4 partitions | 1 | 4 | Approximately 70,000 | 72,400 | Approximately 14.28 | 0.7 (70%) | 1.1 (1.9%) | Approximately 13 |
| Single machine, 8 partitions | 1 | 8 | 130,000 | 141,644 | Approximately 7.69 | 1.2 (120%) | 2.62 (4.1%) | Approximately 27 |
| Single machine, 32 partitions | 1 | 32 | 420,000 | 447,600 | 2.38 | 4.5 (450%) | 5.25 (8.2%) | Approximately 86 |
| Single machine, 64 partitions | 1 | 64 | Approximately 570,000 | 581,400 | Approximately 1.75 | 6.4 (640%) | 5.376 (8.4%) | Approximately 125, the rate limit of the 1-gigabit NIC |
| Two machines, 64 partitions | 2 | 64 | Approximately 780,000 in total, approximately 390,000 per machine | Not recorded | 1.28 | 8.4 in total, 4.2 (420%) per machine | 10.5 in total (8.2% per machine) | Approximately 169 |
| Two machines, 128 partitions | 2 | 128 | Approximately 1 million in total, approximately 500,000 per machine | Not recorded | Approximately 1 | 10.2 in total (1020%) | 10.5 in total (8.2% per machine) | Approximately 220 |
Throughput and latency
Throughput rises with each added partition, but not in strict proportion: the throughput contributed by each partition decreases as partitions are added, so the growth is near-linear rather than linear. Two inflection points bound the trend:
Single machine, 64 partitions — the 1-gigabit NIC is saturated, which caps throughput at approximately 570,000 rows/sec. This limit belongs to the client, not to Tunnel Service.
Two machines, 64 partitions — the same 64 partitions consumed from two machines deliver approximately 780,000 rows/sec in total, approximately 1.9 times the single-machine, 32-partition result, with no change to the partition count.
With two machines and 128 partitions, the incremental synchronization rate of Tunnel Service reaches approximately 1 million rows/sec.
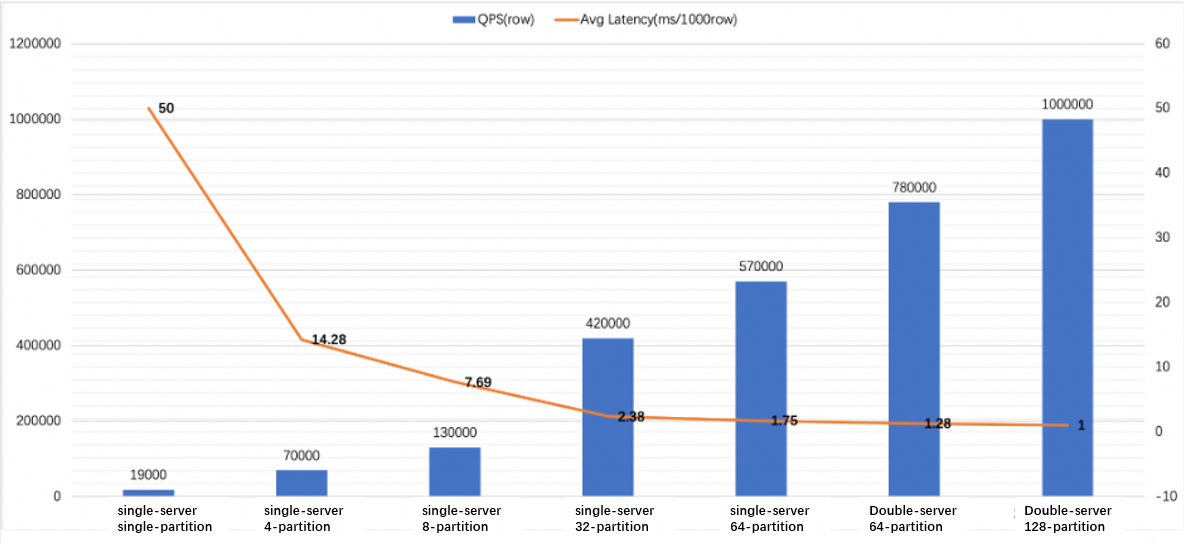
QPS and average latency by scenario.
System resource consumption
CPU consumption grows nearly in proportion to the number of partitions across the tested range, and it stays low relative to the throughput achieved. Memory consumption grows with the number of partitions while that number is small, and then plateaus at approximately 5.3 GB per machine in the 32-partition and 64-partition scenarios.
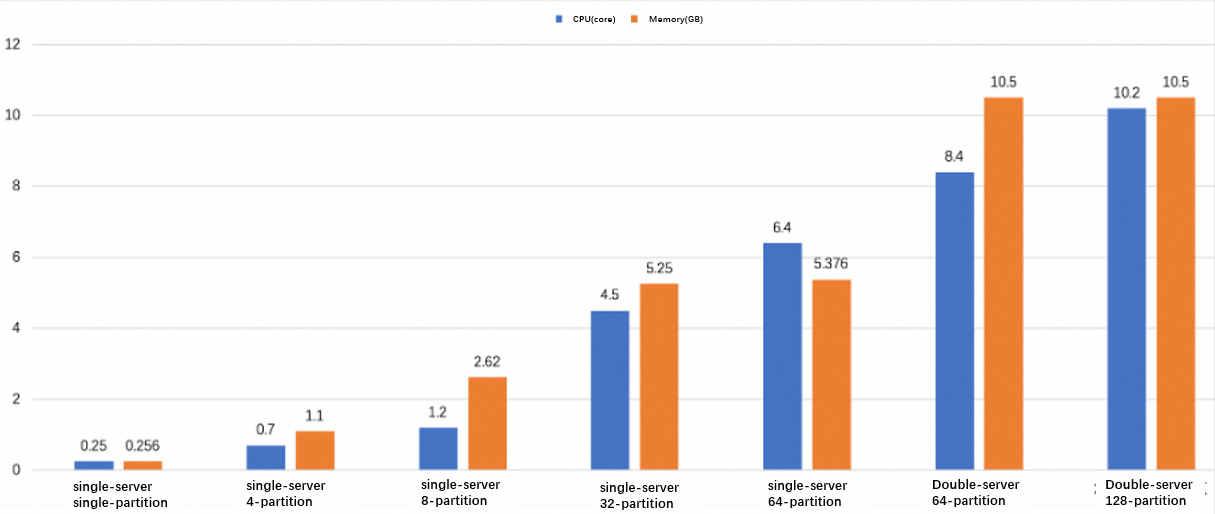
CPU and memory consumption by scenario.
Network bandwidth
Total bandwidth scales with the number of partitions, with one exception: in the single-machine, 64-partition scenario, the client NIC reaches its rate limit, so bandwidth stops tracking the partition count. Two machines consuming the same 64 partitions move nearly twice the bandwidth of the single-machine, 32-partition scenario, which confirms that the network of a single machine, not the partition count, is the limit in that scenario.
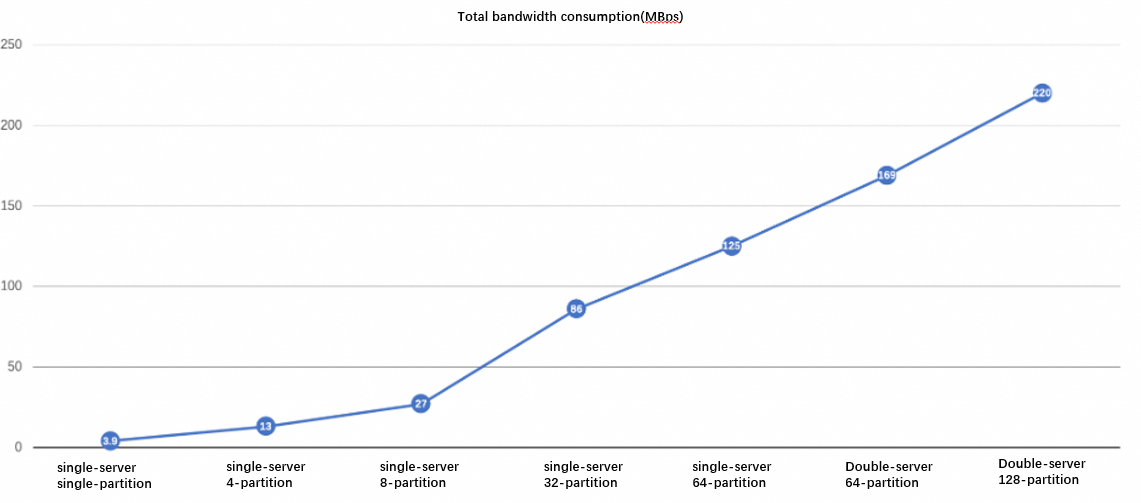
Total network bandwidth by scenario.
Capacity planning signals
Use the measured scenarios to decide whether to add partitions or add consumer machines:
Below the NIC limit, add partitions — while client bandwidth stays below the NIC rate limit, throughput increases with the number of partitions on a single machine, at the cost of proportionally higher CPU consumption.
At the NIC limit, add machines — the single-machine, 64-partition scenario consumes 125 MBps, the rate limit of a 1-gigabit NIC, and does not exceed approximately 570,000 rows/sec. Consuming the same 64 partitions from two machines raises total throughput to approximately 780,000 rows/sec.
Treat memory as a plateau, not a limit — memory per machine stays at approximately 5.3 GB at 32 and 64 partitions, so memory constrains none of the tested scenarios.
(Recommended) Default path — size the number of partitions for your target rate first, then add consumer machines when client bandwidth approaches the NIC rate limit. Consumption across multiple machines is automatic. Start the Tunnel client with the same tunnel ID on each machine, as described in Data consumption framework.
Test details
Each scenario below reports the console state of the tunnel, the measured metrics, an excerpt of the raw rate log that covers the stable and peak rates, and the bandwidth monitoring figure.
Single machine, 1 partition: 19,000 QPS
Test time — 2019-01-30 17:40.
QPS — stable rate of approximately 19,000 rows/sec; peak rate of 21,800 rows/sec.
Avg latency — approximately 50 ms/1,000 rows.
CPU — approximately 0.25 cores (25% of a single core).
Mem — approximately 0.256 GB (0.4% of the 64 GB physical memory).
Bandwidth — approximately 4 MBps (4,000 KB/s).
{"timestamp":1548841516239,"speed":19000,"totalCount":3094000}
{"timestamp":1548841521290,"speed":19200,"totalCount":3190000}
{"timestamp":1548841526318,"speed":20400,"totalCount":3292000}
{"timestamp":1548841581765,"speed":21800,"totalCount":4347000}
{"timestamp":1548841586787,"speed":21400,"totalCount":4454000}
{"timestamp":1548841606861,"speed":16200,"totalCount":4802000}
{"timestamp":1548841632035,"speed":18200,"totalCount":5244000}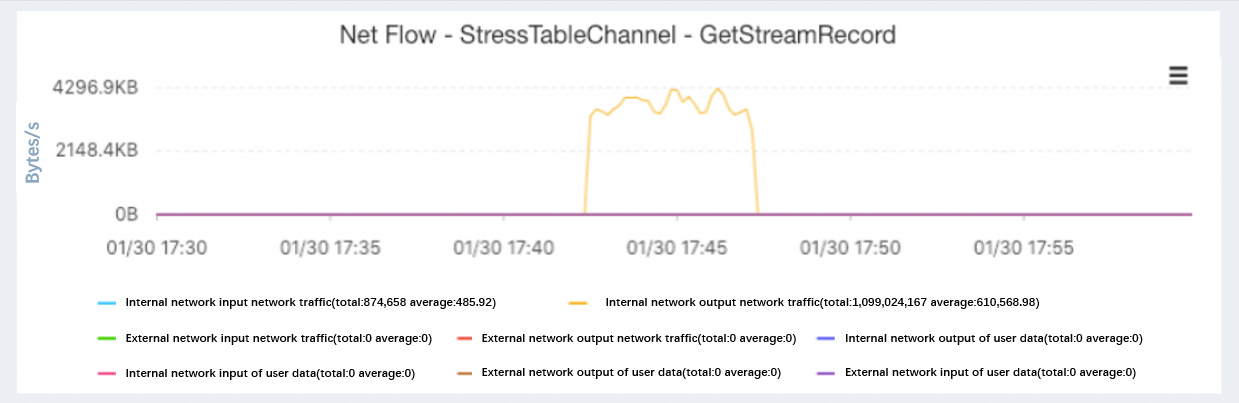
Bandwidth monitoring for the single machine, 1 partition scenario.
Single machine, 4 partitions: 70,000 QPS
Console state — in the Tunnel Service console, the teststream tunnel is of the Incremental type and contains 4 partitions. The consumption counts of the partitions are 249,000, 259,000, 267,000, and 266,000, and all partitions are in the Open state.
Test time — 2019-01-30 20:00.
QPS — stable rate of approximately 70,000 rows/sec; peak rate of 72,400 rows/sec.
Avg latency — approximately 14.28 ms/1,000 rows.
CPU — approximately 0.7 cores (70% of a single core).
Mem — approximately 1.1 GB (1.9% of the 64 GB physical memory).
Bandwidth — approximately 13 MBps.
{"timestamp":1548849903425,"speed":68200,"totalCount":345000}
{"timestamp":1548849913454,"speed":71800,"totalCount":1051000}
{"timestamp":1548849928501,"speed":71000,"totalCount":2106000}
{"timestamp":1548849978664,"speed":72400,"totalCount":5631000}
{"timestamp":1548849983699,"speed":68000,"totalCount":6311000}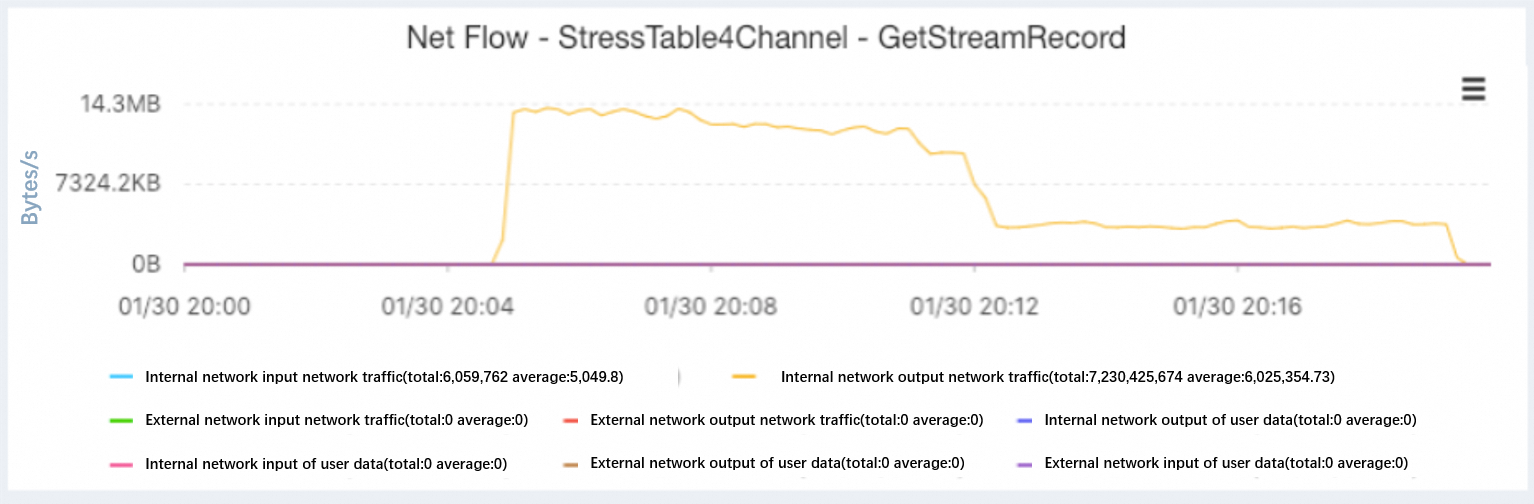
Bandwidth monitoring for the single machine, 4 partitions scenario.
Single machine, 8 partitions: 130,000 QPS
Console state — the tunnel is named teststream2. All 8 partitions are of the Incremental type and are in the Waiting state, the consumption count is 0, and the latest synchronization time of the incremental tunnel partitions is the initial value.
Test time — 2019-01-30 20:20.
QPS — stable rate of 130,000 rows/sec; peak rate of 141,644 rows/sec.
Avg latency — approximately 7.69 ms/1,000 rows.
CPU — approximately 1.2 cores (120% of a single core).
Mem — approximately 2.62 GB (4.1% of the 64 GB physical memory).
Bandwidth — approximately 27 MBps.
{"timestamp":1548850971326,"speed":136000,"totalCount":688000}
{"timestamp":1548850991360,"speed":139200,"totalCount":3460000}
{"timestamp":1548851041443,"speed":141400,"totalCount":10283000}
{"timestamp":1548851046452,"speed":141644,"totalCount":10991220}
{"timestamp":1548851061466,"speed":121944,"totalCount":12836585}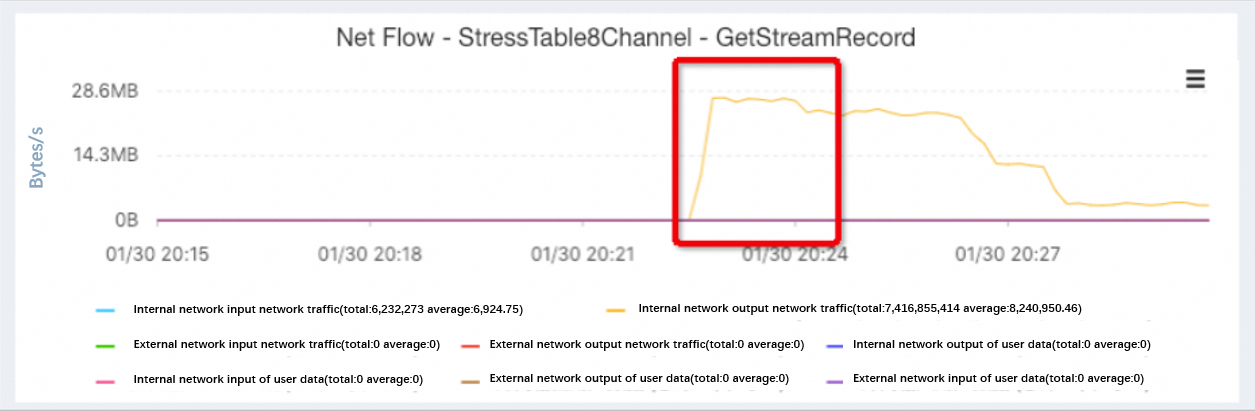
Bandwidth monitoring for the single machine, 8 partitions scenario.
Single machine, 32 partitions: 420,000 QPS
Console state — the teststream tunnel is of the Incremental type. All 32 tunnel partitions are in the Open state, the consumption count of each partition is 0, and the latest synchronization time of the incremental tunnel is 1970-01-01 08:00:00.
Test time — 2019-01-31 15:50.
QPS — stable rate of 420,000 rows/sec; peak rate of 447,600 rows/sec.
Avg latency — 2.38 ms/1,000 rows.
CPU — approximately 4.5 cores (450% of a single core).
Mem — approximately 5.25 GB (8.2% of the 64 GB physical memory).
Bandwidth — approximately 86 MBps consumed by incremental data.
{"timestamp":1548921206560,"speed":401800,"totalCount":2016000}
{"timestamp":1548921226573,"speed":440800,"totalCount":10796000}
{"timestamp":1548921251583,"speed":447600,"totalCount":21727000}
{"timestamp":1548921286610,"speed":403400,"totalCount":36400000}
{"timestamp":1548921301618,"speed":391936,"totalCount":42412564}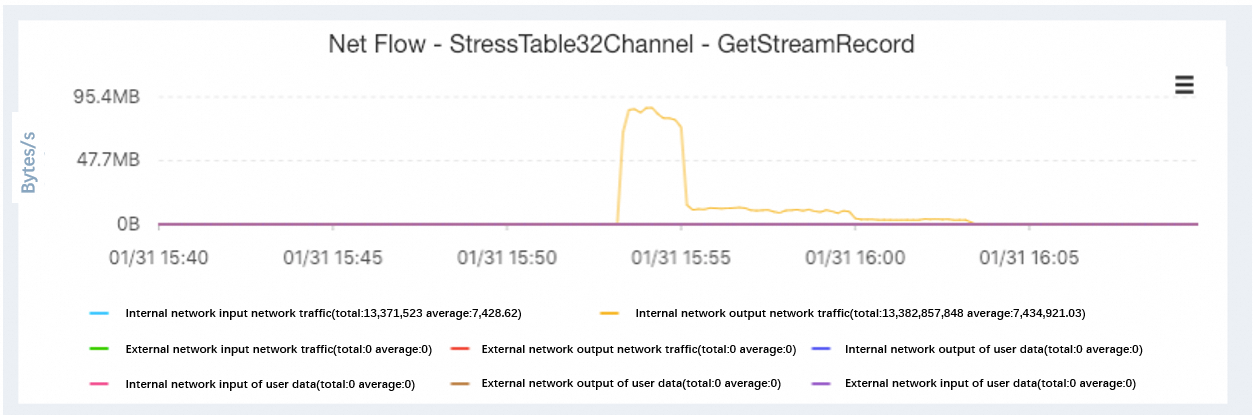
Bandwidth monitoring for the single machine, 32 partitions scenario.
Single machine, 64 partitions: 570,000 QPS
Console state — the teststream tunnel contains 64 partitions. All partitions are of the Incremental type and are in the Open state, the consumption count of each partition is approximately 1,228,941 to 1,231,572 records, and the latest synchronization times are around 2019-01-31 22:32.
Test time — 2019-01-31 22:10.
QPS — stable rate of approximately 570,000 rows/sec; peak rate of 581,400 rows/sec.
Avg latency — approximately 1.75 ms/1,000 rows.
CPU — approximately 6.4 cores (640% of a single core).
Mem — approximately 5.376 GB (8.4% of the 64 GB physical memory).
Bandwidth — approximately 125 MBps consumed by incremental data, which reaches the rate limit of the 1-gigabit NIC.
{"timestamp":1548943781849,"speed":536200,"totalCount":2688000}
{"timestamp":1548943791852,"speed":578800,"totalCount":8442000}
{"timestamp":1548943811860,"speed":581400,"totalCount":20020000}
{"timestamp":1548943826866,"speed":555000,"totalCount":28432000}
{"timestamp":1548943856879,"speed":560600,"totalCount":45377000}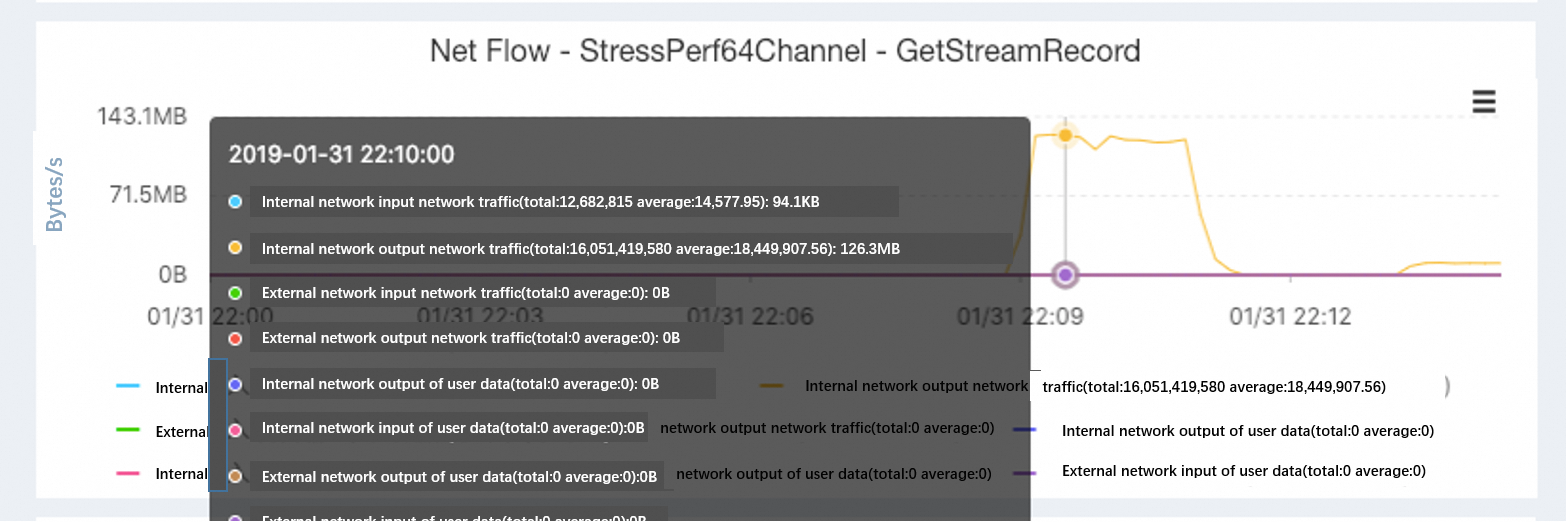
Bandwidth monitoring for the single machine, 64 partitions scenario.
Two machines, 64 partitions: 780,000 QPS
Console state — the partition list of the teststream2 tunnel shows 64 partitions that are consumed by two clients whose ID prefixes are Linux-6c74d- and Linux-37197-. The consumption count of each partition is approximately 1.22 million to 1.23 million records, and all partitions are of the Incremental type and in the Open state.
Test time — 2019-01-31 22:30.
QPS — stable rate of approximately 390,000 rows/sec on each machine, for a total stable rate of approximately 780,000 rows/sec.
Avg latency — 1.28 ms/1,000 rows.
CPU — approximately 4.2 cores (420% of a single core) on each machine, for a total of approximately 8.4 cores (840%).
Mem — approximately 8.2% of the physical memory on each machine, for a total of 16.4% (10.5 GB).
Bandwidth — approximately 169 MBps consumed by incremental data in total. Compared with the single-machine, 64-partition scenario, this result shows that the network of a single machine had become the bottleneck.
{"timestamp":1548945217504,"speed":380200,"totalCount":1902000}
{"timestamp":1548945227509,"speed":392800,"totalCount":5828000}
{"timestamp":1548945242518,"speed":392800,"totalCount":11704000}
{"timestamp":1548945272532,"speed":388600,"totalCount":23284000}
{"timestamp":1548945287546,"speed":392200,"totalCount":29111000}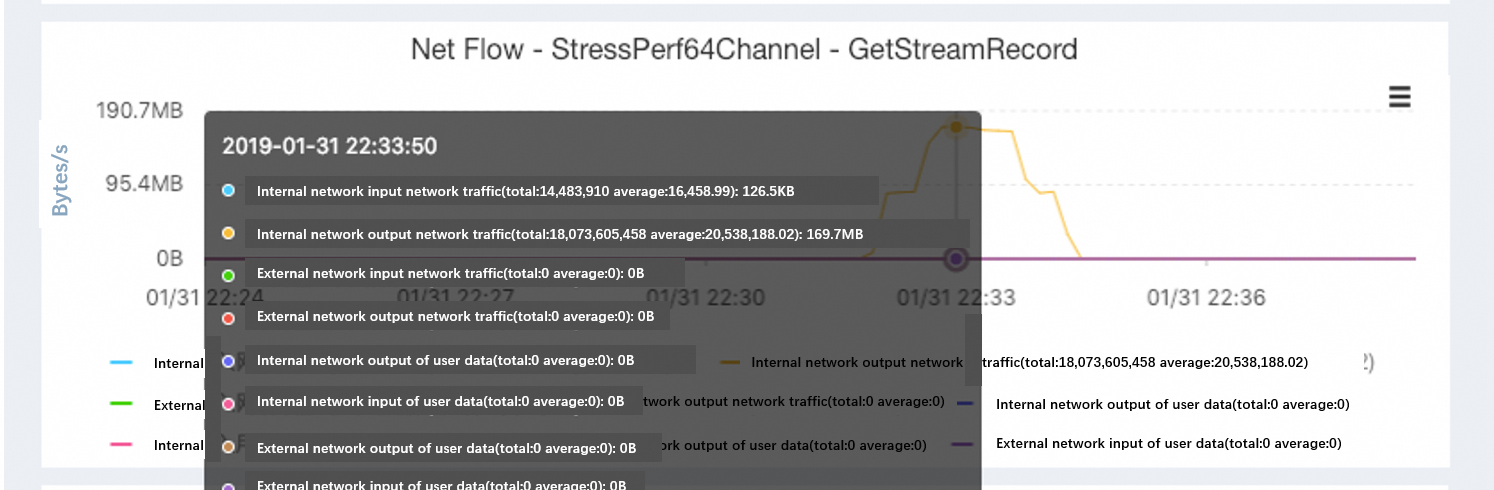
Bandwidth monitoring for the two machines, 64 partitions scenario.
Two machines, 128 partitions: 1 million QPS
Console state — the teststream2 tunnel is of the Incremental type. All partitions in the tunnel partition list are in the Open state, the consumption count of each partition reaches hundreds of thousands of records, and the incremental synchronization times are concentrated between 2019-01-31 23:22 and 23:23.
Test time — 2019-01-31 23:20.
QPS — stable rate of approximately 500,000 rows/sec on each machine, for a total stable rate of approximately 1 million rows/sec.
Avg latency — approximately 1 ms/1,000 rows.
CPU — approximately 10.2 cores (1020% of a single core) in total on the two machines.
Mem — approximately 8.2% of the physical memory on each machine, for a total of 16.4% (10.5 GB).
Bandwidth — approximately 220 MBps consumed by incremental data in total. The NICs of both 1-gigabit machines are nearly saturated.
View the rate log as follows:
$ tail -f perf_128channel_2machine.txt{"timestamp":1548948013375,"speed":492400,"totalCount":27363000}
{"timestamp":1548948028387,"speed":504400,"totalCount":34883000}
{"timestamp":1548948058397,"speed":519600,"totalCount":50089000}
{"timestamp":1548948068399,"speed":519600,"totalCount":55281000}
{"timestamp":1548948073401,"speed":503800,"totalCount":57800000}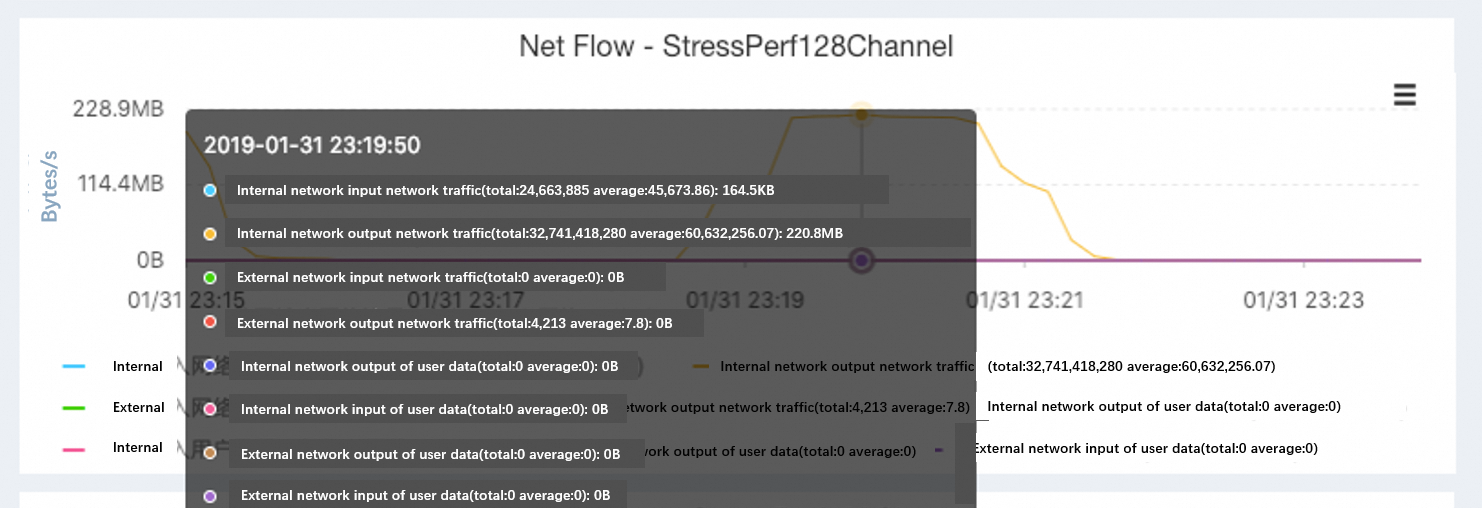
Bandwidth monitoring for the two machines, 128 partitions scenario.
Summary
Incremental synchronization in Tunnel Service scales in two directions within the tested range:
Small number of partitions — with a single partition, or with a small number of partitions, the client consumes minimal CPU, memory, and bandwidth, so client resources do not limit the synchronization rate. Server-side latency such as disk reads is the presumed limit in these scenarios; this benchmark does not measure server-side metrics and therefore does not verify that attribution.
More partitions — as the number of partitions grows, the overall throughput of incremental synchronization in Tunnel Service grows until the system reaches a bottleneck, which in this benchmark is network bandwidth on the client.
More machines — when the resources of a single machine are saturated, you can add machines to further increase the total throughput of the system, which confirms that Tunnel Service scales horizontally.
These conclusions hold within the conditions stated in the Benchmark scope section: the client hardware of the test period, a row size of approximately 220 bytes, and measurements taken on January 30 and January 31, 2019.