
本方案通过yet-another-cloudwatch-exporter(简称yace-exporter)将AWS CloudWatch指标接入可观测监控 Prometheus 版,实现跨云监控。
前提条件
方案

数据采集:yace-exporter通过 AWS OpenAPI 定期拉取 CloudWatch 的指标数据(如 EC2 的 CPU 利用率、磁盘 I/O 等)。
格式转换:yace-exporter将 AWS 的指标数据格式转换为 Prometheus 标准的
metrics格式。暴露端点:通过配置的 HTTP 端口(默认
5000)提供/metrics接口,供阿里云 Prometheus 服务器(通过服务发现机制)拉取数据。
操作步骤
步骤1:在 ACK 的集群中部署 yace-exporter
yace-exporter是社区开发的Cloudwatch Metric Exporter,性能好,成本低。
1.1 下载并修改配置values.yaml
修改说明:
# 配置Prometheus Scrape 路径和端口
podAnnotations: {
  prometheus.io/path: /metrics,
  prometheus.io/port: "5000",
  prometheus.io/scrape: "true"
}

# 配置 AWS 的认证方式,自行选择1个,推荐 ak/sk 方式
aws:
  role:

  # The name of a pre-created secret in which AWS credentials are stored. When
  # set, aws_access_key_id is assumed to be in a field called access_key,
  # aws_secret_access_key is assumed to be in a field called secret_key, and the
  # session token, if it exists, is assumed to be in a field called
  # security_token
  secret:
    name:
    includesSessionToken: false

  # Note: Do not specify the aws_access_key_id and aws_secret_access_key if you specified role or secret.name before
  aws_access_key_id:
  aws_secret_access_key:

#采集 CloudWatch 的指标配置,请您按需配置,只需配置用到的产品和指标及统计算子,AWS CloudWatch 会按请求的指标个数计费
config: |-
  apiVersion: v1alpha1
  sts-region: us-west-1 # AWS 认证地域建议和云产品的地域保持一致
  discovery:
    jobs:
    - type: AWS/EC2  # 支持的产品命名空间,参考这个文档 https://github.com/prometheus-community/yet-another-cloudwatch-exporter
      regions:
        - us-west-1 # 云产品所在地域
      searchTags:  # 配置采集哪些tag的云产品实例写入Prometheus
        - key: scrapedEnable
          value: ^(ali)$
      metrics: # 配置需要采集的指标列表,CloudWatch 每个云产品支持哪些指标,参考这个文档 https://docs.aws.amazon.com/AmazonCloudWatch/latest/monitoring/aws-services-cloudwatch-metrics.html。下面以采集EC2的几个指标为例,其他产品配置类似
        - name: CPUUtilization
          statistics:   # statistics 聚合统计方法,AWS 文档也有列出,Average:平均值,Minimum:最小值 ,Maximum:最大值,Sum:求和
          - Average
          - Minimum
          - Maximum
          period: 60
          length: 600
        - name: DiskReadOps
          statistics:
          - Sum
          - Average
          - Minimum
          - Maximum
          period: 60
          length: 600
        - name: DiskWriteOps
          statistics:
          - Sum
          - Average
          - Minimum
          - Maximum
          period: 60
          length: 600
        - name: DiskReadBytes
          statistics:
          - Sum
          - Average
          - Minimum
          - Maximum
          period: 60
          length: 600
1.2 安装 Helm 应用
helm install -f values.yaml yace-exporter-cw ./prometheus-yet-another-cloudwatch-exporter-0.40.0.tgz -n aws-cloudwatch或者在线拉镜像安装:
helm repo add prometheus-community https://prometheus-community.github.io/helm-charts
helm repo update
helm install -f values.yaml yane-exporter-cw prometheus-community/prometheus-yet-another-cloudwatch-exporter -n aws-cloudwatch步骤2:在可观测监控 Prometheus 版中自动采集
登录ARMS控制台,在左侧导航栏单击接入管理。
在上方区域选择ACK集群所在地域,然后在容器环境页签中找到并单击目标环境名称。
单击指标采集页签,然后在默认服务发现页面中,单击右侧功能启用。

启用后系统会默认采集 yace-exporter 的指标。
单击自监控页签,查看采集任务。
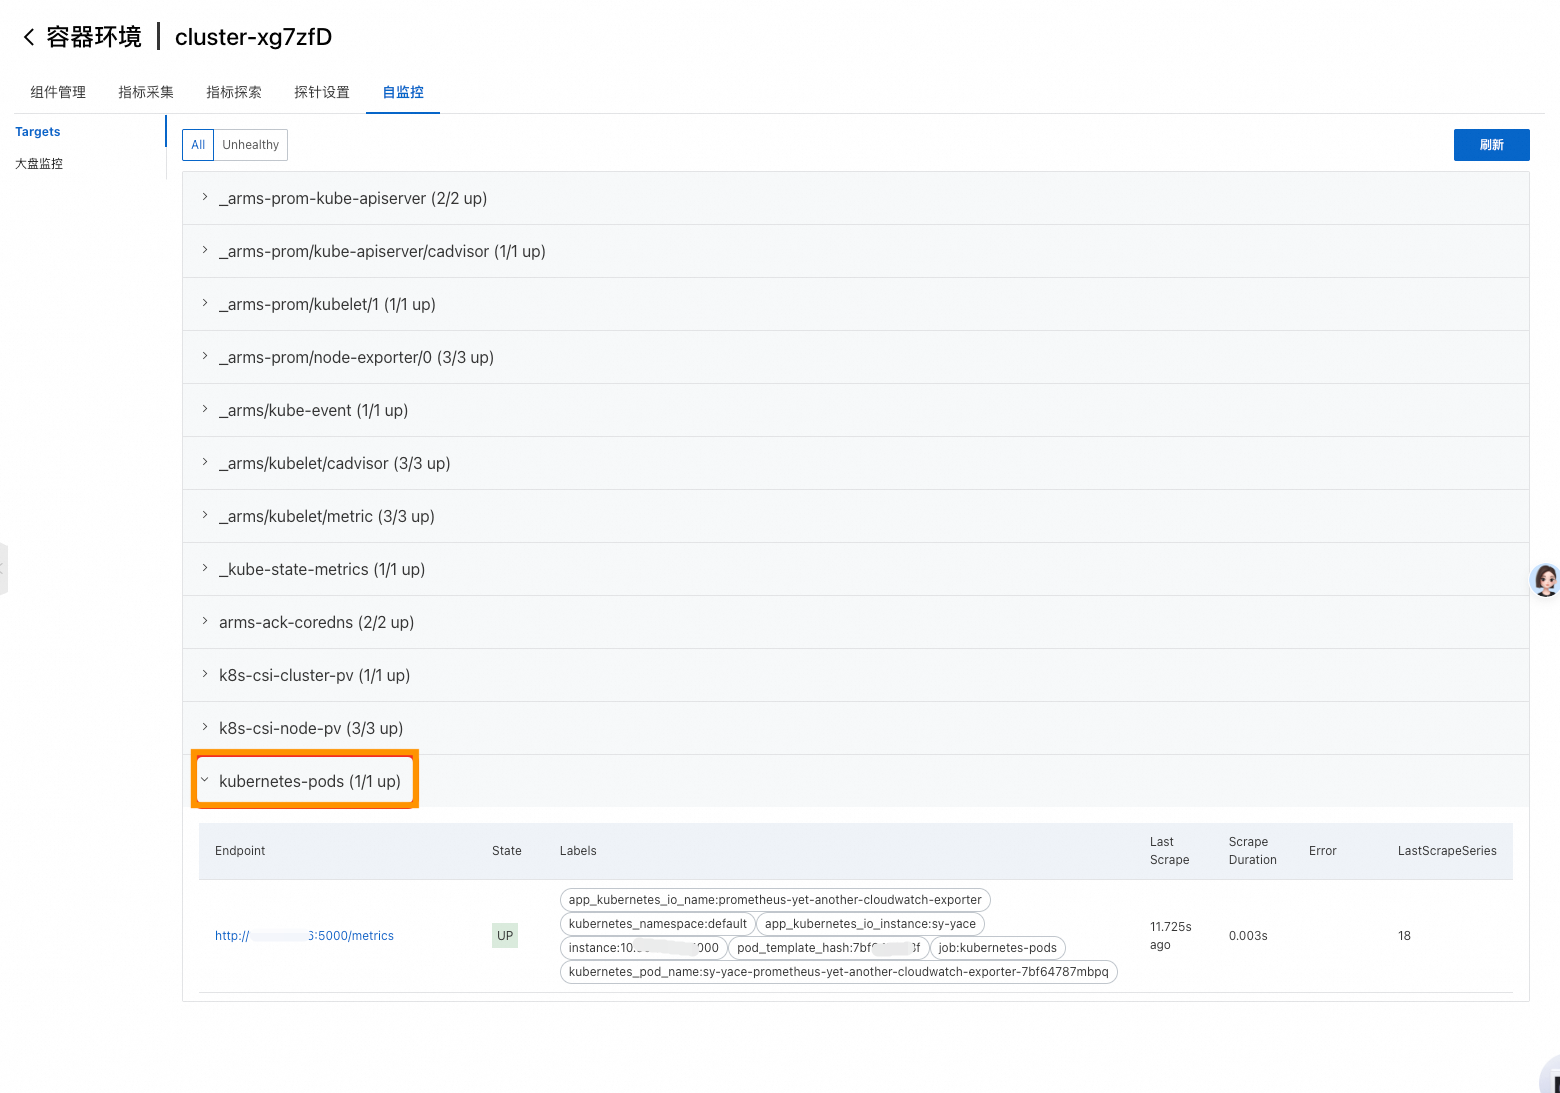
系统会自动创建一个名称为
kubernetes-pods的采集任务,状态为up表示配置采集成功。
步骤3:查看采集指标,配置大盘和告警
采集任务配置成功后,可以在指标探索中查询是否有aws_开头指标,来验证指标是否已经采集到可观测监控 Prometheus 版中。
配置大盘和告警,请参考云服务可观测中的步骤三和步骤四。
该文章对您有帮助吗?