
服务网格 ASM(Service Mesh)支持无侵入式熔断、限流及流量监控。本文介绍熔断和限流常用的大盘配置及告警规则。
熔断降级
流量熔断是一种过载保护机制,主要用于防止系统因为短时间内过大的流量而崩溃。在云原生服务之间存在东西向调用流量的情况下,如果某个服务发生故障(例如:响应过慢或者失败率升高),可能会导致该服务所在调用链路上的一系列服务也发生连锁崩溃。
通过为服务间的东西向调用流量配置熔断规则,可以实现当请求失败率或响应超时次数达到阈值时,主动“切断”来自上游服务的请求。在保护上游服务的同时,也有效防止故障在整个调用链路中扩散,造成整个系统雪崩。
配置熔断规则后,每个网格代理将基于其代理的请求分别计算请求失败率或响应超时次数。因此,对于同一个发生故障的上游服务、客户端网格代理发生熔断的时机可能略有不同。
大盘示例
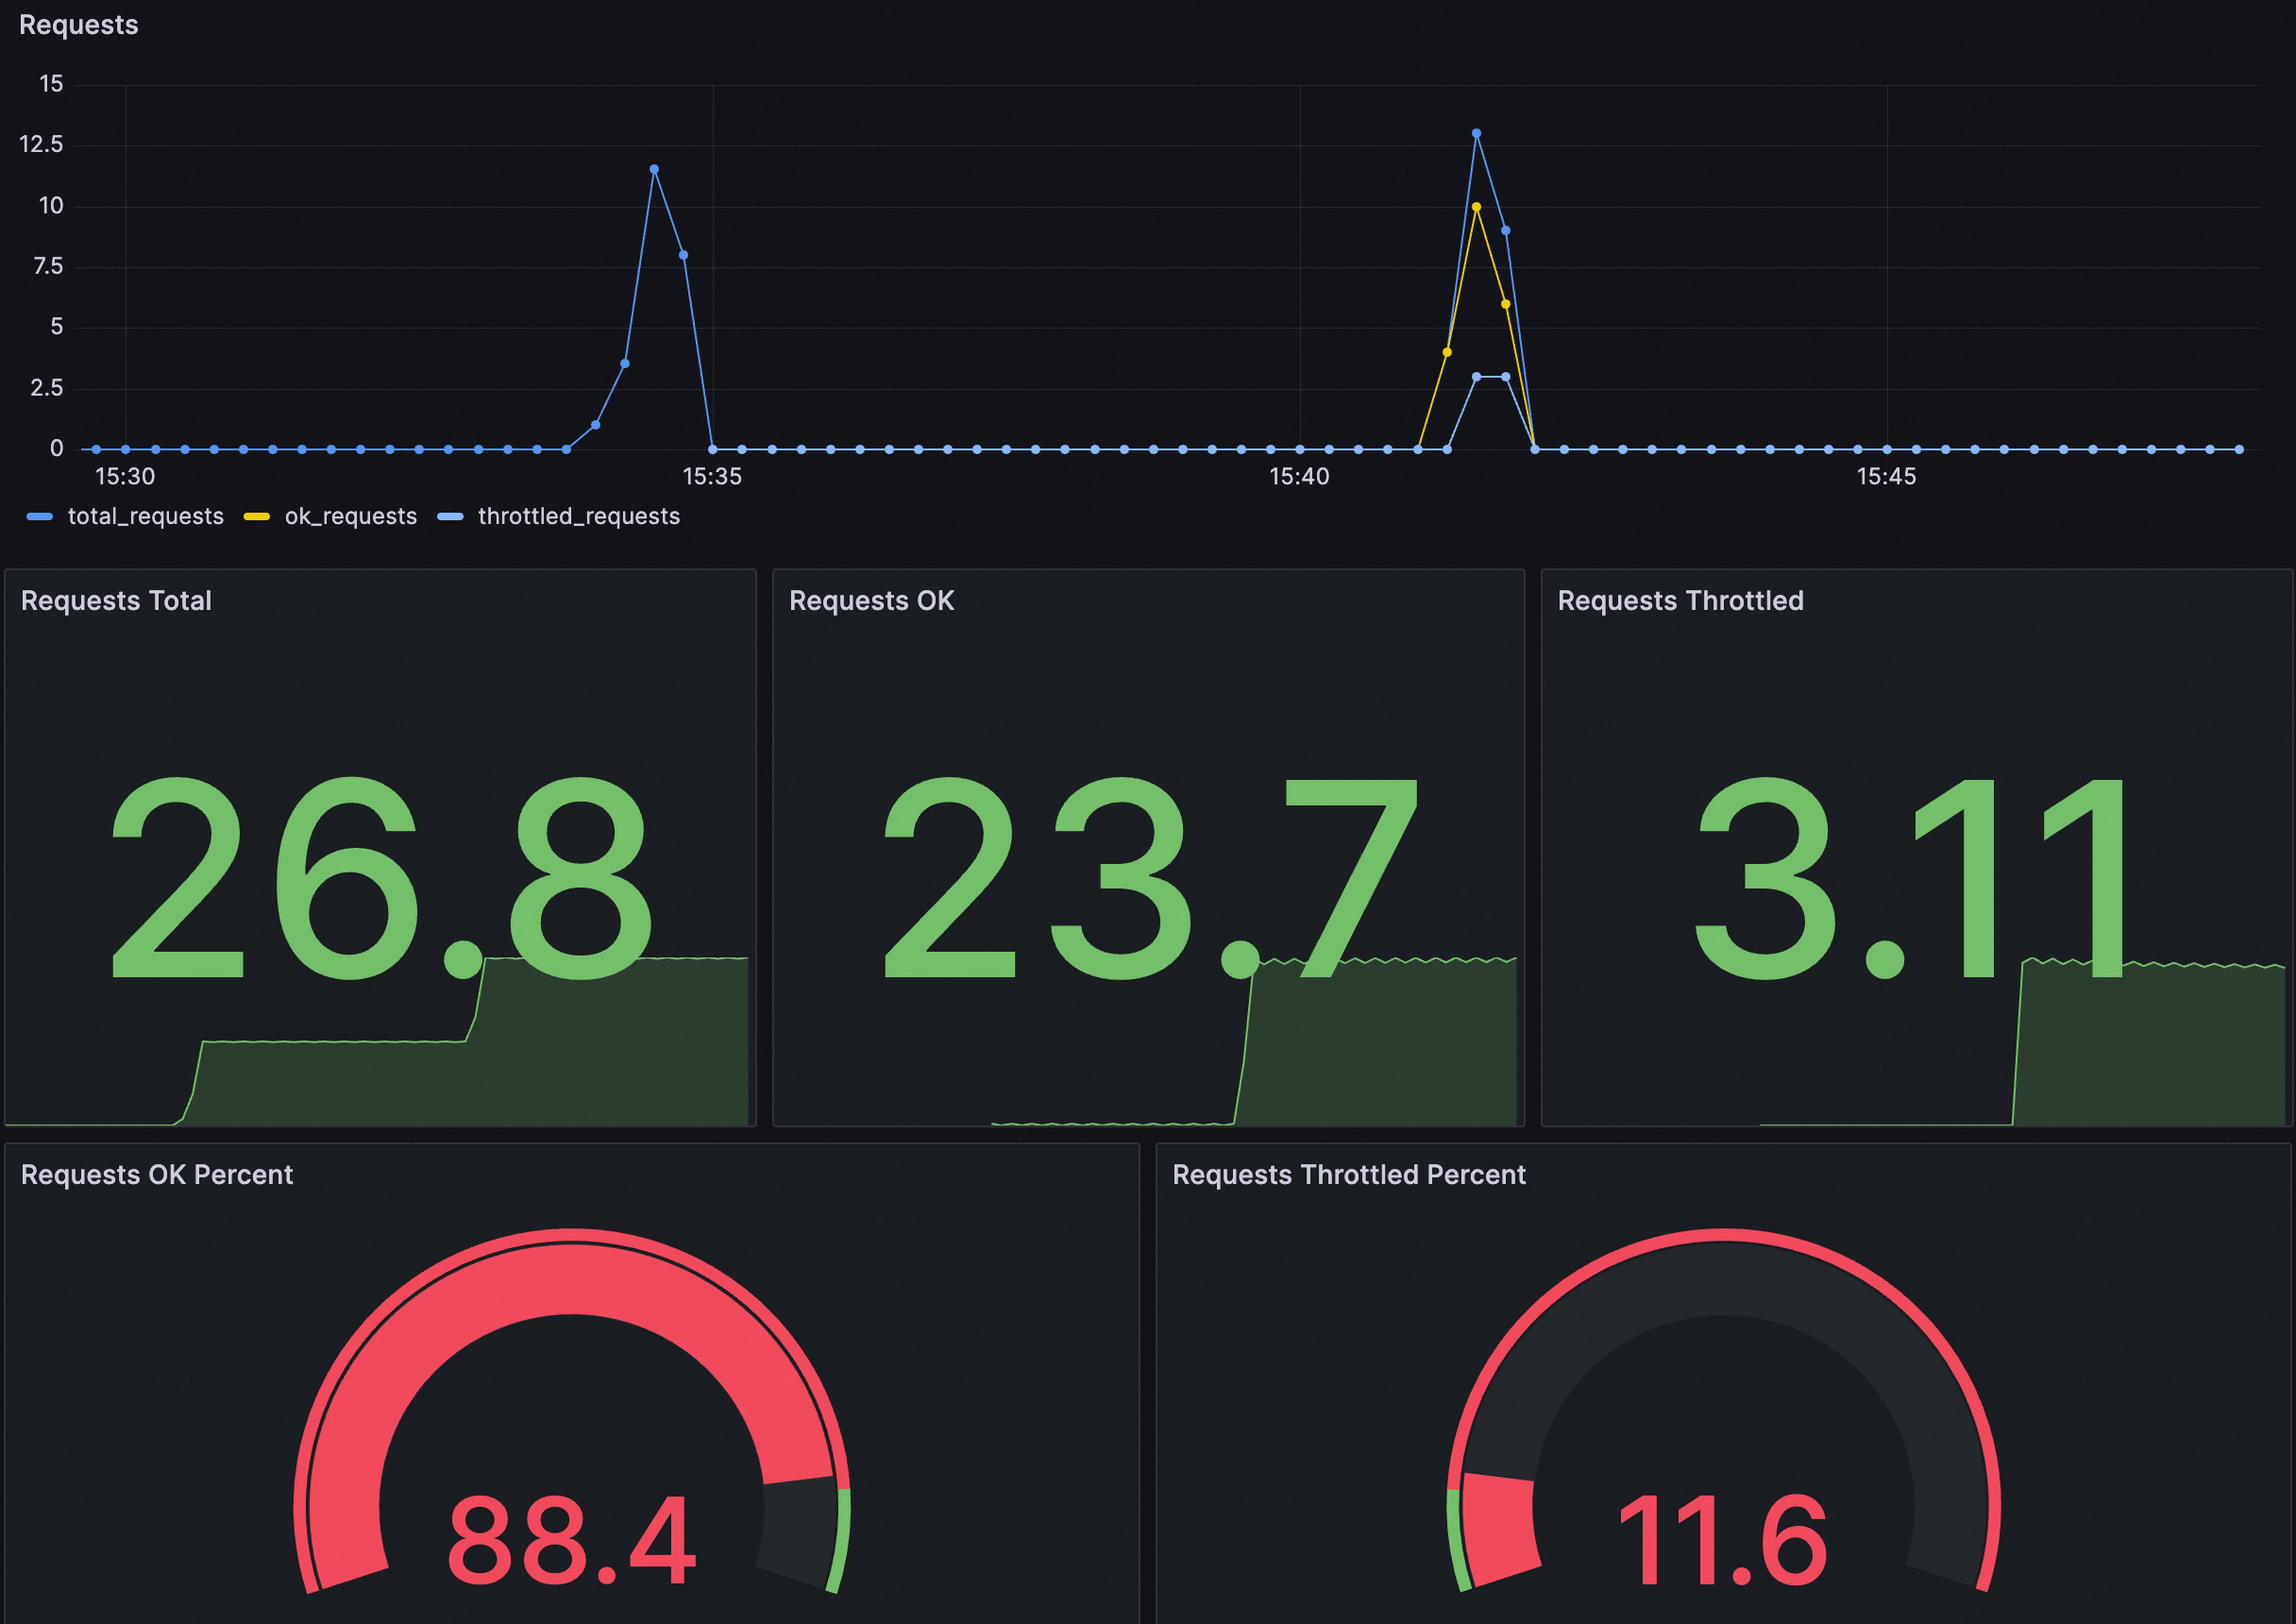
对应每个面板说明如下:
面板(Panels) | 说明 |
Requests | 请求总体情况,包含以下指标:
|
Requests OK Percent | 请求成功的总数占总请求数的比例。 |
Requests Throttled Percent | 触发熔断的请求占总请求数的比例。 |
您可以将以下JSON导入到Grafana大盘,为集群创建熔断大盘。您也可以修改或根据以下JSON内容自定义创建大盘。
展开查看JSON内容
{
"annotations": {
"list": [
{
"builtIn": 1,
"datasource": {
"type": "grafana",
"uid": "-- Grafana --"
},
"enable": true,
"hide": true,
"iconColor": "rgba(0, 211, 255, 1)",
"name": "Annotations & Alerts",
"type": "dashboard"
}
]
},
"editable": true,
"fiscalYearStartMonth": 0,
"graphTooltip": 0,
"id": 168,
"links": [],
"liveNow": false,
"panels": [
{
"datasource": {
"type": "prometheus",
"uid": "${DS_PROMETHEUS}"
},
"fieldConfig": {
"defaults": {
"color": {
"mode": "palette-classic"
},
"custom": {
"axisCenteredZero": false,
"axisColorMode": "text",
"axisLabel": "",
"axisPlacement": "auto",
"barAlignment": 0,
"drawStyle": "line",
"fillOpacity": 0,
"gradientMode": "none",
"hideFrom": {
"legend": false,
"tooltip": false,
"viz": false
},
"lineInterpolation": "linear",
"lineWidth": 1,
"pointSize": 5,
"scaleDistribution": {
"type": "linear"
},
"showPoints": "auto",
"stacking": {
"group": "A",
"mode": "none"
}
},
"mappings": [],
"thresholds": {
"mode": "absolute",
"steps": [
{
"color": "green",
"value": null
}
]
}
},
"overrides": [
{
"matcher": {
"id": "byName",
"options": "total_requests"
},
"properties": [
{
"id": "color",
"value": {
"fixedColor": "blue",
"mode": "fixed"
}
}
]
},
{
"matcher": {
"id": "byName",
"options": "unlimited_requests"
},
"properties": [
{
"id": "color",
"value": {
"fixedColor": "dark-green",
"mode": "fixed"
}
}
]
},
{
"matcher": {
"id": "byName",
"options": "limited_requests"
},
"properties": [
{
"id": "color",
"value": {
"fixedColor": "dark-red",
"mode": "fixed"
}
}
]
}
]
},
"gridPos": {
"h": 8,
"w": 12,
"x": 0,
"y": 0
},
"id": 1,
"options": {
"legend": {
"calcs": [],
"displayMode": "list",
"placement": "bottom",
"showLegend": true
},
"tooltip": {
"mode": "single",
"sort": "none",
"targets": []
}
},
"pluginVersion": "10.0.9",
"targets": [
{
"datasource": {
"type": "prometheus",
"uid": "${DS_PROMETHEUS}"
},
"editorMode": "code",
"exemplar": false,
"expr": "sum(rate(istio_requests_total{namespace=~\"$namespace\",pod_name=~\"$pod\",service_istio_io_canonical_name=~\"$service\"}[60s])) * 30",
"format": "time_series",
"instant": false,
"legendFormat": "total_requests",
"range": true,
"refId": "A"
},
{
"datasource": {
"type": "prometheus",
"uid": "${DS_PROMETHEUS}"
},
"editorMode": "code",
"exemplar": false,
"expr": "sum(rate(istio_requests_total{namespace=~\"$namespace\",pod_name=~\"$pod\",service_istio_io_canonical_name=~\"$service\"}[60s])) * 30 - sum(rate(envoy_asm_circuit_breaker_total_broken_requests{namespace=~\"$namespace\",pod_name=~\"$pod\",cluster=~\".*$service.*\"}[60s])) * 30",
"format": "time_series",
"hide": false,
"instant": false,
"legendFormat": "ok_requests",
"range": true,
"refId": "B"
},
{
"datasource": {
"type": "prometheus",
"uid": "${DS_PROMETHEUS}"
},
"editorMode": "code",
"expr": "sum(rate(envoy_asm_circuit_breaker_total_broken_requests{namespace=~\"$namespace\",pod_name=~\"$pod\",cluster=~\".*$service.*\"}[60s])) * 30",
"hide": false,
"instant": false,
"legendFormat": "throttled_requests",
"range": true,
"refId": "C"
}
],
"title": "Requests",
"transparent": true,
"type": "aliyun-timeseries-panel"
},
{
"datasource": {
"type": "prometheus",
"uid": "${DS_PROMETHEUS}"
},
"fieldConfig": {
"defaults": {
"color": {
"mode": "thresholds"
},
"mappings": [],
"thresholds": {
"mode": "absolute",
"steps": [
{
"color": "green",
"value": null
}
]
}
},
"overrides": []
},
"gridPos": {
"h": 8,
"w": 4,
"x": 0,
"y": 8
},
"id": 2,
"options": {
"colorMode": "value",
"graphMode": "area",
"justifyMode": "auto",
"orientation": "auto",
"reduceOptions": {
"calcs": [
"lastNotNull"
],
"fields": "",
"values": false
},
"textMode": "auto"
},
"pluginVersion": "10.0.9",
"targets": [
{
"datasource": {
"type": "prometheus",
"uid": "${DS_PROMETHEUS}"
},
"editorMode": "code",
"expr": "sum(increase(istio_requests_total{namespace=~\"$namespace\",pod_name=~\"$pod\",service_istio_io_canonical_name=~\"$service\"}[$__range]))",
"instant": false,
"range": true,
"refId": "A"
}
],
"title": "Requests Total",
"type": "stat"
},
{
"datasource": {
"type": "prometheus",
"uid": "${DS_PROMETHEUS}"
},
"fieldConfig": {
"defaults": {
"color": {
"mode": "thresholds"
},
"mappings": [],
"thresholds": {
"mode": "absolute",
"steps": [
{
"color": "green",
"value": null
}
]
}
},
"overrides": []
},
"gridPos": {
"h": 8,
"w": 4,
"x": 4,
"y": 8
},
"id": 5,
"options": {
"colorMode": "value",
"graphMode": "area",
"justifyMode": "auto",
"orientation": "auto",
"reduceOptions": {
"calcs": [
"lastNotNull"
],
"fields": "",
"values": false
},
"textMode": "auto"
},
"pluginVersion": "10.0.9",
"targets": [
{
"datasource": {
"type": "prometheus",
"uid": "${DS_PROMETHEUS}"
},
"editorMode": "code",
"expr": "sum(increase(istio_requests_total{namespace=~\"$namespace\",pod_name=~\"$pod\",service_istio_io_canonical_name=~\"$service\"}[$__range])) - sum(increase(envoy_asm_circuit_breaker_total_broken_requests{namespace=~\"$namespace\",pod_name=~\"$pod\",cluster=~\".*$service.*\"}[$__range]))",
"instant": false,
"range": true,
"refId": "A"
}
],
"title": "Requests OK",
"type": "stat"
},
{
"datasource": {
"type": "prometheus",
"uid": "${DS_PROMETHEUS}"
},
"fieldConfig": {
"defaults": {
"color": {
"mode": "thresholds"
},
"mappings": [],
"thresholds": {
"mode": "absolute",
"steps": [
{
"color": "green",
"value": null
}
]
}
},
"overrides": []
},
"gridPos": {
"h": 8,
"w": 4,
"x": 8,
"y": 8
},
"id": 4,
"options": {
"colorMode": "value",
"graphMode": "area",
"justifyMode": "auto",
"orientation": "auto",
"reduceOptions": {
"calcs": [
"lastNotNull"
],
"fields": "",
"values": false
},
"textMode": "auto"
},
"pluginVersion": "10.0.9",
"targets": [
{
"datasource": {
"type": "prometheus",
"uid": "${DS_PROMETHEUS}"
},
"editorMode": "code",
"expr": "sum(increase(envoy_asm_circuit_breaker_total_broken_requests{namespace=~\"$namespace\",pod_name=~\"$pod\",cluster=~\".*$service.*\"}[$__range]))",
"instant": false,
"range": true,
"refId": "A"
}
],
"title": "Requests Throttled",
"type": "stat"
},
{
"datasource": {
"type": "prometheus",
"uid": "${DS_PROMETHEUS}"
},
"fieldConfig": {
"defaults": {
"color": {
"mode": "thresholds"
},
"custom": {
"neutral": -1
},
"mappings": [],
"max": 100,
"min": 0,
"thresholds": {
"mode": "percentage",
"steps": [
{
"color": "red",
"value": null
},
{
"color": "green",
"value": 90
}
]
}
},
"overrides": []
},
"gridPos": {
"h": 7,
"w": 6,
"x": 0,
"y": 16
},
"id": 6,
"options": {
"orientation": "auto",
"reduceOptions": {
"calcs": [
"lastNotNull"
],
"fields": "",
"values": false
},
"showThresholdLabels": false,
"showThresholdMarkers": true
},
"pluginVersion": "10.0.9",
"targets": [
{
"datasource": {
"type": "prometheus",
"uid": "${DS_PROMETHEUS}"
},
"editorMode": "code",
"expr": "(sum(increase(istio_requests_total{namespace=~\"$namespace\",pod_name=~\"$pod\",service_istio_io_canonical_name=~\"$service\"}[$__range])) - sum(increase(envoy_asm_circuit_breaker_total_broken_requests{namespace=~\"$namespace\",pod_name=~\"$pod\",cluster=~\".*$service.*\"}[$__range]))) / sum(increase(istio_requests_total{namespace=~\"$namespace\",pod_name=~\"$pod\",service_istio_io_canonical_name=~\"$service\"}[$__range])) * 100",
"instant": false,
"range": true,
"refId": "A"
}
],
"title": "Requests OK Percent",
"type": "gauge"
},
{
"datasource": {
"type": "prometheus",
"uid": "${DS_PROMETHEUS}"
},
"fieldConfig": {
"defaults": {
"color": {
"mode": "thresholds"
},
"custom": {
"neutral": -1
},
"mappings": [],
"max": 100,
"min": 0,
"thresholds": {
"mode": "percentage",
"steps": [
{
"color": "green",
"value": null
},
{
"color": "red",
"value": 10
}
]
}
},
"overrides": []
},
"gridPos": {
"h": 7,
"w": 6,
"x": 6,
"y": 16
},
"id": 7,
"options": {
"orientation": "auto",
"reduceOptions": {
"calcs": [
"lastNotNull"
],
"fields": "",
"values": false
},
"showThresholdLabels": false,
"showThresholdMarkers": true
},
"pluginVersion": "10.0.9",
"targets": [
{
"datasource": {
"type": "prometheus",
"uid": "${DS_PROMETHEUS}"
},
"editorMode": "code",
"expr": "sum(increase(envoy_asm_circuit_breaker_total_broken_requests{namespace=~\"$namespace\",pod_name=~\"$pod\",cluster=~\".*$service.*\"}[$__range])) / sum(increase(istio_requests_total{namespace=~\"$namespace\",pod_name=~\"$pod\",service_istio_io_canonical_name=~\"$service\"}[$__range])) * 100",
"instant": false,
"range": true,
"refId": "A"
}
],
"title": "Requests Throttled Percent",
"type": "gauge"
}
],
"refresh": false,
"schemaVersion": 38,
"style": "dark",
"tags": [],
"templating": {
"list": [
{
"current": {
"selected": false,
"text": "datesource",
"value": "datesource"
},
"hide": 0,
"includeAll": false,
"label": "datasource",
"multi": false,
"name": "DS_PROMETHEUS",
"options": [],
"query": "prometheus",
"queryValue": "datesource",
"refresh": 1,
"regex": "",
"skipUrlSync": false,
"type": "datasource"
},
{
"allValue": ".*",
"current": {
"selected": false,
"text": "All",
"value": "$__all"
},
"datasource": {
"type": "prometheus",
"uid": "ykIxRIhNk"
},
"definition": "query_result(sum(envoy_asm_circuit_breaker_total_broken_requests) by (namespace))",
"hide": 0,
"includeAll": true,
"label": "namespace",
"multi": false,
"name": "namespace",
"options": [],
"query": {
"query": "query_result(sum(envoy_asm_circuit_breaker_total_broken_requests) by (namespace))",
"refId": "PrometheusVariableQueryEditor-VariableQuery"
},
"refresh": 1,
"regex": "/.*namespace=\"(.*)\".*/",
"skipUrlSync": false,
"sort": 0,
"type": "query"
},
{
"allValue": ".*",
"current": {
"selected": false,
"text": "All",
"value": "$__all"
},
"datasource": {
"type": "prometheus",
"uid": "ykIxRIhNk"
},
"definition": "query_result(sum(envoy_asm_circuit_breaker_total_broken_requests) by (pod_name))",
"description": "",
"hide": 0,
"includeAll": true,
"label": "pod",
"multi": false,
"name": "pod",
"options": [],
"query": {
"query": "query_result(sum(envoy_asm_circuit_breaker_total_broken_requests) by (pod_name))",
"refId": "PrometheusVariableQueryEditor-VariableQuery"
},
"refresh": 1,
"regex": "/.*pod_name=\"(.*)\".*/",
"skipUrlSync": false,
"sort": 0,
"type": "query"
},
{
"allValue": ".*",
"current": {
"selected": false,
"text": "All",
"value": "$__all"
},
"datasource": {
"type": "prometheus",
"uid": "ykIxRIhNk"
},
"definition": "query_result(sum(envoy_asm_circuit_breaker_total_broken_requests) by (cluster))",
"hide": 0,
"includeAll": true,
"multi": false,
"name": "service",
"options": [],
"query": {
"query": "query_result(sum(envoy_asm_circuit_breaker_total_broken_requests) by (cluster))",
"refId": "PrometheusVariableQueryEditor-VariableQuery"
},
"refresh": 1,
"regex": "/.*_.*_.*_(.*)\".*/",
"skipUrlSync": false,
"sort": 0,
"type": "query"
}
]
},
"time": {
"from": "2025-03-19T07:40:00.388Z",
"to": "2025-03-19T07:43:09.493Z"
},
"timepicker": {},
"timezone": "browser",
"title": "Circuit Breaker",
"uid": "5d5bcd97-33a9-499f-94f6-aea7081b9777",
"version": 5,
"weekStart": ""
}告警规则示例
告警配置 | 示例 | 说明 |
自定义PromQL语句 | (sum by(cluster, namespace) (increase(envoy_asm_circuit_breaker_total_broken_requests[1m]))) > 10 | 查询最近1分钟之内熔断的请求数量,并根据触发熔断的服务所在命名空间以及服务名称进行分组。当1分钟内被熔断的请求数量大于10时触发告警。 |
告警内容 | 发生服务级熔断!命名空间:{{$labels.namespace}},发生熔断的目标服务:{{$labels.cluster}}。当前1分钟内熔断的请求数量:{{ $value }} | 展示了触发熔断的服务所在命名空间以及服务名称,以及最近1分钟内发往该服务被熔断的请求数量的告警信息格式。 |
全局限流防护
在Envoy代理中,全局限流是一种用于控制整个服务网格中请求速率的机制。它基于Envoy的限流服务(Rate Limit Service)实现。该服务可以集中处理来自整个服务网格中的流量,并根据预先定义的规则和配额来限制请求的速率。
全局限流可以与本地限流结合使用,以提供不同层面的限流功能。
大盘示例
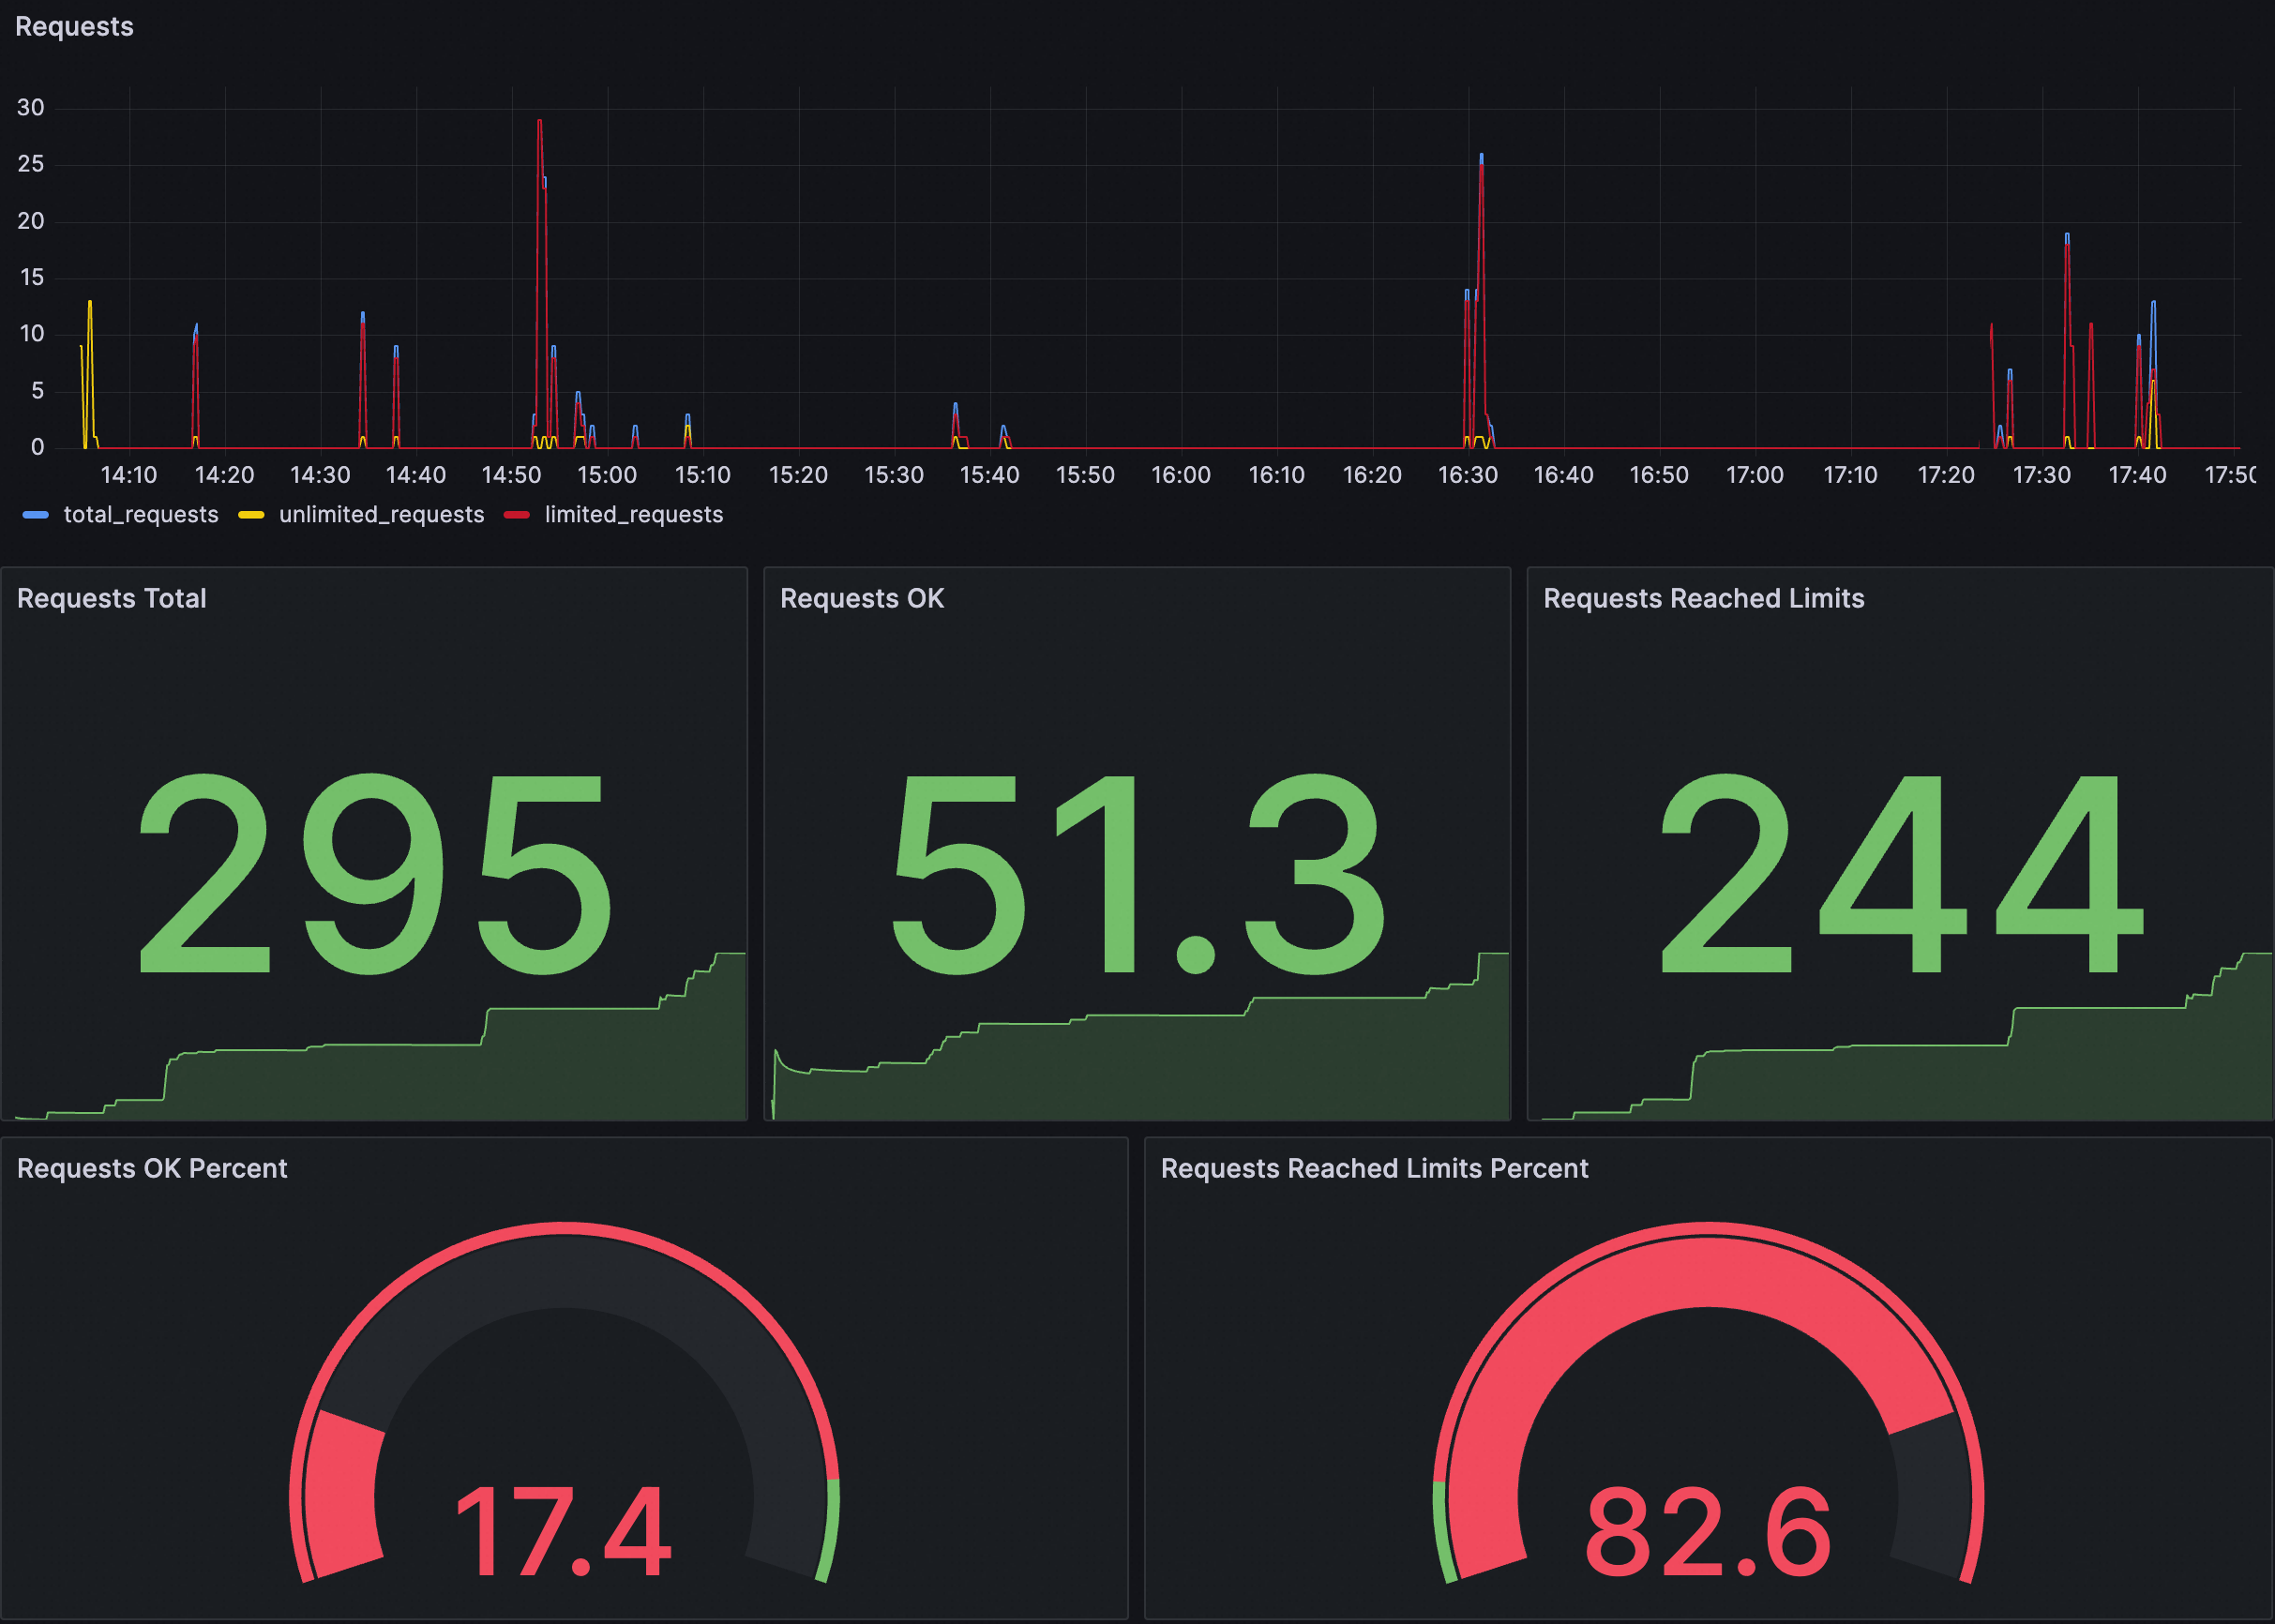
对应每个面板说明如下:
面板(Panels) | 说明 |
Requests | 请求总体情况,包含以下指标:
|
Requests OK Percent | 请求成功的总数占总请求数的比例。 |
Requests Reached Limits Percent | 触发限流的请求占总请求数的比例。 |
您可以将以下JSON导入到Grafana大盘,为集群创建全局限流大盘。您也可以修改或根据以下JSON内容自定义创建大盘。
展开查看JSON内容
{
"annotations": {
"list": [
{
"builtIn": 1,
"datasource": {
"type": "grafana",
"uid": "-- Grafana --"
},
"enable": true,
"hide": true,
"iconColor": "rgba(0, 211, 255, 1)",
"name": "Annotations & Alerts",
"type": "dashboard"
}
]
},
"editable": true,
"fiscalYearStartMonth": 0,
"graphTooltip": 0,
"id": 166,
"links": [],
"liveNow": false,
"panels": [
{
"datasource": {
"type": "prometheus",
"uid": "${DS_PROMETHEUS}"
},
"fieldConfig": {
"defaults": {
"color": {
"mode": "palette-classic"
},
"custom": {
"axisCenteredZero": false,
"axisColorMode": "text",
"axisLabel": "",
"axisPlacement": "auto",
"barAlignment": 0,
"drawStyle": "line",
"fillOpacity": 0,
"gradientMode": "none",
"hideFrom": {
"legend": false,
"tooltip": false,
"viz": false
},
"lineInterpolation": "linear",
"lineWidth": 1,
"pointSize": 5,
"scaleDistribution": {
"type": "linear"
},
"showPoints": "auto",
"stacking": {
"group": "A",
"mode": "none"
}
},
"mappings": [],
"thresholds": {
"mode": "absolute",
"steps": [
{
"color": "green",
"value": null
}
]
}
},
"overrides": [
{
"matcher": {
"id": "byName",
"options": "total_requests"
},
"properties": [
{
"id": "color",
"value": {
"fixedColor": "blue",
"mode": "fixed"
}
}
]
},
{
"matcher": {
"id": "byName",
"options": "unlimited_requests"
},
"properties": [
{
"id": "color",
"value": {
"fixedColor": "dark-green",
"mode": "fixed"
}
}
]
},
{
"matcher": {
"id": "byName",
"options": "limited_requests"
},
"properties": [
{
"id": "color",
"value": {
"fixedColor": "dark-red",
"mode": "fixed"
}
}
]
}
]
},
"gridPos": {
"h": 8,
"w": 12,
"x": 0,
"y": 0
},
"id": 1,
"options": {
"legend": {
"calcs": [],
"displayMode": "list",
"placement": "bottom",
"showLegend": true
},
"tooltip": {
"mode": "single",
"sort": "none",
"targets": []
}
},
"pluginVersion": "10.0.9",
"targets": [
{
"datasource": {
"type": "prometheus",
"uid": "${DS_PROMETHEUS}"
},
"editorMode": "code",
"exemplar": false,
"expr": "sum(rate(envoy_cluster_ratelimit_ok{namespace=~\"$namespace\",pod_name=~\"$pod\",service_istio_io_canonical_name=~\"$service\"}[60s])) * 30 + sum(rate(envoy_cluster_ratelimit_over_limit{namespace=~\"$namespace\",pod_name=~\"$pod\",service_istio_io_canonical_name=~\"$service\"}[60s])) * 30",
"format": "time_series",
"instant": false,
"legendFormat": "total_requests",
"range": true,
"refId": "A"
},
{
"datasource": {
"type": "prometheus",
"uid": "${DS_PROMETHEUS}"
},
"editorMode": "code",
"exemplar": false,
"expr": "sum(rate(envoy_cluster_ratelimit_ok{namespace=~\"$namespace\", pod_name=~\"$pod\", service_istio_io_canonical_name=~\"$service\"}[60s])) * 30",
"format": "time_series",
"hide": false,
"instant": false,
"legendFormat": "unlimited_requests",
"range": true,
"refId": "B"
},
{
"datasource": {
"type": "prometheus",
"uid": "${DS_PROMETHEUS}"
},
"editorMode": "code",
"expr": "sum(rate(envoy_cluster_ratelimit_over_limit{namespace=~\"$namespace\",pod_name=~\"$pod\",service_istio_io_canonical_name=~\"$service\"}[60s])) * 30",
"hide": false,
"instant": false,
"legendFormat": "limited_requests",
"range": true,
"refId": "C"
}
],
"title": "Requests",
"transparent": true,
"type": "aliyun-timeseries-panel"
},
{
"datasource": {
"type": "prometheus",
"uid": "${DS_PROMETHEUS}"
},
"fieldConfig": {
"defaults": {
"color": {
"mode": "thresholds"
},
"mappings": [],
"thresholds": {
"mode": "absolute",
"steps": [
{
"color": "green",
"value": null
}
]
}
},
"overrides": []
},
"gridPos": {
"h": 8,
"w": 4,
"x": 0,
"y": 8
},
"id": 2,
"options": {
"colorMode": "value",
"graphMode": "area",
"justifyMode": "auto",
"orientation": "auto",
"reduceOptions": {
"calcs": [
"lastNotNull"
],
"fields": "",
"values": false
},
"textMode": "auto"
},
"pluginVersion": "10.0.9",
"targets": [
{
"datasource": {
"type": "prometheus",
"uid": "${DS_PROMETHEUS}"
},
"editorMode": "code",
"expr": "sum(increase(envoy_cluster_ratelimit_ok{namespace=~\"$namespace\", pod_name=~\"$pod\", service_istio_io_canonical_name=~\"$service\"}[$__range])) + sum(increase(envoy_cluster_ratelimit_over_limit{namespace=~\"$namespace\", pod_name=~\"$pod\", service_istio_io_canonical_name=~\"$service\"}[$__range]))",
"instant": false,
"range": true,
"refId": "A"
}
],
"title": "Requests Total",
"type": "stat"
},
{
"datasource": {
"type": "prometheus",
"uid": "${DS_PROMETHEUS}"
},
"fieldConfig": {
"defaults": {
"color": {
"mode": "thresholds"
},
"mappings": [],
"thresholds": {
"mode": "absolute",
"steps": [
{
"color": "green",
"value": null
}
]
}
},
"overrides": []
},
"gridPos": {
"h": 8,
"w": 4,
"x": 4,
"y": 8
},
"id": 5,
"options": {
"colorMode": "value",
"graphMode": "area",
"justifyMode": "auto",
"orientation": "auto",
"reduceOptions": {
"calcs": [
"lastNotNull"
],
"fields": "",
"values": false
},
"textMode": "auto"
},
"pluginVersion": "10.0.9",
"targets": [
{
"datasource": {
"type": "prometheus",
"uid": "${DS_PROMETHEUS}"
},
"editorMode": "code",
"expr": "sum(increase(envoy_cluster_ratelimit_ok{namespace=~\"$namespace\", pod_name=~\"$pod\", service_istio_io_canonical_name=~\"$service\"}[$__range]))",
"instant": false,
"range": true,
"refId": "A"
}
],
"title": "Requests OK",
"type": "stat"
},
{
"datasource": {
"type": "prometheus",
"uid": "${DS_PROMETHEUS}"
},
"fieldConfig": {
"defaults": {
"color": {
"mode": "thresholds"
},
"mappings": [],
"thresholds": {
"mode": "absolute",
"steps": [
{
"color": "green",
"value": null
}
]
}
},
"overrides": []
},
"gridPos": {
"h": 8,
"w": 4,
"x": 8,
"y": 8
},
"id": 4,
"options": {
"colorMode": "value",
"graphMode": "area",
"justifyMode": "auto",
"orientation": "auto",
"reduceOptions": {
"calcs": [
"lastNotNull"
],
"fields": "",
"values": false
},
"textMode": "auto"
},
"pluginVersion": "10.0.9",
"targets": [
{
"datasource": {
"type": "prometheus",
"uid": "${DS_PROMETHEUS}"
},
"editorMode": "code",
"expr": "sum(increase(envoy_cluster_ratelimit_over_limit{namespace=~\"$namespace\", pod_name=~\"$pod\", service_istio_io_canonical_name=~\"$service\"}[$__range]))",
"instant": false,
"range": true,
"refId": "A"
}
],
"title": "Requests Reached Limits",
"type": "stat"
},
{
"datasource": {
"type": "prometheus",
"uid": "${DS_PROMETHEUS}"
},
"fieldConfig": {
"defaults": {
"color": {
"mode": "thresholds"
},
"custom": {
"neutral": -1
},
"mappings": [],
"max": 100,
"min": 0,
"thresholds": {
"mode": "percentage",
"steps": [
{
"color": "red",
"value": null
},
{
"color": "green",
"value": 90
}
]
}
},
"overrides": []
},
"gridPos": {
"h": 7,
"w": 6,
"x": 0,
"y": 16
},
"id": 6,
"options": {
"orientation": "auto",
"reduceOptions": {
"calcs": [
"lastNotNull"
],
"fields": "",
"values": false
},
"showThresholdLabels": false,
"showThresholdMarkers": true
},
"pluginVersion": "10.0.9",
"targets": [
{
"datasource": {
"type": "prometheus",
"uid": "${DS_PROMETHEUS}"
},
"editorMode": "code",
"expr": "sum(increase(envoy_cluster_ratelimit_ok{namespace=~\"$namespace\", pod_name=~\"$pod\", service_istio_io_canonical_name=~\"$service\"}[$__range])) / (sum(increase(envoy_cluster_ratelimit_ok{namespace=~\"$namespace\", pod_name=~\"$pod\", service_istio_io_canonical_name=~\"$service\"}[$__range])) + sum(increase(envoy_cluster_ratelimit_over_limit{namespace=~\"$namespace\", pod_name=~\"$pod\", service_istio_io_canonical_name=~\"$service\"}[$__range]))) * 100",
"instant": false,
"range": true,
"refId": "A"
}
],
"title": "Requests OK Percent",
"type": "gauge"
},
{
"datasource": {
"type": "prometheus",
"uid": "${DS_PROMETHEUS}"
},
"fieldConfig": {
"defaults": {
"color": {
"mode": "thresholds"
},
"custom": {
"neutral": -1
},
"mappings": [],
"max": 100,
"min": 0,
"thresholds": {
"mode": "percentage",
"steps": [
{
"color": "green",
"value": null
},
{
"color": "red",
"value": 10
}
]
}
},
"overrides": []
},
"gridPos": {
"h": 7,
"w": 6,
"x": 6,
"y": 16
},
"id": 7,
"options": {
"orientation": "auto",
"reduceOptions": {
"calcs": [
"lastNotNull"
],
"fields": "",
"values": false
},
"showThresholdLabels": false,
"showThresholdMarkers": true
},
"pluginVersion": "10.0.9",
"targets": [
{
"datasource": {
"type": "prometheus",
"uid": "${DS_PROMETHEUS}"
},
"editorMode": "code",
"expr": "sum(increase(envoy_cluster_ratelimit_over_limit{namespace=~\"$namespace\", pod_name=~\"$pod\", service_istio_io_canonical_name=~\"$service\"}[$__range])) / (sum(increase(envoy_cluster_ratelimit_ok{namespace=~\"$namespace\", pod_name=~\"$pod\", service_istio_io_canonical_name=~\"$service\"}[$__range])) + sum(increase(envoy_cluster_ratelimit_over_limit{namespace=~\"$namespace\", pod_name=~\"$pod\", service_istio_io_canonical_name=~\"$service\"}[$__range]))) * 100",
"instant": false,
"range": true,
"refId": "A"
}
],
"title": "Requests Reached Limits Percent",
"type": "gauge"
}
],
"refresh": "",
"schemaVersion": 38,
"style": "dark",
"tags": [],
"templating": {
"list": [
{
"current": {
"selected": false,
"text": "datasource",
"value": "datasource"
},
"hide": 0,
"includeAll": false,
"label": "datasource",
"multi": false,
"name": "DS_PROMETHEUS",
"options": [],
"query": "prometheus",
"queryValue": "datasource",
"refresh": 1,
"regex": "",
"skipUrlSync": false,
"type": "datasource"
},
{
"allValue": ".*",
"current": {
"selected": false,
"text": "All",
"value": "$__all"
},
"datasource": {
"type": "prometheus",
"uid": "ykIxRIhNk"
},
"definition": "query_result(sum(envoy_cluster_ratelimit_over_limit) by (namespace) or sum(envoy_cluster_ratelimit_ok) by (namespace))",
"hide": 0,
"includeAll": true,
"label": "namespace",
"multi": false,
"name": "namespace",
"options": [],
"query": {
"query": "query_result(sum(envoy_cluster_ratelimit_over_limit) by (namespace) or sum(envoy_cluster_ratelimit_ok) by (namespace))",
"refId": "PrometheusVariableQueryEditor-VariableQuery"
},
"refresh": 1,
"regex": "/.*namespace=\"(.*)\".*/",
"skipUrlSync": false,
"sort": 0,
"type": "query"
},
{
"allValue": ".*",
"current": {
"selected": false,
"text": "All",
"value": "$__all"
},
"datasource": {
"type": "prometheus",
"uid": "ykIxRIhNk"
},
"definition": "query_result(sum(envoy_cluster_ratelimit_over_limit) by (pod_name) or sum(envoy_cluster_ratelimit_ok) by (pod_name))",
"description": "",
"hide": 0,
"includeAll": true,
"label": "pod",
"multi": false,
"name": "pod",
"options": [],
"query": {
"query": "query_result(sum(envoy_cluster_ratelimit_over_limit) by (pod_name) or sum(envoy_cluster_ratelimit_ok) by (pod_name))",
"refId": "PrometheusVariableQueryEditor-VariableQuery"
},
"refresh": 1,
"regex": "/.*pod_name=\"(.*)\".*/",
"skipUrlSync": false,
"sort": 0,
"type": "query"
},
{
"allValue": ".*",
"current": {
"selected": false,
"text": "All",
"value": "$__all"
},
"datasource": {
"type": "prometheus",
"uid": "ykIxRIhNk"
},
"definition": "query_result(sum(envoy_cluster_ratelimit_over_limit) by (service_istio_io_canonical_name) or sum(envoy_cluster_ratelimit_ok) by (service_istio_io_canonical_name))",
"hide": 0,
"includeAll": true,
"label": "service",
"multi": false,
"name": "service",
"options": [],
"query": {
"query": "query_result(sum(envoy_cluster_ratelimit_over_limit) by (service_istio_io_canonical_name) or sum(envoy_cluster_ratelimit_ok) by (service_istio_io_canonical_name))",
"refId": "PrometheusVariableQueryEditor-VariableQuery"
},
"refresh": 1,
"regex": "/.*service_istio_io_canonical_name=\"(.*)\".*/",
"skipUrlSync": false,
"sort": 0,
"type": "query"
}
]
},
"time": {
"from": "now-5m",
"to": "now"
},
"timepicker": {},
"timezone": "browser",
"title": "Global Rate Limit",
"uid": "d8f95bbc-efb6-41e7-8929-25551b22f3d2",
"version": 25,
"weekStart": ""
}告警规则示例
告警配置 | 示例 | 说明 |
自定义PromQL语句 | sum (increase(envoy_cluster_ratelimit_over_limit[1m])) by (namespace, service_istio_io_canonical_name) > 10 | 查询最近1分钟之内限流的请求数量,并根据触发限流的服务所在命名空间以及服务名称进行分组。当1分钟内被限流的请求数量大于10时触发告警。 |
告警内容 | 已触发限流!命名空间:{{$labels.namespace}},发生限流的目标服务:{{$labels.service_istio_io_canonical_name}}。当前1分钟内限流的请求数量:{{ $value }} | 展示了触发限流的服务所在命名空间以及服务名称,以及最近1分钟内发往该服务被限流的请求数量的告警信息格式。 |
本地限流防护
Envoy代理使用令牌桶算法实现本地限流。令牌桶算法是一种限制发送到服务端的请求数量的方法,基于一定数量的令牌桶。存储桶以恒定的速率不断填充令牌,当向服务发送请求时,会从存储桶中删除一个令牌。如果存储桶为空,则请求将被拒绝。
本地限流可以与全局限流结合使用,以提供不同层面的限流功能。
大盘示例
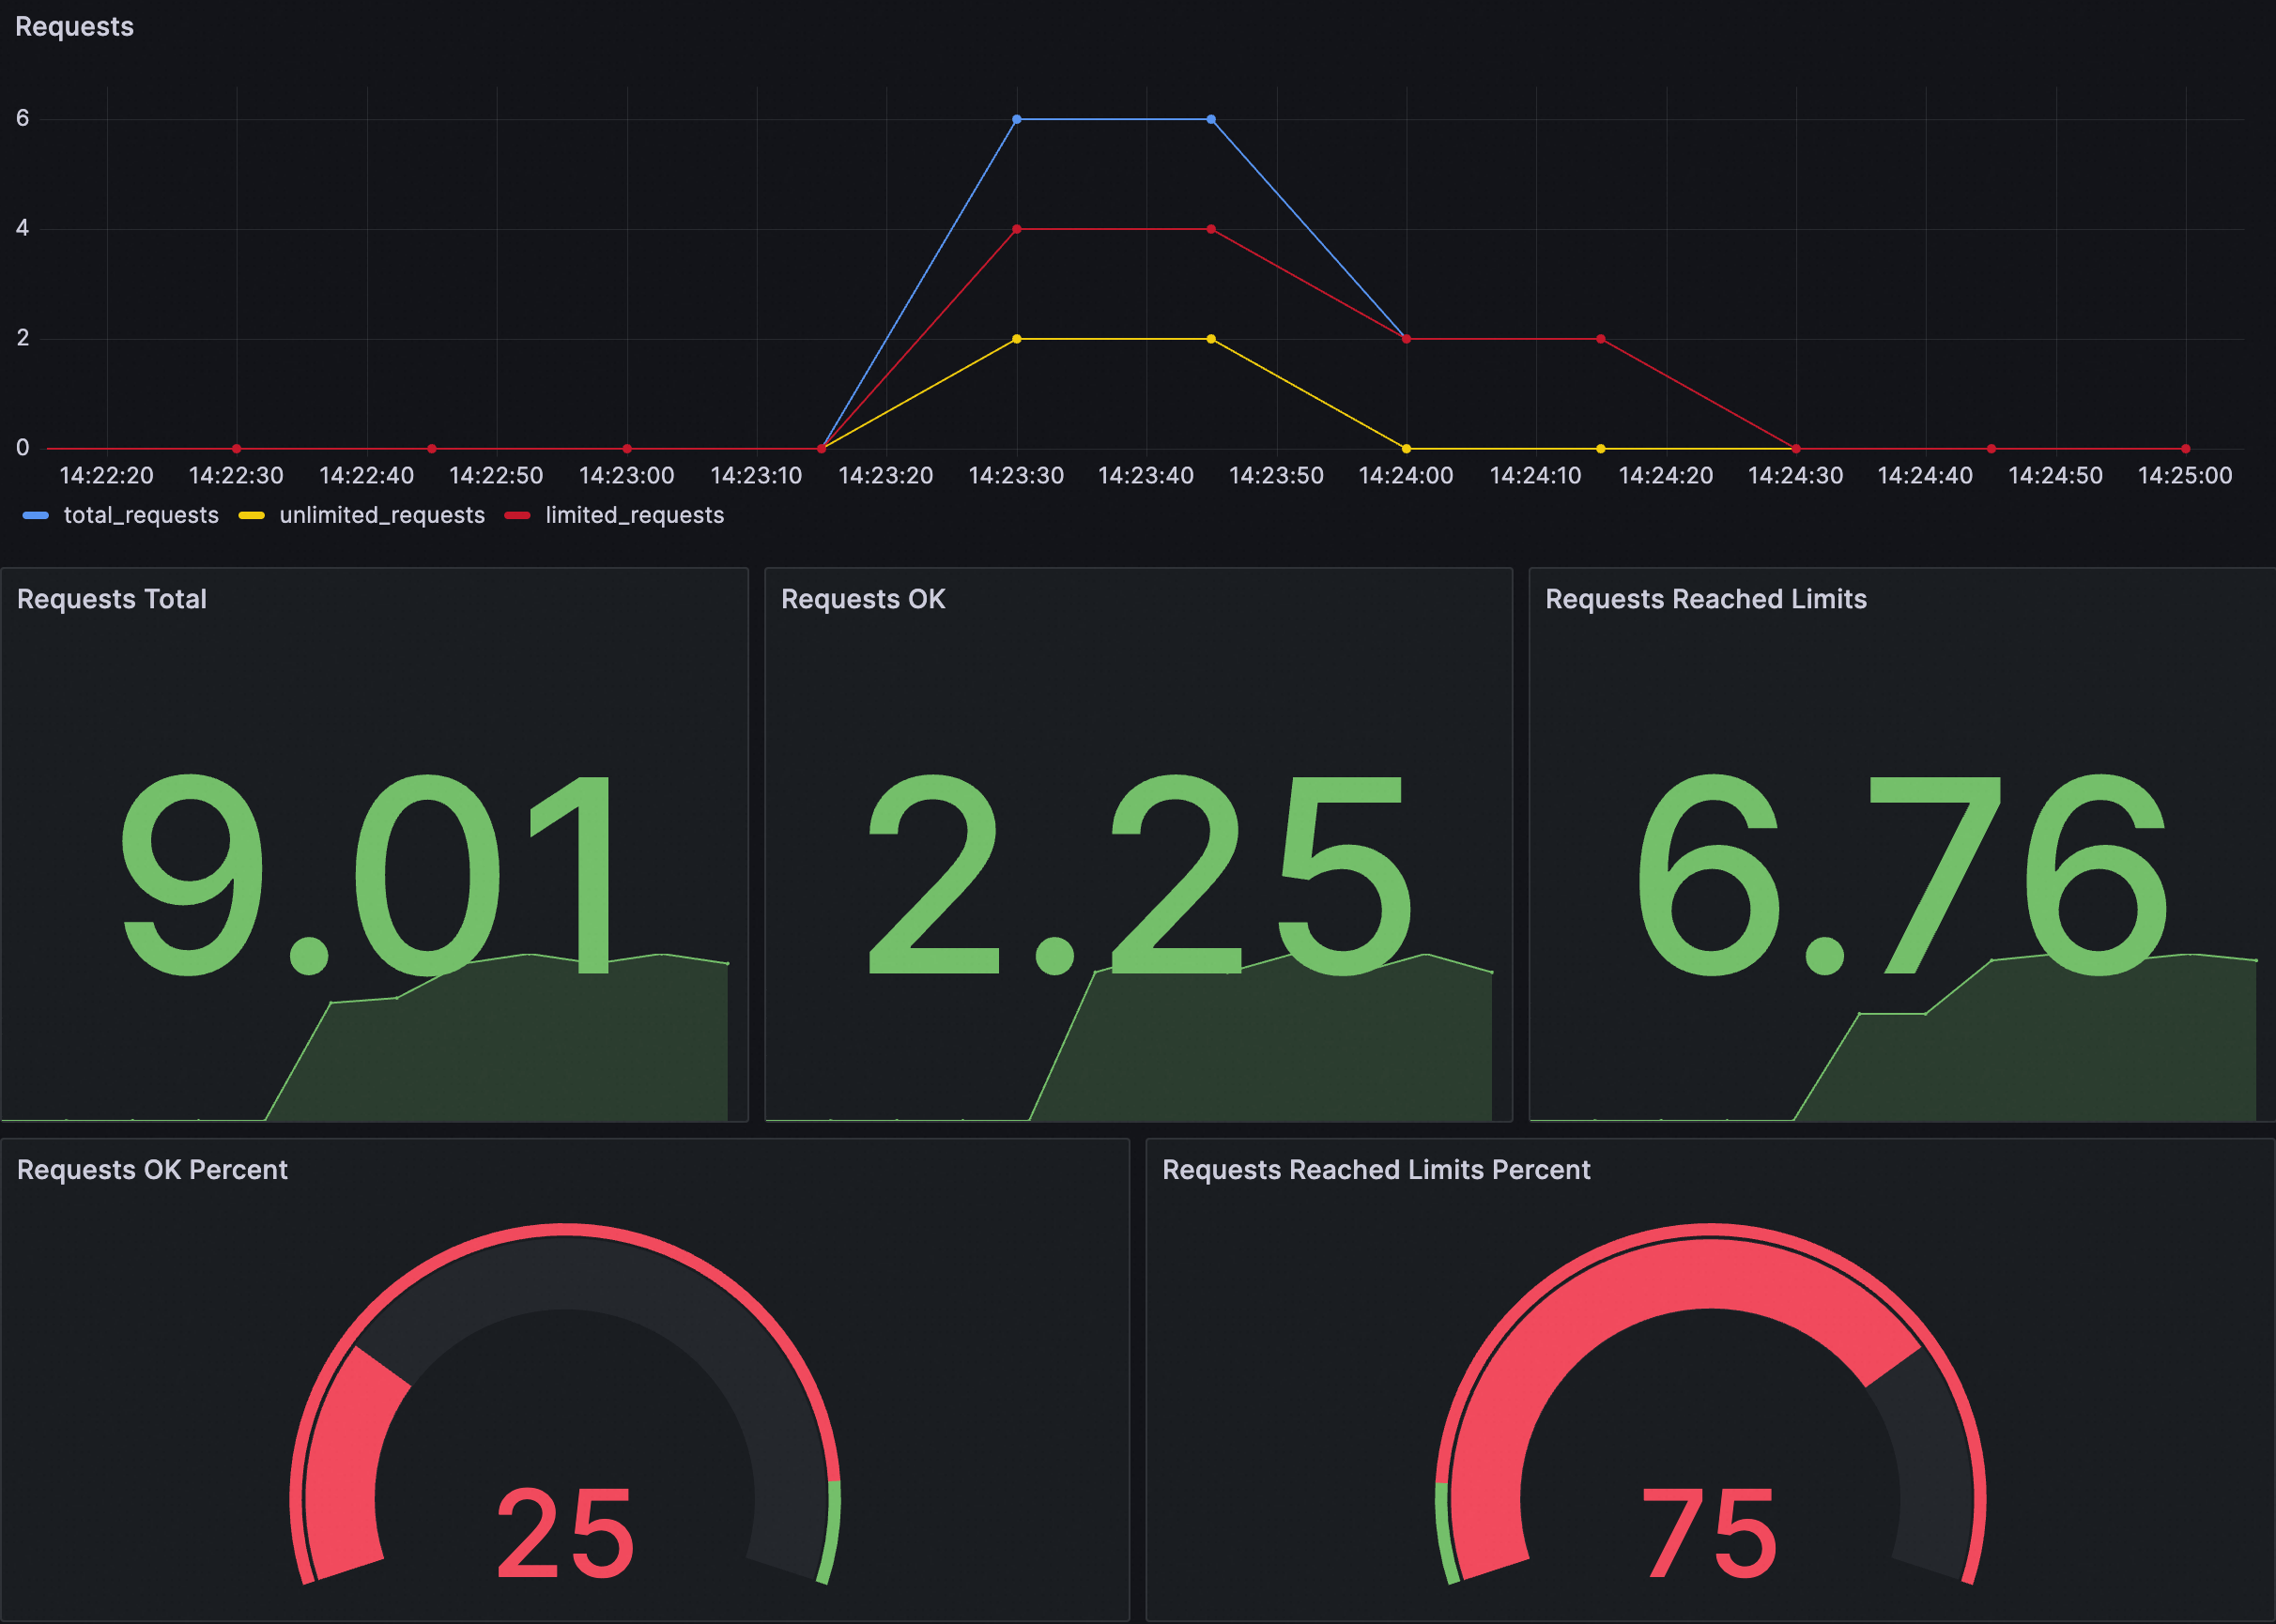
对应每个面板说明如下:
面板(Panels) | 说明 |
Requests | 请求总体情况,包含以下指标:
|
Requests OK Percent | 请求成功的总数占总请求数的比例。 |
Requests Reached Limits Percent | 触发限流的请求占总请求数的比例。 |
您可以将以下JSON导入到Grafana大盘,为集群创建本地限流大盘。您也可以修改或根据以下JSON内容自定义创建大盘。
展开查看JSON内容
{
"annotations": {
"list": [
{
"builtIn": 1,
"datasource": {
"type": "grafana",
"uid": "-- Grafana --"
},
"enable": true,
"hide": true,
"iconColor": "rgba(0, 211, 255, 1)",
"name": "Annotations & Alerts",
"type": "dashboard"
}
]
},
"editable": true,
"fiscalYearStartMonth": 0,
"graphTooltip": 0,
"id": 167,
"links": [],
"liveNow": false,
"panels": [
{
"datasource": {
"type": "prometheus",
"uid": "${DS_PROMETHEUS}"
},
"fieldConfig": {
"defaults": {
"color": {
"mode": "palette-classic"
},
"custom": {
"axisCenteredZero": false,
"axisColorMode": "text",
"axisLabel": "",
"axisPlacement": "auto",
"barAlignment": 0,
"drawStyle": "line",
"fillOpacity": 0,
"gradientMode": "none",
"hideFrom": {
"legend": false,
"tooltip": false,
"viz": false
},
"lineInterpolation": "linear",
"lineWidth": 1,
"pointSize": 5,
"scaleDistribution": {
"type": "linear"
},
"showPoints": "auto",
"stacking": {
"group": "A",
"mode": "none"
}
},
"mappings": [],
"thresholds": {
"mode": "absolute",
"steps": [
{
"color": "green",
"value": null
}
]
}
},
"overrides": [
{
"matcher": {
"id": "byName",
"options": "total_requests"
},
"properties": [
{
"id": "color",
"value": {
"fixedColor": "blue",
"mode": "fixed"
}
}
]
},
{
"matcher": {
"id": "byName",
"options": "unlimited_requests"
},
"properties": [
{
"id": "color",
"value": {
"fixedColor": "dark-green",
"mode": "fixed"
}
}
]
},
{
"matcher": {
"id": "byName",
"options": "limited_requests"
},
"properties": [
{
"id": "color",
"value": {
"fixedColor": "dark-red",
"mode": "fixed"
}
}
]
}
]
},
"gridPos": {
"h": 8,
"w": 12,
"x": 0,
"y": 0
},
"id": 1,
"options": {
"legend": {
"calcs": [],
"displayMode": "list",
"placement": "bottom",
"showLegend": true
},
"tooltip": {
"mode": "single",
"sort": "none",
"targets": []
}
},
"pluginVersion": "10.0.9",
"targets": [
{
"datasource": {
"type": "prometheus",
"uid": "${DS_PROMETHEUS}"
},
"editorMode": "code",
"exemplar": false,
"expr": "sum(rate(envoy_http_local_rate_limiter_http_local_rate_limit_enabled{namespace=~\"$namespace\",pod_name=~\"$pod\",service_istio_io_canonical_name=~\"$service\"}[60s])) * 30",
"format": "time_series",
"instant": false,
"legendFormat": "total_requests",
"range": true,
"refId": "A"
},
{
"datasource": {
"type": "prometheus",
"uid": "${DS_PROMETHEUS}"
},
"editorMode": "code",
"exemplar": false,
"expr": "sum(rate(envoy_http_local_rate_limiter_http_local_rate_limit_ok{namespace=~\"$namespace\", pod_name=~\"$pod\", service_istio_io_canonical_name=~\"$service\"}[60s])) * 30",
"format": "time_series",
"hide": false,
"instant": false,
"legendFormat": "unlimited_requests",
"range": true,
"refId": "B"
},
{
"datasource": {
"type": "prometheus",
"uid": "${DS_PROMETHEUS}"
},
"editorMode": "code",
"expr": "sum(rate(envoy_http_local_rate_limiter_http_local_rate_limit_enforced{namespace=~\"$namespace\",pod_name=~\"$pod\",service_istio_io_canonical_name=~\"$service\"}[60s])) * 30",
"hide": false,
"instant": false,
"legendFormat": "limited_requests",
"range": true,
"refId": "C"
}
],
"title": "Requests",
"transparent": true,
"type": "aliyun-timeseries-panel"
},
{
"datasource": {
"type": "prometheus",
"uid": "${DS_PROMETHEUS}"
},
"fieldConfig": {
"defaults": {
"color": {
"mode": "thresholds"
},
"mappings": [],
"thresholds": {
"mode": "absolute",
"steps": [
{
"color": "green",
"value": null
}
]
}
},
"overrides": []
},
"gridPos": {
"h": 8,
"w": 4,
"x": 0,
"y": 8
},
"id": 2,
"options": {
"colorMode": "value",
"graphMode": "area",
"justifyMode": "auto",
"orientation": "auto",
"reduceOptions": {
"calcs": [
"lastNotNull"
],
"fields": "",
"values": false
},
"textMode": "auto"
},
"pluginVersion": "10.0.9",
"targets": [
{
"datasource": {
"type": "prometheus",
"uid": "${DS_PROMETHEUS}"
},
"editorMode": "code",
"expr": "sum(increase(envoy_http_local_rate_limiter_http_local_rate_limit_enabled{namespace=~\"$namespace\", pod_name=~\"$pod\", service_istio_io_canonical_name=~\"$service\"}[$__range]))",
"instant": false,
"range": true,
"refId": "A"
}
],
"title": "Requests Total",
"type": "stat"
},
{
"datasource": {
"type": "prometheus",
"uid": "${DS_PROMETHEUS}"
},
"fieldConfig": {
"defaults": {
"color": {
"mode": "thresholds"
},
"mappings": [],
"thresholds": {
"mode": "absolute",
"steps": [
{
"color": "green",
"value": null
}
]
}
},
"overrides": []
},
"gridPos": {
"h": 8,
"w": 4,
"x": 4,
"y": 8
},
"id": 5,
"options": {
"colorMode": "value",
"graphMode": "area",
"justifyMode": "auto",
"orientation": "auto",
"reduceOptions": {
"calcs": [
"lastNotNull"
],
"fields": "",
"values": false
},
"textMode": "auto"
},
"pluginVersion": "10.0.9",
"targets": [
{
"datasource": {
"type": "prometheus",
"uid": "${DS_PROMETHEUS}"
},
"editorMode": "code",
"expr": "sum(increase(envoy_http_local_rate_limiter_http_local_rate_limit_ok{namespace=~\"$namespace\", pod_name=~\"$pod\", service_istio_io_canonical_name=~\"$service\"}[$__range]))",
"instant": false,
"range": true,
"refId": "A"
}
],
"title": "Requests OK",
"type": "stat"
},
{
"datasource": {
"type": "prometheus",
"uid": "${DS_PROMETHEUS}"
},
"fieldConfig": {
"defaults": {
"color": {
"mode": "thresholds"
},
"mappings": [],
"thresholds": {
"mode": "absolute",
"steps": [
{
"color": "green",
"value": null
}
]
}
},
"overrides": []
},
"gridPos": {
"h": 8,
"w": 4,
"x": 8,
"y": 8
},
"id": 4,
"options": {
"colorMode": "value",
"graphMode": "area",
"justifyMode": "auto",
"orientation": "auto",
"reduceOptions": {
"calcs": [
"lastNotNull"
],
"fields": "",
"values": false
},
"textMode": "auto"
},
"pluginVersion": "10.0.9",
"targets": [
{
"datasource": {
"type": "prometheus",
"uid": "${DS_PROMETHEUS}"
},
"editorMode": "code",
"expr": "sum(increase(envoy_http_local_rate_limiter_http_local_rate_limit_enforced{namespace=~\"$namespace\", pod_name=~\"$pod\", service_istio_io_canonical_name=~\"$service\"}[$__range]))",
"instant": false,
"range": true,
"refId": "A"
}
],
"title": "Requests Reached Limits",
"type": "stat"
},
{
"datasource": {
"type": "prometheus",
"uid": "${DS_PROMETHEUS}"
},
"fieldConfig": {
"defaults": {
"color": {
"mode": "thresholds"
},
"custom": {
"neutral": -1
},
"mappings": [],
"max": 100,
"min": 0,
"thresholds": {
"mode": "percentage",
"steps": [
{
"color": "red",
"value": null
},
{
"color": "green",
"value": 90
}
]
}
},
"overrides": []
},
"gridPos": {
"h": 7,
"w": 6,
"x": 0,
"y": 16
},
"id": 6,
"options": {
"orientation": "auto",
"reduceOptions": {
"calcs": [
"lastNotNull"
],
"fields": "",
"values": false
},
"showThresholdLabels": false,
"showThresholdMarkers": true
},
"pluginVersion": "10.0.9",
"targets": [
{
"datasource": {
"type": "prometheus",
"uid": "${DS_PROMETHEUS}"
},
"editorMode": "code",
"expr": "sum(increase(envoy_http_local_rate_limiter_http_local_rate_limit_ok{namespace=~\"$namespace\", pod_name=~\"$pod\", service_istio_io_canonical_name=~\"$service\"}[$__range])) / sum(increase(envoy_http_local_rate_limiter_http_local_rate_limit_enabled{namespace=~\"$namespace\", pod_name=~\"$pod\", service_istio_io_canonical_name=~\"$service\"}[$__range])) * 100",
"instant": false,
"range": true,
"refId": "A"
}
],
"title": "Requests OK Percent",
"type": "gauge"
},
{
"datasource": {
"type": "prometheus",
"uid": "${DS_PROMETHEUS}"
},
"fieldConfig": {
"defaults": {
"color": {
"mode": "thresholds"
},
"custom": {
"neutral": -1
},
"mappings": [],
"max": 100,
"min": 0,
"thresholds": {
"mode": "percentage",
"steps": [
{
"color": "green",
"value": null
},
{
"color": "red",
"value": 10
}
]
}
},
"overrides": []
},
"gridPos": {
"h": 7,
"w": 6,
"x": 6,
"y": 16
},
"id": 7,
"options": {
"orientation": "auto",
"reduceOptions": {
"calcs": [
"lastNotNull"
],
"fields": "",
"values": false
},
"showThresholdLabels": false,
"showThresholdMarkers": true
},
"pluginVersion": "10.0.9",
"targets": [
{
"datasource": {
"type": "prometheus",
"uid": "${DS_PROMETHEUS}"
},
"editorMode": "code",
"expr": "sum(increase(envoy_http_local_rate_limiter_http_local_rate_limit_enforced{namespace=~\"$namespace\", pod_name=~\"$pod\", service_istio_io_canonical_name=~\"$service\"}[$__range])) / sum(increase(envoy_http_local_rate_limiter_http_local_rate_limit_enabled{namespace=~\"$namespace\", pod_name=~\"$pod\", service_istio_io_canonical_name=~\"$service\"}[$__range])) * 100",
"instant": false,
"range": true,
"refId": "A"
}
],
"title": "Requests Reached Limits Percent",
"type": "gauge"
}
],
"refresh": "",
"schemaVersion": 38,
"style": "dark",
"tags": [],
"templating": {
"list": [
{
"allValue": ".*",
"current": {
"selected": false,
"text": "datasource",
"value": "datasource"
},
"hide": 0,
"includeAll": false,
"label": "datasource",
"multi": false,
"name": "DS_PROMETHEUS",
"options": [],
"query": "prometheus",
"queryValue": "datasource",
"refresh": 1,
"regex": "",
"skipUrlSync": false,
"type": "datasource"
},
{
"allValue": ".*",
"current": {
"selected": false,
"text": "All",
"value": "$__all"
},
"datasource": {
"type": "prometheus",
"uid": "ykIxRIhNk"
},
"definition": "query_result(sum(envoy_http_local_rate_limiter_http_local_rate_limit_enabled) by (namespace))",
"hide": 0,
"includeAll": true,
"label": "namespace",
"multi": false,
"name": "namespace",
"options": [],
"query": {
"query": "query_result(sum(envoy_http_local_rate_limiter_http_local_rate_limit_enabled) by (namespace))",
"refId": "PrometheusVariableQueryEditor-VariableQuery"
},
"refresh": 1,
"regex": "/.*namespace=\"(.*)\".*/",
"skipUrlSync": false,
"sort": 0,
"type": "query"
},
{
"allValue": ".*",
"current": {
"selected": false,
"text": "All",
"value": "$__all"
},
"datasource": {
"type": "prometheus",
"uid": "ykIxRIhNk"
},
"definition": "query_result(sum(envoy_http_local_rate_limiter_http_local_rate_limit_enabled) by (pod_name))",
"description": "",
"hide": 0,
"includeAll": true,
"label": "pod",
"multi": false,
"name": "pod",
"options": [],
"query": {
"query": "query_result(sum(envoy_http_local_rate_limiter_http_local_rate_limit_enabled) by (pod_name))",
"refId": "PrometheusVariableQueryEditor-VariableQuery"
},
"refresh": 1,
"regex": "/.*pod_name=\"(.*)\".*/",
"skipUrlSync": false,
"sort": 0,
"type": "query"
},
{
"allValue": ".*",
"current": {
"selected": false,
"text": "All",
"value": "$__all"
},
"datasource": {
"type": "prometheus",
"uid": "ykIxRIhNk"
},
"definition": "query_result(sum(envoy_http_local_rate_limiter_http_local_rate_limit_enabled) by (service_istio_io_canonical_name))",
"hide": 0,
"includeAll": true,
"label": "service",
"multi": false,
"name": "service",
"options": [],
"query": {
"query": "query_result(sum(envoy_http_local_rate_limiter_http_local_rate_limit_enabled) by (service_istio_io_canonical_name))",
"refId": "PrometheusVariableQueryEditor-VariableQuery"
},
"refresh": 1,
"regex": "/.*service_istio_io_canonical_name=\"(.*)\".*/",
"skipUrlSync": false,
"sort": 0,
"type": "query"
}
]
},
"time": {
"from": "now-5m",
"to": "now"
},
"timepicker": {},
"timezone": "browser",
"title": "Local Rate Limit",
"uid": "859fe8e7-c7dd-46f4-a1c0-c0c7010bcf19",
"version": 7,
"weekStart": ""
}告警规则示例
告警配置 | 示例 | 说明 |
自定义PromQL语句 | sum (increase(envoy_http_local_rate_limiter_http_local_rate_limit_enforced[1m])) by (namespace, service_istio_io_canonical_name) > 10 | 查询最近1分钟之内限流的请求数量,并根据触发限流的服务所在命名空间以及服务名称进行分组。当1分钟内被限流的请求数量大于10时触发告警。 |
告警内容 | 已触发限流!命名空间:{{$labels.namespace}},发生限流的目标服务:{{$labels.service_istio_io_canonical_name}}。当前1分钟内限流的请求数量:{{ $value }} | 展示了触发限流的服务所在命名空间以及服务名称,以及最近1分钟内发往该服务被限流的请求数量的告警信息格式。 |
相关操作
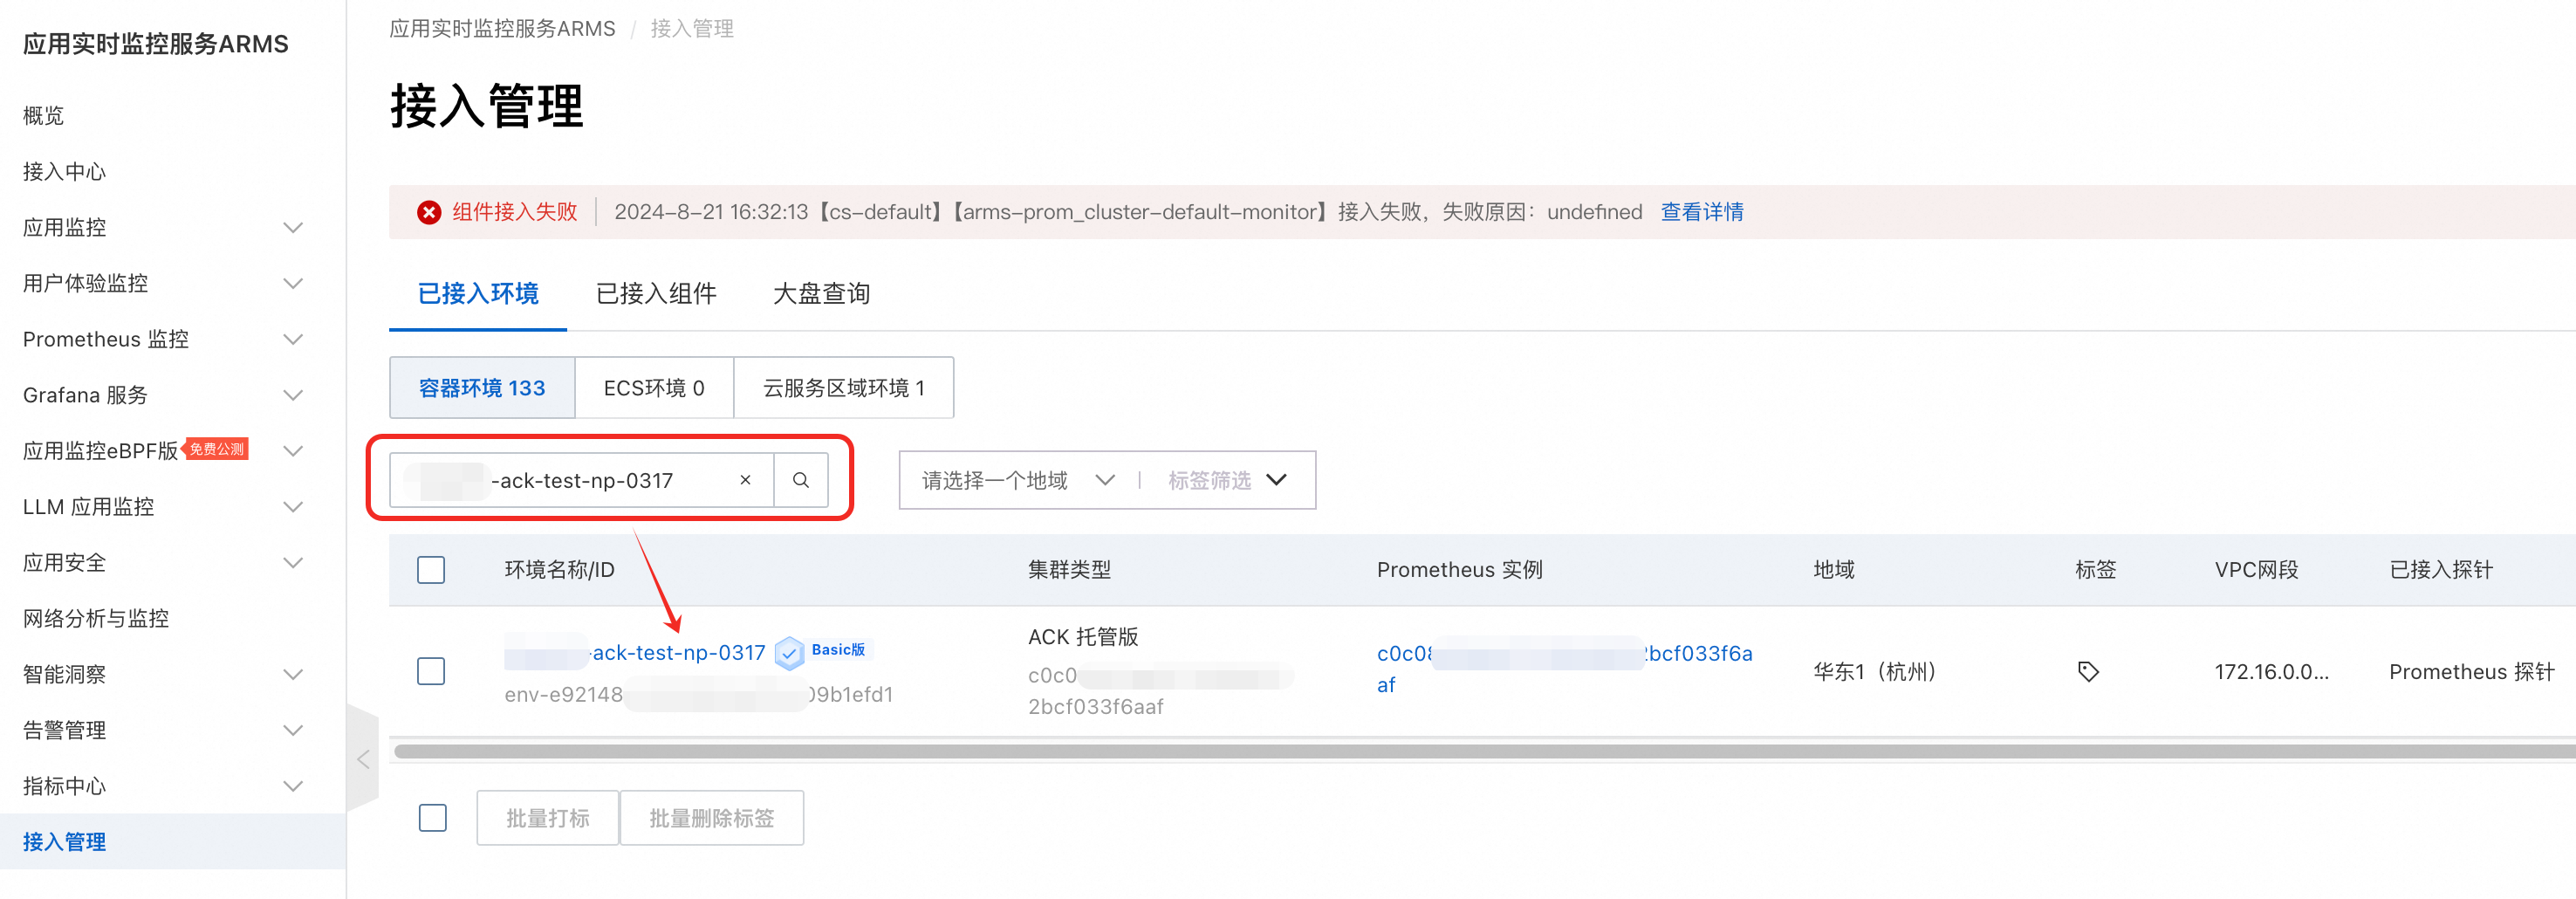
导入Grafana大盘
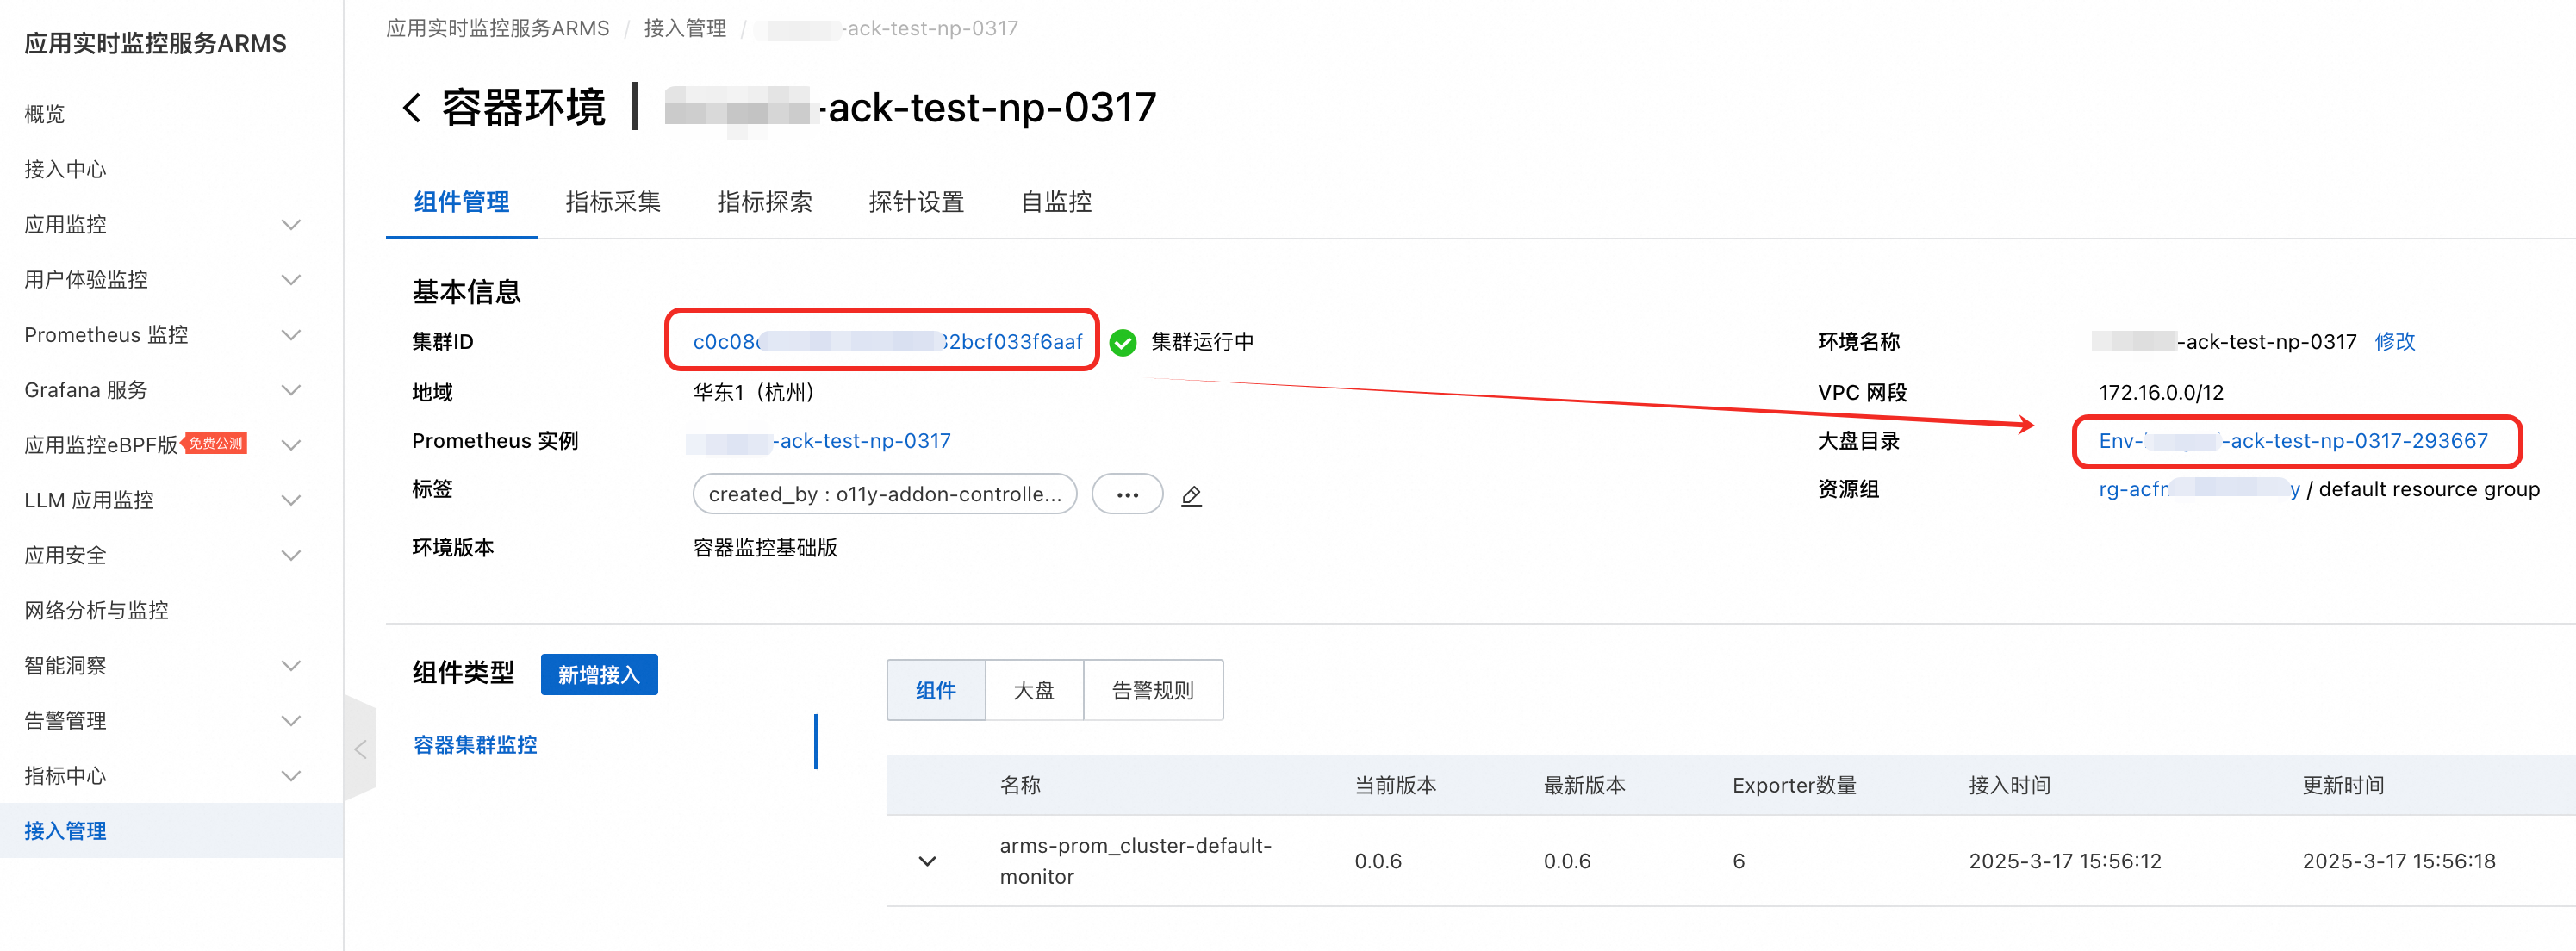
登录ARMS控制台。
在左侧导航栏,单击接入管理。
在已接入环境页签中选择容器环境,通过集群名称搜索环境,然后单击进入目标环境。单击大盘目录。
在Dashboards页签右侧,单击Import按钮。
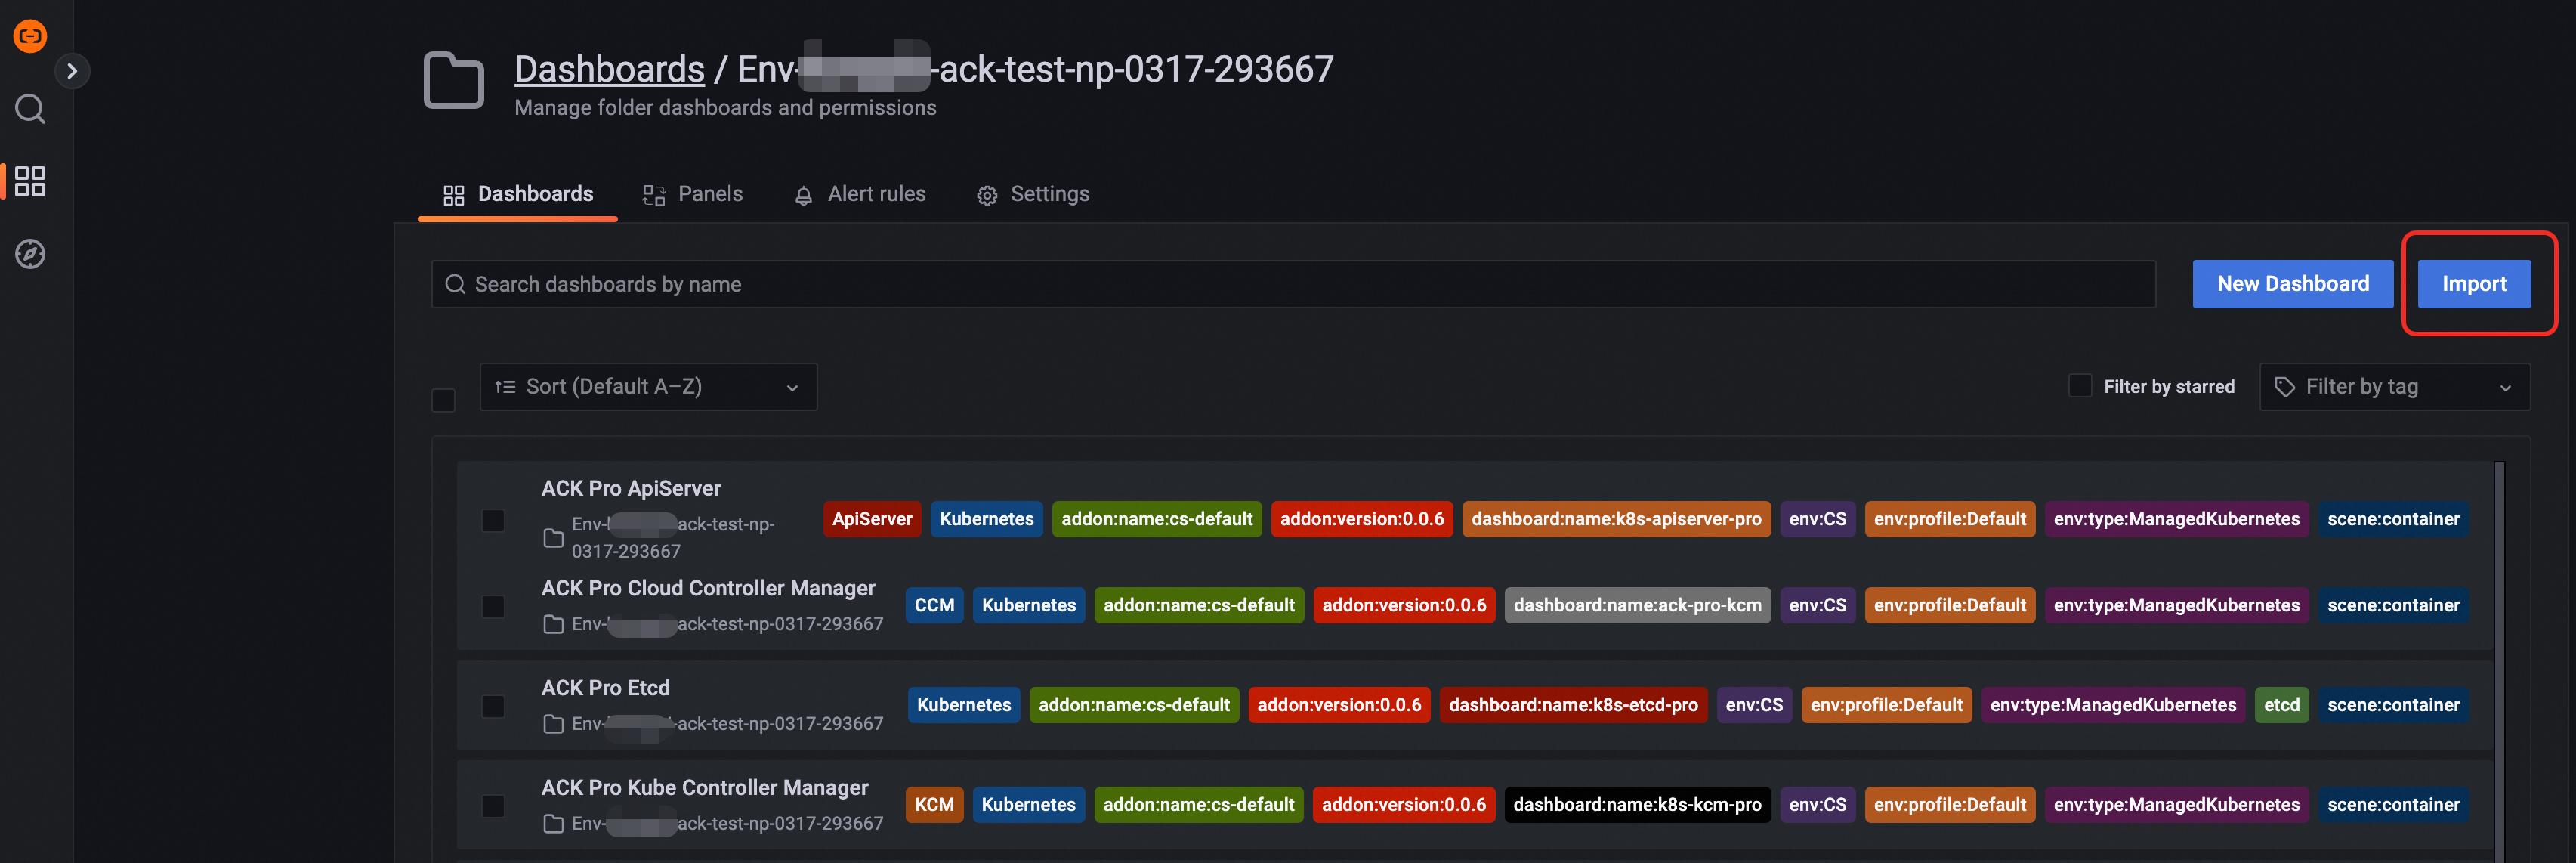
将JSON内容粘贴到Import via panel json区域,然后单击Load按钮。保持默认设置,单击Import,即可完成大盘的导入。
说明您也可以通过上传JSON文件的方式导入大盘。