
使用ESRally工具对阿里云Elasticsearch 8.9.1和6.8.6版本的实例进行基准测试对比。
压测配置
项目 | 说明 |
阿里云ES实例配置 |
|
ESRally配置 | 使用ESRally的默认配置tracks。 |
数据集 | 使用ESRally的预置数据集 获取数据集,请参见通过Elasticsearch Rally Hub获取。 |
分片数 |
|
bulk_size | 每次批量操作提交2000个文档。 |
bulk_indexing_clients | 同时执行批量索引操作的客户端数量为10个。 |
压测结果
压测结果仅供参考,无法代表实际生产中写入查询情况,建议您结合业务生产数据进行压测。
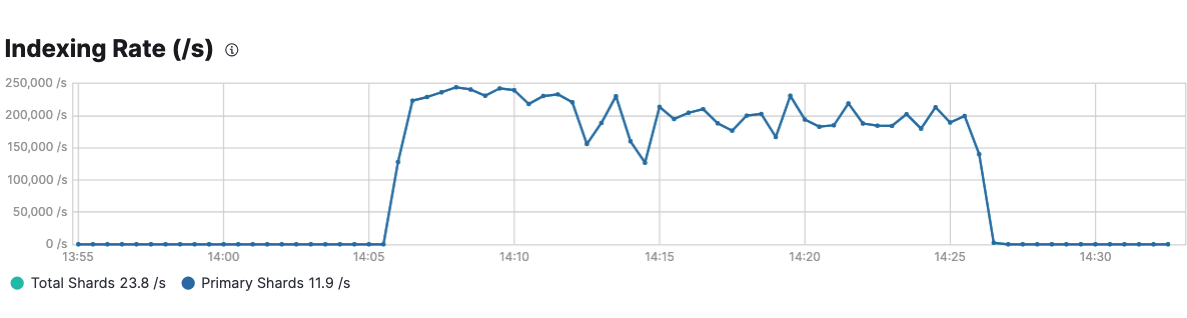
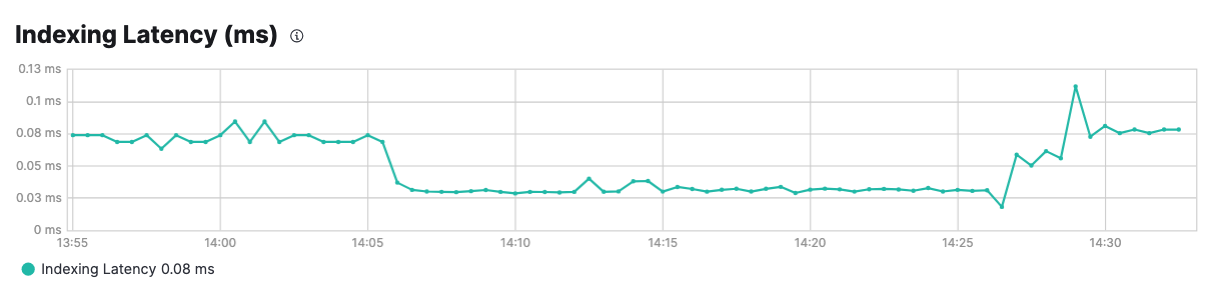
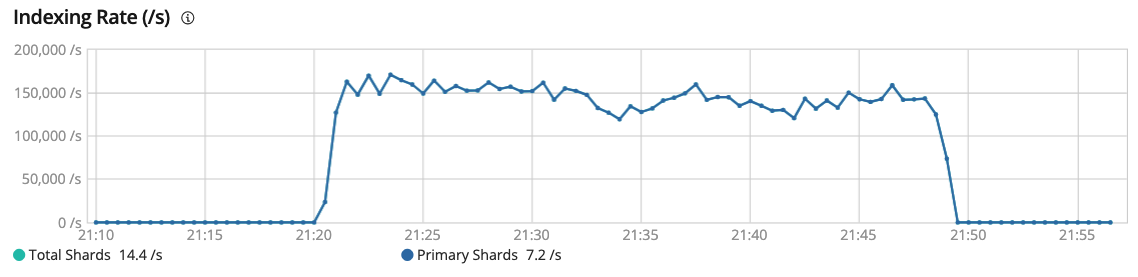
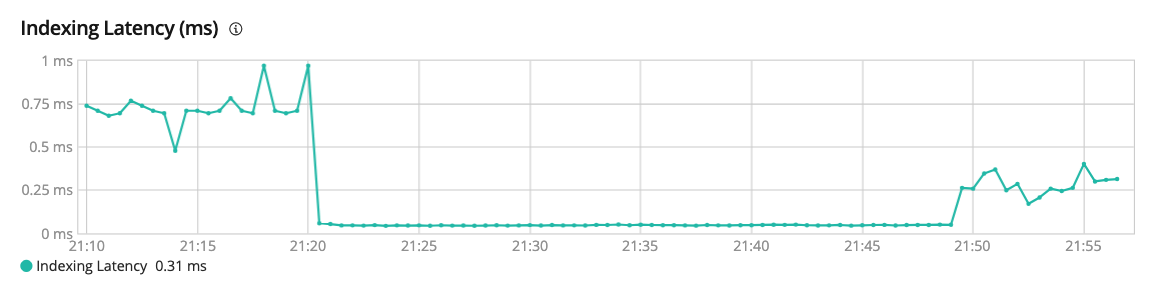
主要压测指标结果
阿里云ES版本 | 索引写入速率 | 索引写入延时 |
8.9.1版本 |
|
|
6.8.6版本 |
|
|
基准压测报告
Baseline指代6.8.6版本实例,Contender指代8.9.1实例。表中指标的具体含义,请参见压测指标和任务参数说明。
Metric | Task | Baseline | Contender | Diff | Unit | Diff % |
Cumulative indexing time of primary shards | - | 195.859 | 129.703 | -66.1556 | min | -33.78% |
Min cumulative indexing time across primary shard | - | 8.33E-05 | 0 | -8.00E-05 | min | -100.00% |
Median cumulative indexing time across primary shard | - | 1.42498 | 0.857517 | -0.56747 | min | -39.82% |
Max cumulative indexing time across primary shard | - | 26.5076 | 16.5645 | -9.94305 | min | -37.51% |
Cumulative indexing throttle time of primary shards | - | 0 | 0 | 0 | min | 0.00% |
Min cumulative indexing throttle time across primary shard | - | 0 | 0 | 0 | min | 0.00% |
Median cumulative indexing throttle time across primary shard | - | 0 | 0 | 0 | min | 0.00% |
Max cumulative indexing throttle time across primary shard | - | 0 | 0 | 0 | min | 0.00% |
Cumulative merge time of primary shards | - | 119.628 | 50.4829 | -69.1454 | min | -57.80% |
Cumulative merge count of primary shards | - | 1562 | 601 | -961 | - | -61.52% |
Min cumulative merge time across primary shard | - | 0 | 0 | 0 | min | 0.00% |
Median cumulative merge time across primary shard | - | 0.146967 | 0.081167 | -0.0658 | min | -44.77% |
Max cumulative merge time across primary shard | - | 19.4382 | 9.88038 | -9.55778 | min | -49.17% |
Cumulative merge throttle time of primary shards | - | 80.369 | 15.6503 | -64.7187 | min | -80.53% |
Min cumulative merge throttle time across primary shard | - | 0 | 0 | 0 | min | 0.00% |
Median cumulative merge throttle time across primary shard | - | 0.036 | 0 | -0.036 | min | -100.00% |
Max cumulative merge throttle time across primary shard | - | 13.8056 | 4.30382 | -9.50173 | min | -68.83% |
Cumulative refresh time of primary shards | - | 12.5059 | 17.8214 | 5.31553 | min | 42.50% |
Cumulative refresh count of primary shards | - | 13293 | 6140 | -7153 | - | -53.81% |
Min cumulative refresh time across primary shard | - | 0.00025 | 0 | -0.00025 | min | -100.00% |
Median cumulative refresh time across primary shard | - | 0.086067 | 0.119483 | 0.03342 | min | 38.83% |
Max cumulative refresh time across primary shard | - | 1.50832 | 2.15253 | 0.64422 | min | 42.71% |
Cumulative flush time of primary shards | - | 1.24528 | 3.80468 | 2.5594 | min | 205.53% |
Cumulative flush count of primary shards | - | 129 | 817 | 688 | - | 533.33% |
Min cumulative flush time across primary shard | - | 0 | 3.33E-05 | 3.00E-05 | min | 0.00% |
Median cumulative flush time across primary shard | - | 0.000567 | 0.016117 | 0.01555 | min | 2744.12% |
Max cumulative flush time across primary shard | - | 0.220317 | 0.5159 | 0.29558 | min | 134.16% |
Total Young Gen GC time | - | 71.731 | 17.58 | -54.151 | s | -75.49% |
Total Young Gen GC count | - | 2609 | 922 | -1687 | - | -64.66% |
Total Old Gen GC time | - | 0 | 0 | 0 | s | 0.00% |
Total Old Gen GC count | - | 0 | 0 | 0 | - | 0.00% |
Store size | - | 20.5377 | 18.1059 | -2.43177 | GB | -11.84% |
Translog size | - | 15.5092 | 0.000209 | -15.509 | GB | -100.00% |
Heap used for segments | - | 96.9595 | 0 | -96.9595 | MB | -100.00% |
Heap used for doc values | - | 0.143082 | 0 | -0.14308 | MB | -100.00% |
Heap used for terms | - | 83.811 | 0 | -83.811 | MB | -100.00% |
Heap used for norms | - | 0.041382 | 0 | -0.04138 | MB | -100.00% |
Heap used for points | - | 5.80011 | 0 | -5.80011 | MB | -100.00% |
Heap used for stored fields | - | 7.16398 | 0 | -7.16398 | MB | -100.00% |
Segment count | - | 688 | 56 | -632 | - | -91.86% |
Total Ingest Pipeline count | - | 0 | 0 | 0 | - | 0.00% |
Total Ingest Pipeline time | - | 0 | 0 | 0 | ms | 0.00% |
Total Ingest Pipeline failed | - | 0 | 0 | 0 | - | 0.00% |
Min Throughput | index-append | 144562 | 207170 | 62608.3 | docs/s | 43.31% |
Mean Throughput | index-append | 150015 | 219531 | 69516.8 | docs/s | 46.34% |
Median Throughput | index-append | 148913 | 217484 | 68571.1 | docs/s | 46.05% |
Max Throughput | index-append | 155476 | 238529 | 83052.4 | docs/s | 53.42% |
50th percentile latency | index-append | 118.389 | 80.1159 | -38.2727 | ms | -32.33% |
90th percentile latency | index-append | 181.669 | 123.321 | -58.3479 | ms | -32.12% |
99th percentile latency | index-append | 595.738 | 394.778 | -200.96 | ms | -33.73% |
99.9th percentile latency | index-append | 924.456 | 2125.09 | 1200.63 | ms | 129.87% |
99.99th percentile latency | index-append | 1329.83 | 2816.56 | 1486.73 | ms | 111.80% |
100th percentile latency | index-append | 2490.11 | 3341.14 | 851.03 | ms | 34.18% |
50th percentile service time | index-append | 118.389 | 80.1159 | -38.2727 | ms | -32.33% |
90th percentile service time | index-append | 181.669 | 123.321 | -58.3479 | ms | -32.12% |
99th percentile service time | index-append | 595.738 | 394.778 | -200.96 | ms | -33.73% |
99.9th percentile service time | index-append | 924.456 | 2125.09 | 1200.63 | ms | 129.87% |
99.99th percentile service time | index-append | 1329.83 | 2816.56 | 1486.73 | ms | 111.80% |
100th percentile service time | index-append | 2490.11 | 3341.14 | 851.03 | ms | 34.18% |
error rate | index-append | 0 | 0 | 0 | % | 0.00% |
Min Throughput | default | 7.95637 | 19.9543 | 11.9979 | ops/s | 150.80% |
Mean Throughput | default | 7.96001 | 19.9645 | 12.0045 | ops/s | 150.81% |
Median Throughput | default | 7.96018 | 19.9661 | 12.0059 | ops/s | 150.82% |
Max Throughput | default | 7.96335 | 19.9692 | 12.0058 | ops/s | 150.76% |
50th percentile latency | default | 90.2508 | 6.14099 | -84.1098 | ms | -93.20% |
90th percentile latency | default | 104.465 | 7.43625 | -97.0288 | ms | -92.88% |
99th percentile latency | default | 120.173 | 35.009 | -85.1635 | ms | -70.87% |
100th percentile latency | default | 122.049 | 73.9764 | -48.0721 | ms | -39.39% |
50th percentile service time | default | 88.8955 | 4.93161 | -83.9639 | ms | -94.45% |
90th percentile service time | default | 103.013 | 6.18375 | -96.8297 | ms | -94.00% |
99th percentile service time | default | 117.761 | 25.6137 | -92.1469 | ms | -78.25% |
100th percentile service time | default | 121.368 | 73.0867 | -48.2812 | ms | -39.78% |
error rate | default | 0 | 0 | 0 | % | 0.00% |
Min Throughput | term | 49.547 | 42.1405 | -7.40655 | ops/s | -14.95% |
Mean Throughput | term | 49.5671 | 42.4414 | -7.12567 | ops/s | -14.38% |
Median Throughput | term | 49.5671 | 42.4414 | -7.12567 | ops/s | -14.38% |
Max Throughput | term | 49.5872 | 42.7424 | -6.84478 | ops/s | -13.80% |
50th percentile latency | term | 10.1058 | 8.54857 | -1.55724 | ms | -15.41% |
90th percentile latency | term | 11.9156 | 10.4358 | -1.47983 | ms | -12.42% |
99th percentile latency | term | 34.4109 | 12.6224 | -21.7885 | ms | -63.32% |
100th percentile latency | term | 43.6123 | 22.1556 | -21.4567 | ms | -49.20% |
50th percentile service time | term | 9.07766 | 7.13231 | -1.94535 | ms | -21.43% |
90th percentile service time | term | 10.1664 | 8.7835 | -1.38285 | ms | -13.60% |
99th percentile service time | term | 19.2223 | 11.7613 | -7.46097 | ms | -38.81% |
100th percentile service time | term | 42.2021 | 20.9707 | -21.2314 | ms | -50.31% |
error rate | term | 0 | 0 | 0 | % | 0.00% |
Min Throughput | range | 1.00138 | 24.8781 | 23.8768 | ops/s | 2384.39% |
Mean Throughput | range | 1.00191 | 24.9019 | 23.9 | ops/s | 2385.45% |
Median Throughput | range | 1.00184 | 24.9036 | 23.9018 | ops/s | 2385.79% |
Max Throughput | range | 1.00273 | 24.9222 | 23.9194 | ops/s | 2385.42% |
50th percentile latency | range | 461.013 | 8.53625 | -452.477 | ms | -98.15% |
90th percentile latency | range | 484.002 | 10.119 | -473.883 | ms | -97.91% |
99th percentile latency | range | 570.831 | 87.6618 | -483.169 | ms | -84.64% |
100th percentile latency | range | 575.619 | 111.375 | -464.244 | ms | -80.65% |
50th percentile service time | range | 459.381 | 7.46765 | -451.914 | ms | -98.37% |
90th percentile service time | range | 482.296 | 9.07516 | -473.221 | ms | -98.12% |
99th percentile service time | range | 568.99 | 29.1409 | -539.849 | ms | -94.88% |
100th percentile service time | range | 574.188 | 110.444 | -463.744 | ms | -80.77% |
error rate | range | 0 | 0 | 0 | % | 0.00% |
Min Throughput | hourly_agg | 0.200542 | 0.200569 | 3.00E-05 | ops/s | 0.01% |
Mean Throughput | hourly_agg | 0.20075 | 0.200786 | 4.00E-05 | ops/s | 0.02% |
Median Throughput | hourly_agg | 0.200721 | 0.200756 | 3.00E-05 | ops/s | 0.02% |
Max Throughput | hourly_agg | 0.201076 | 0.201128 | 5.00E-05 | ops/s | 0.03% |
50th percentile latency | hourly_agg | 1763.18 | 1924.92 | 161.747 | ms | 9.17% |
90th percentile latency | hourly_agg | 1851.01 | 2009.28 | 158.272 | ms | 8.55% |
99th percentile latency | hourly_agg | 2020.41 | 2118.9 | 98.4938 | ms | 4.87% |
100th percentile latency | hourly_agg | 2021.06 | 2302.15 | 281.092 | ms | 13.91% |
50th percentile service time | hourly_agg | 1760.45 | 1921.89 | 161.444 | ms | 9.17% |
90th percentile service time | hourly_agg | 1848.91 | 2007.78 | 158.876 | ms | 8.59% |
99th percentile service time | hourly_agg | 2019.07 | 2116.37 | 97.3059 | ms | 4.82% |
100th percentile service time | hourly_agg | 2019.19 | 2300.89 | 281.704 | ms | 13.95% |
error rate | hourly_agg | 0 | 0 | 0 | % | 0.00% |
Min Throughput | scroll | 24.9909 | 25.0461 | 0.05527 | pages/s | 0.22% |
Mean Throughput | scroll | 24.995 | 25.076 | 0.08104 | pages/s | 0.32% |
Median Throughput | scroll | 24.9954 | 25.0691 | 0.07377 | pages/s | 0.30% |
Max Throughput | scroll | 24.997 | 25.1378 | 0.14077 | pages/s | 0.56% |
50th percentile latency | scroll | 482.33 | 355.086 | -127.245 | ms | -26.38% |
90th percentile latency | scroll | 506.714 | 373.589 | -133.125 | ms | -26.27% |
99th percentile latency | scroll | 570.072 | 407.765 | -162.306 | ms | -28.47% |
100th percentile latency | scroll | 662.62 | 443.031 | -219.589 | ms | -33.14% |
50th percentile service time | scroll | 480.324 | 353.174 | -127.15 | ms | -26.47% |
90th percentile service time | scroll | 505.168 | 371.193 | -133.975 | ms | -26.52% |
99th percentile service time | scroll | 567.947 | 405.43 | -162.517 | ms | -28.61% |
100th percentile service time | scroll | 660.957 | 440.533 | -220.424 | ms | -33.35% |
error rate | scroll | 0 | 0 | 0 | % | 0.00% |