本文主要介绍时序SPL指令的详细信息。
SPL指令列表
|
指令名称 |
说明 |
|
将Table数据构建成Series数据。 |
|
|
将SPL查询结果渲染为图表以实现可视化。 |
make-series
将table构建为series结构。
语法
| make-series  <output> = <field-col> [default = <default-value>]
             [, ...]
             on <time-col>
             [from <time-begin> to <time-end>
              step <step-value>]
             [by <tag-col>,...]
指令块
|
指令块 |
必填 |
说明 |
|
<output> = <field-col> , ... |
是 |
被转换为series的字段列,可以选择多列。 |
|
on <time-col> |
是 |
时间含义的字段列。 |
|
[default = <default-value>] & [from <time-begin> to <time-end> step <step-value>] |
否 |
根据time列进行缺失值填充。包含截取的time范围、填充步长和填充策略。 |
|
[by <tag-col>,...] |
否 |
按指定的tag列作聚合。 |
参数说明
|
参数 |
类型 |
说明 |
|
output |
Field |
输出聚合后的字段。 |
|
field-col |
Field |
输入的字段列。 |
|
default-value |
String |
缺失值填充方式。 可选值:
|
|
time-col |
Field |
输入的时间列。 |
|
time-begin |
String or Field |
期望得到的时间列范围,起始点。 可选参数为:
|
|
time-end |
String or Field |
期望得到的时间列范围,结束点。可选参数为:
|
|
step-value |
String |
缺失值填充步长。 可选单位: s(秒)、m(分钟)、h(小时)、d(天)、w(周)。 |
|
tag-col |
Field |
按该字段值进行聚合。 |
示例
将原始数据中的时间点构造为时间线,并填充缺失点。
-
原始数据
对不同的 Method,将时间戳按60s对齐,并计算出60s时间窗口内的聚合指标,得到时间点。
-
SPL语句
* | extend ts = second_to_nano(__time__ - __time__ % 60) | stats latency_avg = avg(cast(latency as double)), inflow_avg = avg(cast (inflow as double)) by ts, Method -
输出结果
查询结果为包含 Method、ts、latency_avg、inflow_avg 四列的表格,按 Method 分组展示各 API 方法(如 DeleteMachineGroup、GetCursor、GetConsumerGroupCheckPoint、PostProjectQuery、PullData、TagResources 等)对应的纳秒级时间戳、平均延迟值和平均流入量统计数据。
-
-
SPL语句
* | extend ts = second_to_nano(__time__ - __time__ % 60) | stats latency_avg = max(cast(latency as double)), inflow_avg = min(cast (inflow as double)) by ts, Method | make-series latency_avg default = 'last', inflow_avg default = 'last' on ts from 'min' to 'max' step '1m' by Method -
输出结果
查询结果表格包含四列:Method、__ts__、latency_arr、inflow_arr。按 Method 分组展示两行数据:
PullData(latency_arr 值约 1219~1220,inflow_arr 全为 0.0)和UpdateMachineGroupMachine(inflow_arr 含 2.0 交替值)。各列以数组形式呈现对应的时间序列数据。
render
将SPL查询结果渲染为图表进行可视化。
-
render指令必须位于SPL查询的最后一个运算符。
-
render指令不修改数据,只将可视化参数添加到查询结果的拓展属性中。
语法
render visualization [with ( propertyName = propertyValue [, ...])]指令块
|
指令块 |
必填 |
说明 |
|
visualization |
是 |
指示要使用的可视化图表类型。支持的类型请参见Visualization。 |
|
propertyName = propertyValue |
否 |
键值属性对的分隔列表。支持类型请参见Properties。 |
参数说明
Visualization
|
Visualization |
Description |
|
linechart |
线图 |
Properties
PropertyName/PropertyValue 键值对指示渲染图表时要使用的额外信息。所有属性都是可选的。支持的属性:
渲染时序预测图的参数配置
|
PropertyName |
PropertyValue |
|
xcolumn |
查询结果中作为x轴的列名。 |
|
ycolumns |
查询结果中作为y轴的列名列表,以逗号分隔。 |
例如:
... ...
| render linechart with (xcolumn=time_series,
                         ycolumns=metric_series, forecast_metric_series)
渲染异常检测图的参数配置
|
PropertyName |
PropertyValue |
|
xcolumn |
查询结果中作为 x 轴的列名。 |
|
ycolumns |
查询结果中作为 y 轴的列名列表,以逗号分隔。 |
|
anomalyscore |
在图表上显示异常点的异常分数,仅作用于linechart。 |
|
anomalytype |
在图表上显示异常点的异常类型,仅作用于linechart。 |
例如:
... ...
| render linechart with (xcolumn=ts,
                         ycolumns=mem_arr, cpu_arr,
                         anomalyscore = anomalies_score_series,
                         anomalytype = anomalies_type_series)
示例
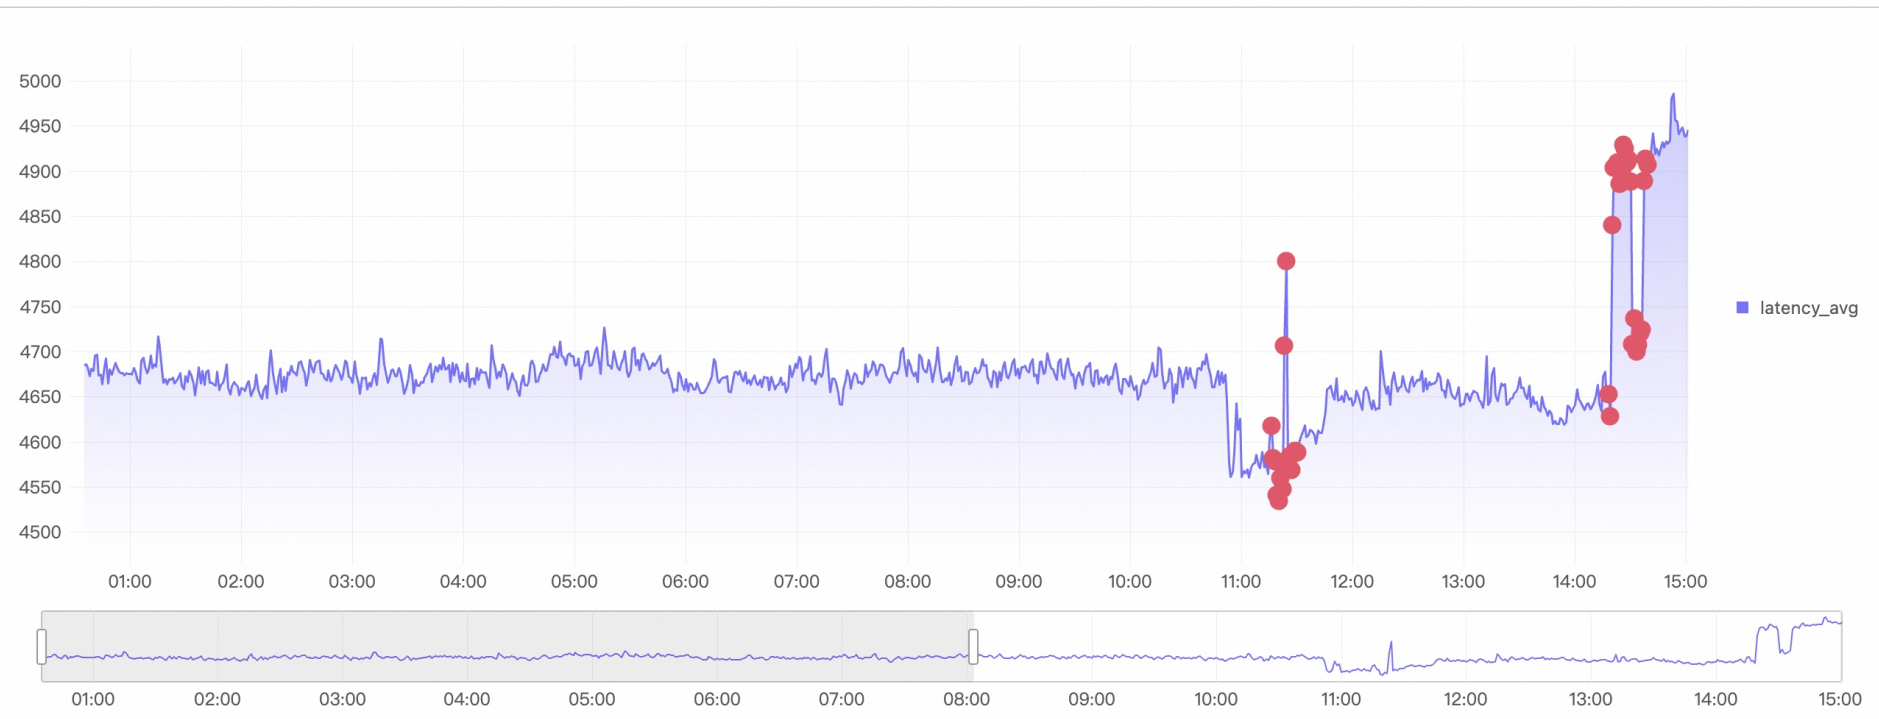
对所有时间线异常检测之后,保留最近 5 min 异常分数值,渲染异常检测图。
-
SPL语句
* | extend ts= (__time__- __time__%60)*1000000000 | where Method='PostLogStoreLogs' | stats latency_avg=avg(cast( Latency as bigint)) by ts, Method | make-series latency_avg = latency_avg default = 'null' on ts from 'min' to 'max' step '1m' by Method | extend ret = series_decompose_anomalies(latency_avg) | extend anomalies_score_series = ret.anomalies_score_series, anomalies_type_series = ret.anomalies_type_series, error_msg = ret.error_msg | render linechart with (xcolumn=__ts__, ycolumns=latency_avg, anomalyscore = anomalies_score_series, anomalytype = anomalies_type_series) -
输出结果