ACK Pro preset control plane observability
View the capacity and resource utilization metrics of the ACK Pro preset control plane. Determine whether a tier upgrade is required, and resolve control plane component resource utilization alerts before cluster performance degrades.
Applicable scope
-
The ACK Pro preset control plane is in use.
-
Use Default Alert Rule Template was selected when you created the cluster.
For an existing cluster, go to the Add-ons page on the details page of the target cluster. Then, install and upgrade the alicloud-monitor-controller add-on to the latest version to obtain the latest default alert rules.
Capacity planning monitoring
Core capacity metrics
The following three core capacity metrics define the tier specifications of the preset control plane. Each metric reflects a different aspect of control plane processing capability.
|
Metric |
Unit |
PromQL |
Description |
|
API Request Concurrency |
seats |
|
The tier specification defines the maximum API request concurrency in seats. The preset control plane ensures request processing capability in high-concurrency scenarios by allocating dedicated baseline resources to the API server. This monitoring metric is based on the Kubernetes API Priority and Fairness (APF) mechanism and reflects the number of concurrent requests being processed. |
|
Pod Scheduling Rate |
Pods/second |
|
The number of Pods the cluster scheduler schedules to nodes per second. The preset control plane provides predictable scheduling rates through a fixed resource quota, which prevents scheduling performance fluctuations caused by control plane elastic scaling. |
|
etcd Database Size |
GB |
|
The capacity available for storing all cluster data. When database usage approaches the upper limit of the current tier, upgrade the tier or clean up unused resources. |
View core capacity dashboard
-
On the Cluster Information page of the target cluster, click the Cluster Monitoring tab.
-
Compare the following capacity metrics with the ACK Pro preset control plane tier specifications for tier selection.
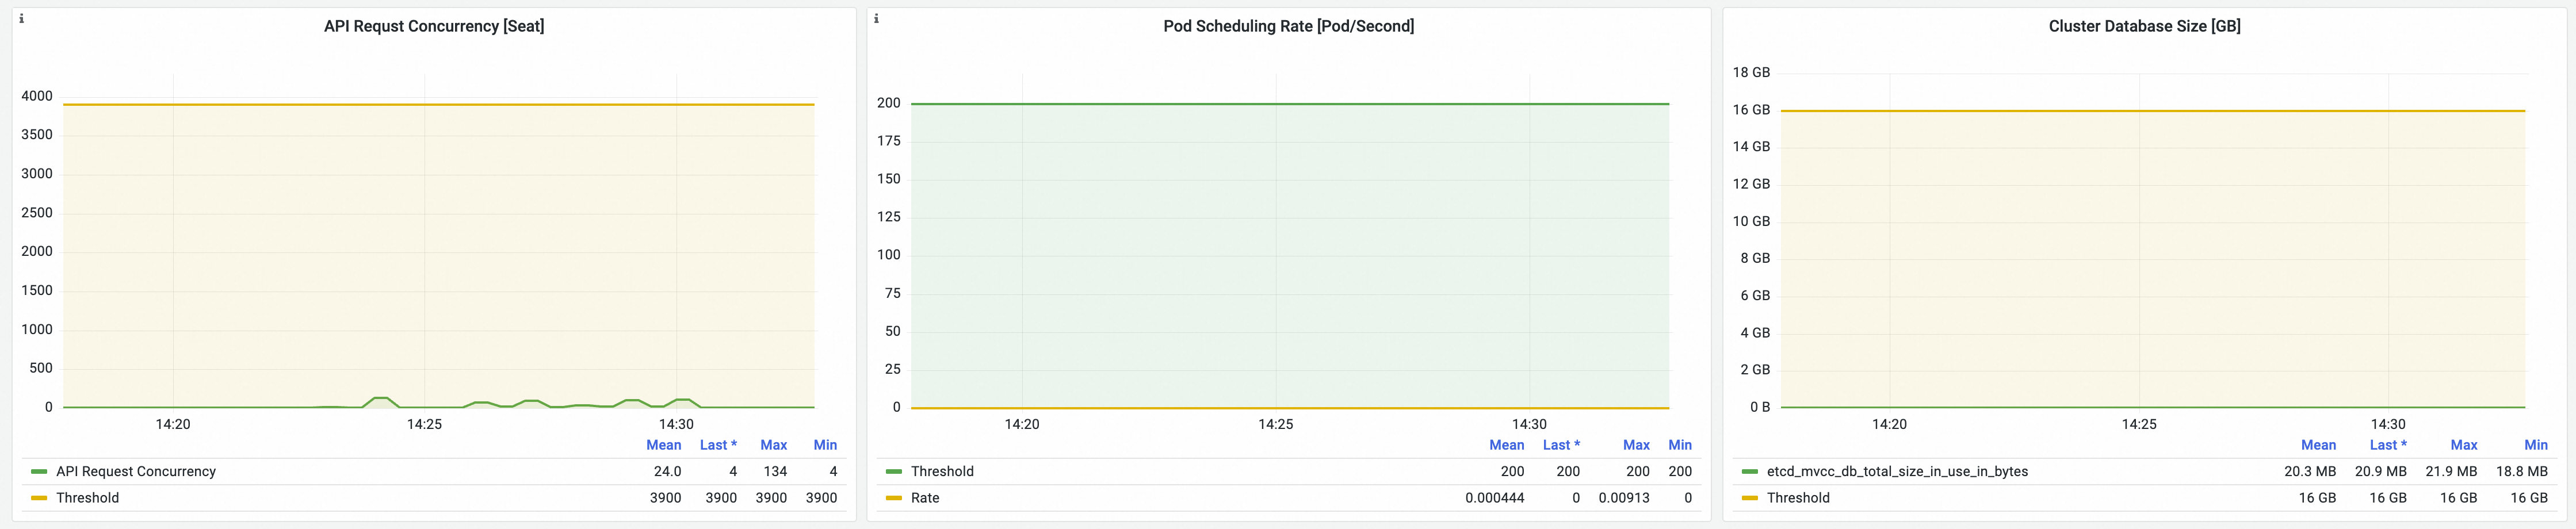
Focus on the following panels:
-
API Request Concurrency: Corresponds to the seats specification of the tier, which reflects the concurrent request load on the API server.
-
Pod Scheduling Rate: Shows the number of Pod scheduling requests processed per second, which indicates whether the scheduler is a bottleneck.
-
etcd Database Size (Cluster Database Size): Shows etcd storage usage, which indicates whether the data volume stays within the safe limit of the current tier.
-
When to upgrade the tier
When any of the following conditions occurs in the cluster, evaluate whether to upgrade the tier:
|
Dimension |
Upgrade reference condition |
Description |
|
API Request Concurrency |
The concurrent seats consistently reach 80% or more of the upper limit of the current tier. |
The API server is approaching its concurrency limit. Request queuing or HTTP 429 throttling may occur. |
|
Pod Scheduling Rate |
The scheduling rate consistently approaches the upper limit of the current tier, and pending Pods are accumulating. |
The scheduler has become a bottleneck and workload scaling is constrained. |
|
etcd Database Size |
The database usage exceeds 80% of the current tier capacity. |
Insufficient storage space may cause etcd to reject writes, which prevents any change to the cluster state. |
|
Control plane component resource utilization |
The CPU or memory utilization of any control plane component (such as kube-apiserver, etcd, and kube-scheduler) stays in the |
The resource allocation of the current tier is under pressure and may not support the actual workload. Upgrade the tier to obtain a larger resource quota. |
The preceding conditions are recommendations only. Base upgrade decisions on a comprehensive evaluation of your business scenarios, peak load periods, and their duration. Observe metric trends rather than momentary spikes, and plan upgrades before peak load periods.
Resource utilization monitoring and alerting
View resource utilization
-
On the details page of the target cluster, in the left-side navigation pane, choose Operations > Prometheus Monitoring.
-
Click the Key Component Monitoring tab, and then switch between the component tabs below. Focus on the memory and CPU resource utilization of the kube-apiserver, etcd, and kube-scheduler components.
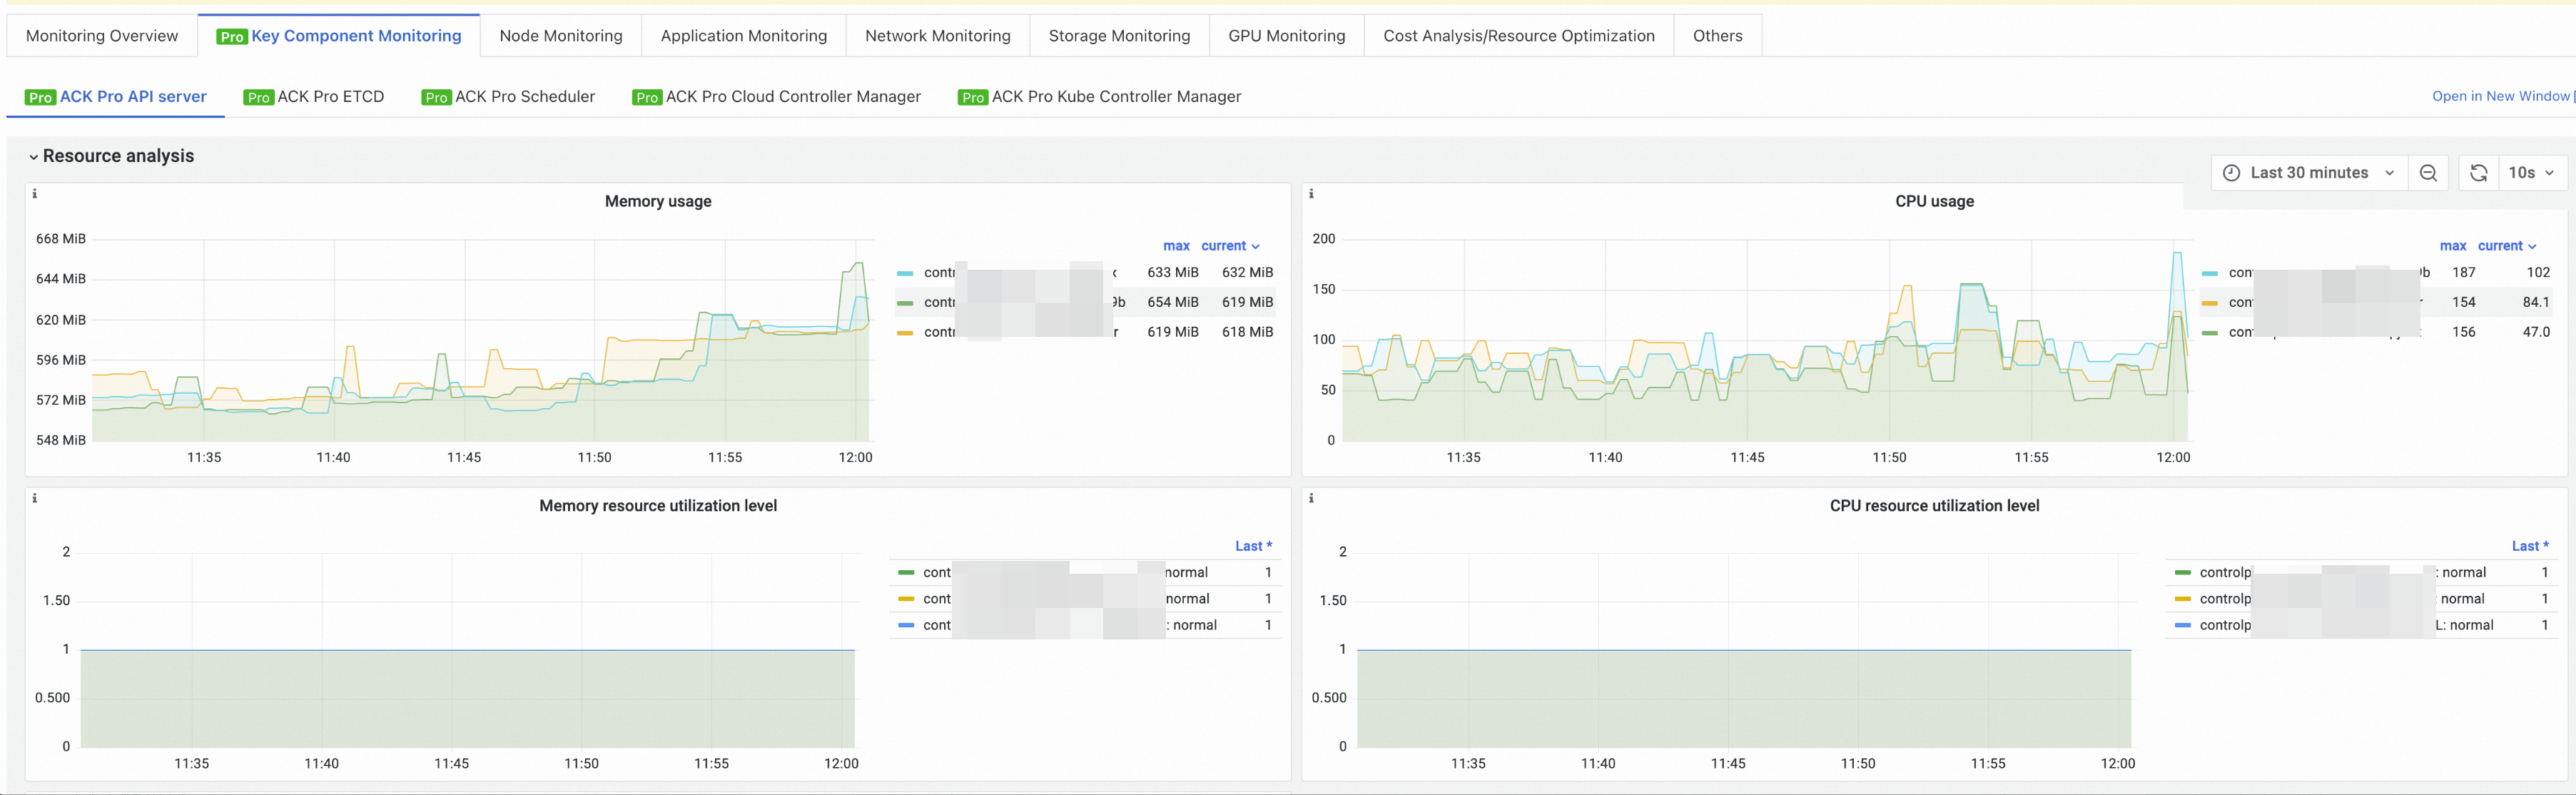
The following metrics measure resource utilization, with kube-apiserver as an example:
|
Resource type |
Metric |
Description |
|
Memory utilization |
|
A value of 1 indicates that memory utilization ≥ 80%. |
|
Memory utilization |
|
A value of 1 indicates that memory utilization < 80%. |
|
CPU utilization |
|
A value of 1 indicates that CPU utilization ≥ 80%. |
|
CPU utilization |
|
A value of 1 indicates that CPU utilization < 80%. |
When the utilization metrics stay in the high state (utilization ≥ 80%), the control plane is running short of resources. Upgrade the tier.
The preceding table uses kube-apiserver as an example. The container field also applies to other control plane components such as etcd, kube-scheduler, and kube-controller-manager.
The following metric measures storage utilization, with etcd as an example:
|
Resource type |
Metric |
Description |
|
etcd storage utilization |
|
The ratio of the used etcd storage space to the quota. A ratio of 0.85 or higher indicates that etcd storage utilization reaches or exceeds 85%. This condition triggers an alert. Upgrade the tier or clean up unused resources. |
Control plane component resource utilization alerting
The ACK Pro preset control plane is preconfigured with control plane component resource utilization alerts. ACK sends an alert when the CPU or memory utilization of any control plane component stays at or above 80%, or when etcd storage utilization reaches 85%.
|
Property |
Description |
|
Alert name |
High Memory Utilization of Control Plane Managed Component, High CPU Utilization of Control Plane Managed Component, and High etcd Storage Utilization. |
|
Trigger condition |
The CPU or memory utilization of a control plane managed component (such as kube-apiserver, etcd, and kube-scheduler) stays at or above 80%, or the etcd storage utilization reaches 85%. |
|
Notification method |
Notifications are sent through the alert contact group configured for the cluster. Supported channels include SMS, email, and DingTalk. |
|
Recommended action |
After receiving an alert, log on to the ACK console to check the resource utilization status. Upgrade the tier to prevent the control plane from degrading or becoming unavailable. |
The following example shows a memory utilization alert:
Alert Name: High Memory Utilization of Control Plane Managed Component_<cluster-name>
Alert Level: P1
Cluster Name: <cluster-name>
Alert Content: High memory utilization of control plane managed component
References
-
ACK Pro preset control plane tier specifications: Learn about the tier specifications, switching rules, and applicable scenarios of the ACK Pro preset control plane.