Troubleshoot pod issues

更新时间:
复制 MD 格式

Resolve pod scheduling failures, image pull errors, startup crashes, OOM kills, and runtime issues.

Note

For console-based troubleshooting — viewing pod status, events, logs, accessing terminals, and running diagnostics — see Common Troubleshooting Procedures.

Quick diagnostic procedure

To diagnose an abnormal pod, go to the details page of the target Pods. Click the Events tab to review the descriptions of abnormal events. Then, click the Logs tab to check for recent abnormal logs.

Pod in Pending state

If a Pod has an Unschedulable status in its Status Details or a FailedScheduling event appears in Events, go to Nodes > Nodes to check node health and resource levels (CPU and memory). Also check whether the pod's affinity rules — nodeSelector, nodeAffinity, and tolerations — are too restrictive. See Scheduling issues.

Image pull fails (ImagePullBackOff/ErrImagePull)

On the Pods details page, go to the Container tab and check the Image address. Log on to the pod's node and run crictl pull <image-address> or curl -v https://<image-address> to verify network connectivity to the image repository. In the upper-right corner, click Edit YAML and check that the Secret specified in the workload's spec.imagePullSecrets field exists and is valid. For further troubleshooting, see image pulling issues.

Pod fails to start (CrashLoopBackOff)

The application repeatedly crashes and restarts. On the Pods details page, click the Logs tab and select Show the log of the last container exit to view the cause of the failure. For further troubleshooting, see Troubleshoot pod startup failures.

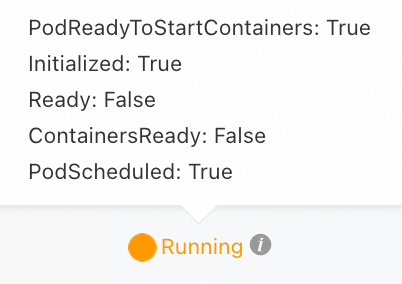
Pod Running but not ready

The pod's readiness probe failed. On the Edit page of the target Workloads, verify that the health check request path (for example, /healthz) and port match those provided by the application. For further troubleshooting, see The pod is Running but not ready (Ready: False).

Temporarily disable the health check, then use curl from the pod terminal or host node to verify the endpoint responds correctly.

Pod is OOMKilled

On the Pods details page, click the Logs tab and select Show the log of the last container exit to view OOM logs. Check if the application has a memory leak or an out-of-memory (OOM) error. For Java applications, you can optimize the -Xmx parameter. Adjust the application's memory resource limit (resources.limits.memory) as needed. For further troubleshooting, see OOMKilled.

If a liveness probe is configured, the pod remains in the OOMKilled state only briefly before it automatically restarts.

Diagnostic workflow

To diagnose an abnormal pod, inspect its events, logs, and configuration.

Troubleshooting workflow

image

Phase 1: Scheduling issues

Pod not scheduled to a node

If a pod remains in the Pending state for an extended period, it has not been scheduled to a node.

Error message

Description

Solution

no nodes available to schedule pods.

The cluster has no available nodes for pod scheduling.

  1. Check if any nodes in the cluster are in the NotReady state. If a node is NotReady, inspect and repair it.

  2. Check if the pod defines a nodeSelector, nodeAffinity, or taint tolerations. If no such scheduling constraints are defined, consider adding more nodes to the node pool.

  • 0/x nodes are available: x Insufficient cpu.

  • 0/x nodes are available: x Insufficient memory.

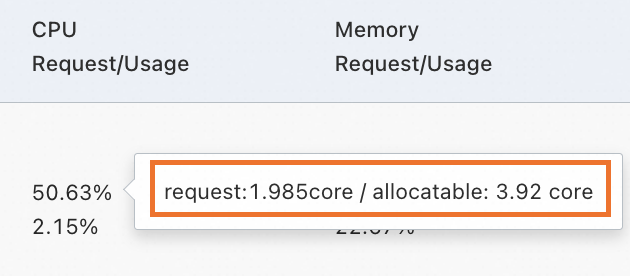
No available nodes in the cluster can meet the pod's CPU or memory resource requests.

A node is unschedulable when its total allocated requests reach capacity, even if actual utilization is low.

On the target cluster's details page, go to Nodes > Nodes and check the CPU or memory requests allocation rate for the target node. You can hover over the allocation rate to view the specific resource allocation values.

Request allocation

To view detailed node resource usage, see Use kubectl to view node resource usage.

  • Optimize resource configuration:

  • Clean up unnecessary workloads: Decommission or scale down non-essential pods.

  • Scale out the node pool: If the resource usage on the target nodes is consistently high, the nodes are saturated. You can scale out the node pool.

x node(s) didn't match pod's node affinity/selector.

The existing nodes do not match the pod's node affinity policy (nodeAffinity/nodeSelector). See Assigning Pods to Nodes.

  1. View all labels on a node.

    Console

    1. On the target cluster's details page, go to Nodes > Nodes.

    2. On the Nodes page, find the target node, and in the Actions column, click More > Manage Labels and Taints to view its labels.

    Kubectl

    Replace <YOUR_NODE_NAME> with your actual node name.

    kubectl get node <YOUR_NODE_NAME> --show-labels
  2. Check and adjust the node affinity rule for the workload (deployment).

    Console

    When creating a new workload:

    1. On the Advanced page for creating a Create Deployment, find Node Affinity in the Scheduling section, and click Add.

    2. Configure either Required (hard affinity) or Optional (soft affinity) based on your business needs. Multiple Selector have a logical AND relationship, while multiple Rule have a logical OR relationship.

    For existing workloads:

    1. On the Nodes > Nodes page, click image > Node Affinity in the Actions column of the target Deployment.

    2. The configuration method is the same as described above.

    YAML example

    NodeAffinity

    Affinity policies include hard affinity (requiredDuringSchedulingIgnoredDuringExecution), which must be met, and soft affinity (preferredDuringSchedulingIgnoredDuringExecution), which expresses a preference. The following example uses hard affinity.

    apiVersion: apps/v1
    kind: Deployment
    metadata:
      name: app-demo-node-affinity-deploy
      labels:
        app: demo-node-affinity
    spec:
      replicas: 2
      selector:
        matchLabels:
          app: demo-node-affinity
      template:
        metadata:
          labels:
            app: demo-node-affinity
        spec:
          containers:
          - name: nginx
            image: anolis-registry.cn-zhangjiakou.cr.aliyuncs.com/openanolis/nginx:1.14.1-8.6
          affinity:
            nodeAffinity:
              # Hard affinity: The rule must be met.
              requiredDuringSchedulingIgnoredDuringExecution:
                nodeSelectorTerms:
                - matchExpressions:
                  - key: disktype
                    operator: In
                    values:
                    - ssd
                    - nvme  # Logic: The node's 'disktype' label must be either 'ssd' or 'nvme'.

    NodeSelector

    This provides a simple exact match. The pod is scheduled only if the node's labels meet the conditions.

    apiVersion: apps/v1
    kind: Deployment
    metadata:
      name: app-demo-node-selector-deploy
      labels:
        app: demo-node-selector
    spec:
      replicas: 2  
      selector:
        matchLabels:
          app: demo-node-selector  
      template:
        metadata:
          labels:
            app: demo-node-selector
        spec:
          containers:
          - name: nginx
            image: anolis-registry.cn-zhangjiakou.cr.aliyuncs.com/openanolis/nginx:1.14.1-8.6
          # The pod is scheduled only if the node has the label disktype=ssd.
          nodeSelector:
            disktype: ssd
  • x node(s) didn't match pod affinity rules.

  • x node(s) didn't match pod anti-affinity rules.

  • Affinity rule mismatch. The pod has a pod affinity rule (for example, requiring a specific label), but no nodes host a pod with a matching label, preventing scheduling.

  • Anti-affinity conflict. The pod has a pod anti-affinity rule (for example, it cannot coexist with another application), but all available nodes already host a conflicting pod, preventing scheduling.

  1. View the pod labels on a node.

    Console

    1. On the target cluster's details page, go to Nodes > Nodes.

    2. On the Nodes page, click the name of the target node to view its details page. Scroll down to the Pods section to view the label values for different pods in the Label column.

    Kubectl

    • View pods and their labels on a specific node: Replace <YOUR_NAMESPACE> with your namespace name and <YOUR_NODE_NAME> with your actual node name.

      kubectl get pods -n <YOUR_NAMESPACE> --field-selector spec.nodeName=<YOUR_NODE_NAME> -o custom-columns=NAME:.metadata.name,LABELS:.metadata.labels
    • Query pods by label: Replace <LABEL> with the actual label key-value pair, such as app=nginx.

      kubectl get pods -A -l <LABEL> -o wide
  2. Check and adjust the pod affinity rule for the workload (deployment).

    Console

    1. When you create a new workload, on the Create Deployment's Advanced page, find Pod Affinity/Pod Anti-affinity in the Scheduling section, and click Add.

    2. Configure either Required (hard affinity) or Optional (soft affinity) based on your business needs. Multiple Selector have a logical AND relationship, while multiple Add Rule have a logical OR relationship.

    YAML example

    Affinity policies are classified into hard affinity (requiredDuringSchedulingIgnoredDuringExecution) and soft affinity (preferredDuringSchedulingIgnoredDuringExecution). Hard affinity rules must be met, while soft affinity rules are preferred. The following example shows a configuration for a required pod affinity.

    To configure pod anti-affinity, simply replace podAffinity with podAntiAffinity.

    apiVersion: apps/v1
    kind: Deployment
    metadata:
      name: app-demo-podaffinity-deploy
    spec:
      replicas: 2
      selector:
        matchLabels:
          app: demo-podaffinity
      template:
        metadata:
          labels:
            app: demo-podaffinity
        spec:
          containers:
          - name: nginx
            image: anolis-registry.cn-zhangjiakou.cr.aliyuncs.com/openanolis/nginx:1.14.1-8.6
          affinity:
            podAffinity:
              # Hard affinity: Pod must be co-located with a pod that has the 'app: nginx' label.
              requiredDuringSchedulingIgnoredDuringExecution:
              - labelSelector:
                  matchExpressions:
                  - key: app
                    operator: In
                    values:
                    - nginx
                # Topology domain scope: host-level isolation.
                topologyKey: kubernetes.io/hostname

0/x nodes are available: x node(s) had volume node affinity conflict.

Scheduling fails due to a volume node affinity conflict. This typically occurs because a cloud disk cannot be mounted across different zones.

  • For a statically provisioned PV, configure the pod's node affinity to ensure it is scheduled to a node in the same zone as the PV.

  • For a dynamically provisioned PV, set the volumeBindingMode of the StorageClass to WaitForFirstConsumer. This ensures that the PV is created only after the pod has been scheduled to a node, ensuring the cloud disk is created in the same zone as the pod's node.

InvalidInstanceType.NotSupportDiskCategory

The ECS instance does not support the specified cloud disk type.

See Instance families to confirm the cloud disk types supported by your ECS instance. When mounting, update the cloud disk type to one that is supported by the ECS instance.

0/x nodes are available: x node(s) had taints that the pod didn't tolerate.

The pod cannot be scheduled to a node because it lacks a toleration for one of the node's taints.

  • If the taint was added manually, remove it or configure a toleration for the pod. See Taints and Tolerations and Manage node labels and taints.

  • If the taint was added by the system, resolve the underlying issue below and wait for rescheduling.

    View taints added by the system

    • node.kubernetes.io/not-ready: The node is in the NotReady state.

    • node.kubernetes.io/unreachable: The node is unreachable from the node controller. This is equivalent to the node's Ready status being Unknown.

    • node.kubernetes.io/memory-pressure: The node is under memory pressure.

    • node.kubernetes.io/disk-pressure: The node is under disk pressure.

    • node.kubernetes.io/pid-pressure: The node is under PID pressure.

    • node.kubernetes.io/network-unavailable: The node's network is unavailable.

    • node.kubernetes.io/unschedulable: The node is marked as unschedulable.

0/x nodes are available: x Insufficient ephemeral-storage.

The node has insufficient ephemeral storage.

  1. Check the Pod's ephemeral storage request, which is the value of spec.containers.resources.requests.ephemeral-storage in the Pod YAML. If the value is too high and exceeds the actual available capacity of the node, the Pod will fail to be scheduled.

  2. Check the total ephemeral storage capacity on each node with kubectl describe node | grep -A10 Capacity. If insufficient, expand the node's disk or add more nodes.

0/x nodes are available: pod has unbound immediate persistent volume claims.

The pod failed to bind to a persistent volume claim (PVC).

Check if the PVC or PV specified by the pod has been created. Run kubectl describe pvc <pvc-name> or kubectl describe pv <pv-name> to view PVC and PV events for further diagnosis. See Storage FAQ - CSI.

Pod is scheduled but remains Pending

If a pod has been scheduled but remains Pending, follow these steps.

  1. If a pod uses hostPort, only one pod with that hostPort can run per node, so hostPort limits the Replicas count to the number of nodes. If the port is already in use, scheduling fails.

    hostPort adds scheduling complexity. Use a Service to expose pods instead.

  2. If the Pod is not configured with hostPort, follow the steps below to troubleshoot.

    1. View the pod's events with kubectl describe pod <pod-name>. Common causes include image pull failures, insufficient resources, security policy restrictions, and configuration errors.

    2. If no useful events are found, check kubelet logs on the node with grep -i <pod name> /var/log/messages* | less.

Phase 2: Image pull issues

ImagePullBackOff or ErrImagePull

A pod status of ImagePullBackOff or ErrImagePull indicates that the image pull failed. Examine the pod events to identify the cause.

Error message

Description

Suggested solution

Failed to pull image "xxx": rpc error: code = Unknown desc = Error response from daemon: Get xxx: denied:

Access to the image repository is denied because an imagePullSecret was not specified when the pod was created.

Verify that the Secret specified in the spec.imagePullSecrets field of the workload's YAML file exists.

When using ACR, use a credential helper to pull images without a password. See Pull images from the same account.

Failed to pull image "xxxx:xxx": rpc error: code = Unknown desc = Error response from daemon: Get https://xxxxxx/xxxxx/: dial tcp: lookup xxxxxxx.xxxxx: no such host

The image repository address could not be resolved when pulling an image over HTTPS.

  1. Verify that the image repository address in spec.containers.image of the pod's YAML file is correct. If it is incorrect, update it.

  2. If the address is correct, verify the network connectivity from the node where the pod is running to the image repository. Log on to the node (for more information, see Choose an ECS remote connection method) and run the curl -kv https://xxxxxx/xxxxx/ command to check if the address is accessible. If an error occurs, investigate for potential network issues, such as incorrect network configuration, firewall rules, or DNS resolution problems.

Failed create pod sandbox: rpc error: code = Unknown desc = failed to create a sandbox for pod "xxxxxxxxx": Error response from daemon: mkdir xxxxx: no space left on device

The node has insufficient disk space.

Log on to the node (see Choose an ECS remote connection method) and run df -h to check disk space. If the disk is full, resize it. See Step 1: Resize a cloud disk.

Failed to pull image "xxx": rpc error: code = Unknown desc = error pulling image configuration: xxx x509: certificate signed by unknown authority

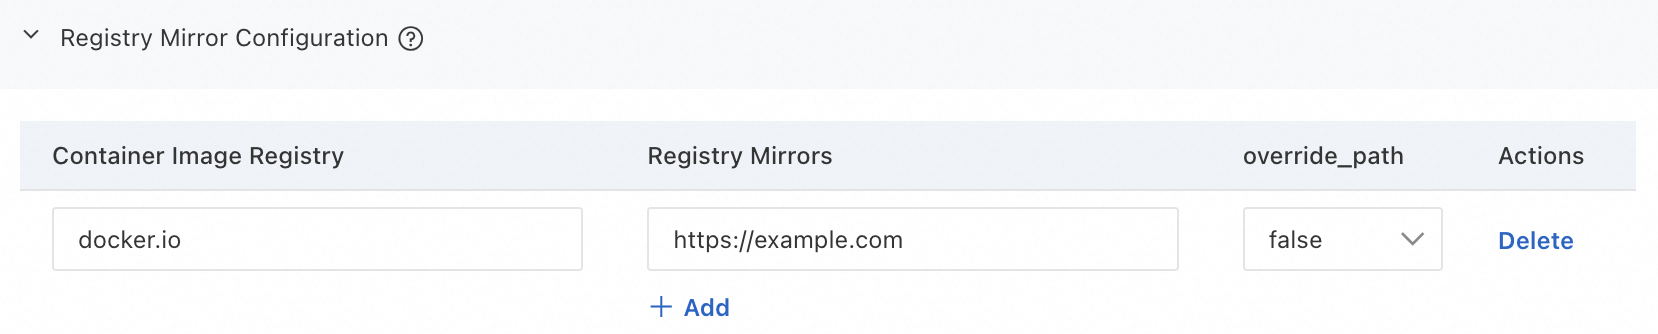
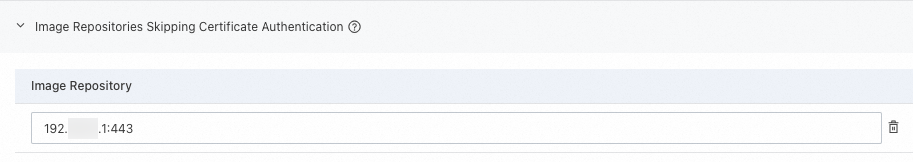
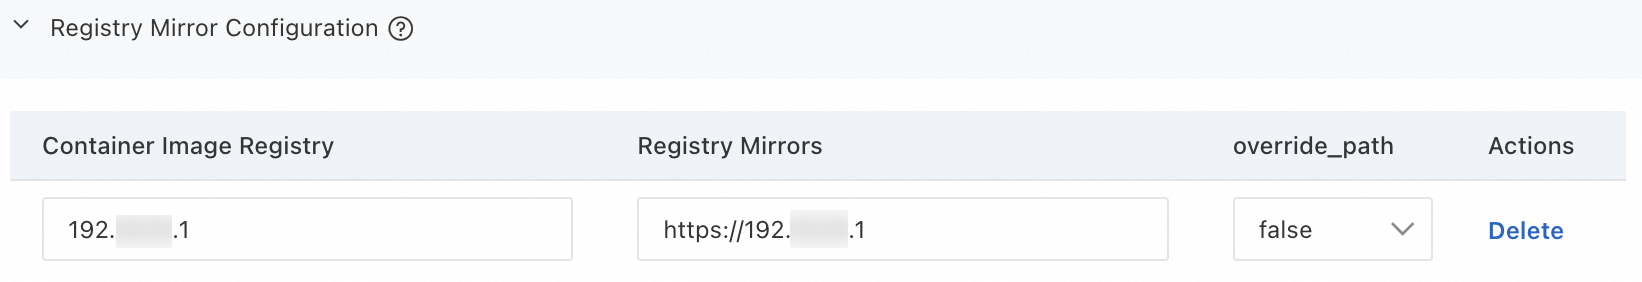
The third-party image repository uses a certificate signed by an unknown or insecure Certificate Authority (CA).

  1. The third-party repository should use a certificate issued by a trusted CA.

  2. If you are using a private image repository, see Create an application from a private image repository.

  3. If you cannot change the certificate, you can configure the node to allow pulling and pushing images from a repository that uses an insecure certificate. We recommend using this method only in test environments, as it may affect other pods on the node.

View detailed steps

Console

Configure containerd parameters using the console

Important

This change does not affect existing containers. To keep your cluster stable, perform this operation during off-peak hours.

  1. Log on to the ACK console. In the left navigation pane, click Clusters.

  2. On the Clusters page, click the name of your cluster. In the left navigation pane, click Nodes > Node Pools.

  3. On the node pool list page, click image > Containerd Configuration in the Actions column of the target node pool.

  4. Read the important notes on the current page. Add the parameters you need, select the target nodes, and set the batch configuration policy. Then click Submit. > See the configuration examples below.

    • Removing a container runtime configuration parameter reverts it to its default value automatically.

    • After you click Submit, the configuration applies to nodes in batches. You can track progress and control execution in the Events section — pause, resume, or cancel as needed. If a node task fails, troubleshoot the node and click Continue to retry. When you pause, nodes currently being configured finish applying the changes before pausing. Nodes not yet started wait until you resume. Complete the task as soon as possible — tasks paused for more than 7 days are canceled automatically, and the related events and logs are cleaned up.

Configuration examples

Configure a replacement image repository for docker.io

Skip certificate verification for a private repository

Configure an HTTP private image repository

image

image

image

CLI

  1. Create a certificate directory for containerd to store certificate configuration files for specific image repositories.

    mkdir -p /etc/containerd/cert.d/xxxxx
  2. Configure containerd to trust a specific insecure image repository.

    cat << EOF > /etc/containerd/cert.d/xxxxx/hosts.toml
       server = "https://harbor.test-cri.com"
       [host."https://harbor.test-cri.com"]
         capabilities = ["pull", "resolve", "push"]
         skip_verify = true
         # ca = "/opt/ssl/ca.crt"  # Or upload a CA certificate
       EOF
  3. Modify the Docker daemon configuration to add the insecure repository.

    vi /etc/docker/daemon.json

    Add the following content. Replace your-insecure-registry with your private repository's address.

       {
         "insecure-registries": ["your-insecure-registry"]
       }
  4. Restart the containerd service for the changes to take effect.

    systemctl restart containerd

Failed to pull image "XXX": rpc error: code = Unknown desc = context canceled

The operation was canceled, possibly because the image file is too large. Kubernetes has a default timeout for pulling images. If the pull makes no progress for a specific period, Kubernetes assumes the operation has failed or is unresponsive and cancels the task.

  1. Verify that imagePullPolicy is set to IfNotPresent in the pod's YAML file.

  2. Log on to the node where the pod is running (for more information, see Choose an ECS remote connection method) and run docker pull or crictl pull to check if the image can be pulled.

Failed to pull image "xxxxx": rpc error: code = Unknown desc = Error response from daemon: Get https://xxxxxxx: xxxxx/http: request canceled while waiting for connection (Client.Timeout exceeded while awaiting headers)

Cannot connect to the image repository due to network issues.

  1. Log on to the node where the pod is running (for more information, see Choose an ECS remote connection method) and run the curl https://xxxxxx/xxxxx/ command to check if the address is accessible. If an error occurs, investigate for potential network issues, such as incorrect network configuration, firewall rules, or DNS resolution problems.

  2. Verify the node's public network policy, including configurations for SNAT entries and bound Elastic IP Addresses (EIPs).

Failed to pull image "xxxx:xxx": failed to pull and unpack image "xxxx:xxx": failed to resolve reference "xxxx:xxx": failed to do request: Head "xxxx:xxx": dial tcp xxx.xxx.xx.x:xxx: i/o timeout

Connection timed out due to network issues when pulling an image from an overseas repository.

Pulling images from overseas repositories, such as Docker Hub, may fail in ACK clusters due to unstable carrier networks. To resolve this, consider the following solutions:

Too Many Requests.

Docker Hub imposes rate limits on image pull requests.

Upload the image to Container Registry (ACR) and pull it from an ACR image repository.

The status Pulling image is consistently displayed

The kubelet's image pull rate limiting mechanism may have been triggered.

Adjust the registryPullQPS (maximum QPS for the image repository) and registryBurst (maximum number of burst image pulls) using the Customize node pool kubelet configurations feature.

Phase 3: Startup issues

Pod is in the Init state

Error message

Description

Solution

Stuck in the Init:N/M state

The pod has M init containers; N completed, but the remaining M-N failed to start.

  1. Check the pod's events and init container issues with kubectl describe pod -n <ns> <pod name>.

  2. Check the logs of the unstarted init containers with kubectl logs -n <ns> <pod name> -c <container name>.

  3. Review the pod's configuration, such as the health check settings, to ensure the init containers are configured correctly.

See Debug init containers.

Stuck in the Init:Error state

An init container in the pod failed to start.

Stuck in the Init:CrashLoopBackOff state

An init container in the pod failed to start and is in a restart loop.

Pod is in the Creating state

Error message

Description

Solution

failed to allocate for range 0: no IP addresses available in range set: xx.xxx.xx.xx-xx.xx.xx.xx

This is expected behavior due to the design of the Flannel network plugin.

Upgrade the Flannel component to v0.15.1.11-7e95fe23-aliyun or later. See Flannel.

In clusters that run a Kubernetes version earlier than 1.20, an IP address leak can occur if a pod restarts repeatedly or if pods from a CronJob complete their tasks and exit quickly.

Upgrade the cluster to Kubernetes 1.20 or later (latest recommended). See Manually upgrade a cluster.

Defects in containerd and runC cause this issue.

For an emergency fix, see Why does my pod fail to start with the error "no IP addresses available in range"?

error parse config, can't found dev by mac 00:16:3e:01:c2:e8: not found

The Terway network plugin maintains an internal database on the node to track and manage elastic network interfaces (ENIs). This error occurs when the database state is inconsistent with the actual network device configuration, causing ENI allocation to fail.

  1. Network interfaces load asynchronously. The interface might still be loading during CNI configuration, which triggers an automatic CNI retry. This process does not affect the final ENI allocation. Check the pod's final status to confirm success.

  2. If pod creation still fails and this error persists, the driver likely failed to load the ENI due to insufficient high-order memory. Restart the ECS instance to resolve this.

  • cmdAdd: error alloc ip rpc error: code = DeadlineExceeded desc = context deadline exceeded

  • cmdAdd: error alloc ip rpc error: code = Unknown desc = error wait pod eni info, timed out waiting for the condition

The Terway network plugin may have failed to request an IP address from the vSwitch.

  1. View the logs of the Terway container within the Terway component pod on the node to check the ENI allocation process.

  2. View ENI information for the Terway pod with kubectl logs -n kube-system  <terwayPodName > -c terway | grep <podName>. Obtain the Request ID and OpenAPI error message.

  3. Use the Request ID and error message to investigate the failure.

Pod fails to start (CrashLoopBackOff)

Error message

Description

Solution

The log contains exit(0).

  1. Log on to the node where the abnormal workload is deployed.

  2. Use docker ps -a | grep $podName to check. If the container has no persistent process, it exits with status code 0.

The pod's events show Liveness probe failed: ....

The liveness probe failed, causing the application to restart.

  • Liveness probe configuration: On the Edit page of the target Workloads, verify that the health check request path (for example, /healthz) and port match those that the application provides. Increase the Initial Delay (s) to ensure the liveness probe starts only after the application has fully launched.

    You can temporarily disable the Liveness. Then, access the pod terminal or its host node and use a command, such as curl, to verify that the health check method works correctly.
  • Troubleshoot application issues: Investigate the issue by checking the pod's Events and Log. Select Show the log of the last container exit.

The pod's events show Startup probe failed: ....

The startup probe failed, causing the application to restart.

  • Startup probe configuration: On the Edit page of the target Workloads, verify that the health check request path (for example, /healthz) and port match those that the application provides. If the application takes a long time to start, increase the Unhealthy Threshold to prevent premature restarts.

    You can temporarily disable the Startup. Then, access the pod terminal or its host node and use a command, such as curl, to verify that the health check method works correctly.
  • Troubleshoot application issues: Investigate the issue by checking the pod's Events and Logs. Select Show the log of the last container exit.

The pod log contains no space left on device.

Insufficient cloud disk space.

  • Resize the cloud disk.

  • Clean up unnecessary images to free up disk space, and configure imageGCHighThresholdPercent to set the threshold for image garbage collection on the node.

Startup fails without event information.

This issue occurs when a container requires more resources than its declared limits, causing it to fail.

Check whether the pod's resource configuration is correct. You can enable resource profiling to get recommended Request and Limit configurations for the container.

The pod log shows Address already in use.

A port conflict exists between containers in the same pod.

  1. Check whether the pod is configured with hostNetwork: true. This setting causes containers in the pod to share the host's network namespace and port space. If this is not required, change it to hostNetwork: false.

  2. If the pod requires hostNetwork: true, configure pod anti-affinity to ensure that pods from the same replica set are scheduled to different nodes.

  3. Verify that no other pod on the same node is using the port.

The pod log shows container init caused "setenv: invalid argument": unknown.

The workload mounts a Secret, but the value in the Secret is not Base64-encoded.

  • Create the Secret in the console (values are auto-Base64-encoded). See Manage Secrets.

  • Create the Secret from a YAML file and manually Base64-encode the value by running the echo -n "xxxxx" | base64 command.

Application-specific issue.

Examine the pod logs to troubleshoot the issue.

Pod is Running but not ready (Ready: False)

Error message

Description

Solution

image The pod's events show Readiness probe failed: ....

The readiness probe failed, preventing the target pod from receiving traffic.

  • Readiness probe configuration: On the Edit page of the target Workloads, verify that the health check path (for example, /healthz) and port match the application's. If the application starts slowly, increase the Unhealthy Threshold to avoid premature failures.

    Temporarily disable Readiness, then use curl from the pod terminal or host to verify the health check endpoint.
  • Troubleshoot application issues: Investigate the issue by checking the pod's Events and Logs. Select Show the log of the last container exit.

The pod status is the same as above. The pod's events show Startup probe failed: ....

A failed startup probe causes the container to restart. This error should not result in a persistent Running/NotReady state but rather a 'CrashLoopBackOff' state.

Troubleshoot this issue as described in the "Pod fails to start (CrashLoopBackOff)" section for Startups.

Phase 4: Pod runtime issues

OOMKilled

When a container exceeds its memory limit, it is terminated by an OOM kill. See Assign Memory Resources to Containers and Pods.

  • If the terminated process is the container's main process, the container might restart unexpectedly.

  • When an OOM event occurs, it appears on the Events tab of the pod details page in the console, such as pod was OOM killed. node:XXX pod:XXX namespace:XXX.

  • Configure a container replica exception alert to receive OOM notifications.

OOM level

Description

Recommended solution

OS level

Check the kernel log at /var/log/messages on the pod's node. If the log shows a killed process but contains no cgroup logs, the OOM event occurred at the OS level.

cgroup level

Check the kernel log at /var/log/messages on the pod's node. If the log contains an error message similar to Task in /kubepods.slice/xxxxx killed as a result of limit of /kubepods.slice/xxxx, the OOM event occurred at the cgroup level.

See Causes and solutions for OOM Killer.

Terminating

Possible cause

Description

Recommended solution

The node is in the NotReady state.

The pod is automatically deleted after the node recovers from the NotReady state.

The pod is configured with finalizers.

If a pod is configured with finalizers, Kubernetes performs the cleanup operations specified by the finalizers before deleting the pod. If a cleanup operation fails to respond, the pod remains in the Terminating state.

Check the pod's finalizer configuration with kubectl get pod -n <ns> <pod name> -o yaml and investigate the cause.

The pod's preStop hook is invalid or stuck.

If a preStop hook is configured for the pod, Kubernetes executes the hook before terminating the container. The pod remains in the Terminating state while the hook is running.

Check the pod's preStop hook configuration with kubectl get pod -n <ns> <pod name> -o yaml and investigate the cause.

A graceful shutdown period is configured for the pod.

If a Pod is configured with a graceful shutdown period (terminationGracePeriodSeconds), the Pod enters the Terminating state after it receives a termination command, such as kubectl delete pod <pod_name>. Kubernetes considers the Pod to be successfully shut down only after the time specified in terminationGracePeriodSeconds elapses or the container exits.

Kubernetes automatically deletes the pod after the container completes a graceful shutdown.

The container is unresponsive.

When you request to stop or delete a pod, Kubernetes sends a SIGTERM signal to the containers in the pod. If a container does not correctly handle the SIGTERM signal during termination, the pod may remain in the Terminating state.

  1. Forcefully delete the pod with kubectl delete pod <pod-name> --grace-period=0 --force.

  2. Check the containerd or Docker logs on the pod's node to investigate further.

Evicted

Possible cause

Description

Recommended solution

The node is under resource pressure from factors like memory or disk usage.

The node may be experiencing memory pressure, disk pressure, or PID pressure.

  • Check node taints with kubectl describe node <node name> | grep Taints. The output may include:

    • Memory pressure: The node has the node.kubernetes.io/memory-pressure taint.

    • Disk pressure: The node has the node.kubernetes.io/disk-pressure taint.

    • PID pressure: The node has the node.kubernetes.io/pid-pressure taint.

  • The pod status is one of the following:

    • Evicted

    • ContainerStatusUnknown, and the reason field in the pod's YAML file shows Evicted.

An unexpected eviction occurs.

A manually added NoExecute taint on the pod's node caused an unexpected eviction.

Check for a NoExecute taint with kubectl describe node <node name> | grep Taints. If one exists, remove it.

Eviction does not proceed as expected.

  • --pod-eviction-timeout: Pods on a failed node are evicted after this timeout period. The default is 5 minutes.

  • --node-eviction-rate: The number of pods evicted from a node per second. The default is 0.1, meaning at most one pod is evicted from a node every 10 seconds.

  • --secondary-node-eviction-rate: The secondary node eviction rate. If too many nodes in a cluster fail, the eviction rate is reduced to this value. The default is 0.01.

  • --unhealthy-zone-threshold: The unhealthy availability zone threshold. The default is 0.55. When the fraction of failed nodes in an availability zone exceeds this threshold, the zone is considered unhealthy.

  • --large-cluster-size-threshold: The large cluster size threshold. The default is 50. A cluster is considered large when it has more than 50 nodes.

In a small cluster (50 nodes or fewer), if more than 55% of nodes fail, pod eviction stops. See Rate limits on eviction.

In a large cluster (more than 50 nodes), if the fraction of unhealthy nodes exceeds the --unhealthy-zone-threshold (default 0.55), the eviction rate drops to --secondary-node-eviction-rate (default 0.01 pods per second). See Rate limits on eviction.

A pod is frequently rescheduled to its original node after being evicted.

The kubelet evicts pods based on actual resource usage, whereas the scheduler places pods based on resource requests. Because an eviction frees up resources, the scheduler might reschedule a pod to the same node if its requests still fit.

Adjust the pod's resource requests to fit the node's allocatable resources. See Set CPU and memory resources for a container. Enable resource profiling to get recommended request and limit values.

Completed

All containers exited successfully. Common for jobs and init containers.

FAQ

Pod is running but not working

YAML errors can cause a pod to enter Running but fail to function.

  1. Verify the container settings in the pod's configuration.

  2. Use the following methods to check your YAML configuration for spelling errors.

    If a YAML key is misspelled (for example, command as commnd), the cluster creates the resource without error but cannot execute the misspelled key at runtime.

    The following example, in which command is misspelled as commnd, describes how to troubleshoot spelling issues.

    1. Add --validate to kubectl apply -f and run kubectl apply --validate -f XXX.yaml .

      If you misspell a word, an error is reported: XXX] unknown field: commnd XXX] this may be a false alarm, see https://gXXXb.XXX/6842pods/test.

    2. Compare the output pod.yaml with the original YAML file used to create the pod.

      Note

      [$Pod] is the name of the abnormal Pod, which you can obtain by running the kubectl get pods command.

        kubectl get pods [$Pod] -o yaml > pod.yaml
      • If the pod.yaml file has more lines than the original file, it means the pod was created as expected, and the cluster added default values.

      • If lines from your original YAML file are missing from pod.yaml, this indicates a spelling error in your original file.

  3. Check the pod's logs to troubleshoot the issue.

  4. Access the container through a terminal and verify that the local files within the container are as expected.

Check node resource usage with kubectl

  1. Check the CPU and memory usage of all nodes in the cluster.

    kubectl describe nodes | awk '/^Name:/{print "\n"$2} /Resource +Requests +Limits/{print $0} /^[ \t]+cpu.*%/{print $0} /^[ \t]+memory.*%/{print $0}'

    Expected output:

    cn-hangzhou.192.168.0.xxx
      Resource           Requests      Limits
      cpu                1725m (44%)   10320m (263%)
      memory             1750Mi (11%)  16044Mi (109%)
    
    cn-hangzhou.192.168.16.xxx
      Resource           Requests      Limits
      cpu                1885m (48%)   16820m (429%)
      memory             2536Mi (17%)  25760Mi (179%)

    A node with high request utilization may be unable to satisfy the requests of a new Pod, preventing the Pod from being scheduled.

  2. Replace YOUR_NODE_NAME with the actual node name to view the resource usage of all Pods on the node.

    kubectl describe node YOUR_NODE_NAME | awk '/Non-terminated Pods/,/Allocated resources/{ if ($0 !~ /Allocated resources/) print }'

    Expected output:

    Non-terminated Pods:          (11 in total)
      Namespace                   Name                                                        CPU Requests  CPU Limits   Memory Requests  Memory Limits  Age
      ---------                   ----                                                        ------------  ----------   ---------------  -------------  ---
      arms-prom                   node-exporter-gp95p                                         20m (0%)      1020m (26%)  160Mi (1%)       1152Mi (7%)    6d21h
      csdr                        csdr-velero-77c8bbc9c7-w46lq                                500m (12%)    1 (25%)      128Mi (0%)       2Gi (13%)      6d19h
      kube-system                 ack-cost-exporter-5b647ffc65-zdrsl                          100m (2%)     1 (25%)      200Mi (1%)       1Gi (6%)       6d21h
      kube-system                 ack-node-local-dns-admission-controller-5dfd74f5f4-9rl6n    100m (2%)     1 (25%)      100Mi (0%)       1Gi (6%)       6d21h
      kube-system                 ack-node-problem-detector-daemonset-6wql2                   200m (5%)     1200m (30%)  300Mi (2%)       1324Mi (9%)    6d21h
      kube-system                 coredns-7784559f6-dr9sn                                     100m (2%)     0 (0%)       100Mi (0%)       2Gi (13%)      6d21h
      kube-system                 csi-plugin-knz7j                                            130m (3%)     2 (51%)      176Mi (1%)       4Gi (27%)      6d21h
      kube-system                 kube-proxy-worker-rkbzv                                     100m (2%)     0 (0%)       100Mi (0%)       0 (0%)         6d21h
      kube-system                 loongcollector-ds-kw7cj                                     100m (2%)     2 (51%)      256Mi (1%)       2Gi (13%)      6d21h
      kube-system                 node-local-dns-pgzcn                                        25m (0%)      0 (0%)       30Mi (0%)        1Gi (6%)       6d21h
      kube-system                 terway-eniip-lnn8n                                          350m (8%)     1100m (28%)  200Mi (1%)       256Mi (1%)     6d21h

    You can adjust the requests configuration based on actual resource consumption.

Intermittent network disconnections from pods to databases

If a pod intermittently disconnects from a database, follow these steps.

1. Check pod
  • Check the pod's events for signs of connection instability, such as network issues, restarts, or insufficient resources.

  • Check the pod's logs for any error messages related to the database connection, such as timeouts, authentication failures, or reconnection triggers.

  • Monitor the pod's CPU and memory usage to ensure resource exhaustion does not cause the application or database driver to crash.

  • Review the pod's resource requests and limits to ensure it has sufficient CPU and memory.

2. Check node
  • Check the node for resource shortages (memory, disk). See Monitor nodes.

  • Test for intermittent network disruptions between the node and the target database.

3. Check database
  • Check the status and performance metrics of the database for any restarts or performance bottlenecks.

  • Review the number of abnormal connections and the connection timeout settings, and adjust them based on your application's requirements.

  • Inspect the database logs for any records related to disconnections.

4. Check cluster component status

Faulty cluster components can disrupt a pod's network communication.

kubectl get pod -n kube-system  # Check the status of component pods.

Also, check the following network components:

  • CoreDNS: Check the component's status and logs to ensure the pod can correctly resolve the database service address.

  • Flannel: Check the status and logs of the kube-flannel component.

  • Terway: Check the status and logs of the terway-eniip component.

5. Analyze network traffic

You can use tcpdump to capture packets and analyze network traffic to help identify the cause of the problem.

  1. Get Pod and node information:

    List pods and their nodes in a specific namespace:

    kubectl  get pod -n [namespace] -o wide 
  2. Log on to the target node and run the following commands to find the container PID.

    Containerd

    1. View the container CONTAINER.

      crictl ps |grep <Pod name keyword>

      Expected output:

      CONTAINER           IMAGE               CREATED             STATE                      
      a1a214d2*****       35d28df4*****       2 days ago          Running
    2. View the container PID using the CONTAINER ID.

      crictl inspect a1a214d2***** |grep -i PID

      Expected output:

          "pid": 2309838,    # The PID of the target container.
                  "pid": 1
                  "type": "pid"

    Docker

    1. View the container's CONTAINER ID.

      docker ps |grep <pod name keyword>

      Expected output:

      CONTAINER ID        IMAGE                  COMMAND     
      a1a214d2*****       35d28df4*****          "/nginx
    2. View the container PID using the CONTAINER ID.

      docker inspect  a1a214d2***** |grep -i PID

      Expected output:

                  "Pid": 2309838,  # The PID of the target container.
                  "PidMode": "",
                  "PidsLimit": null,
  3. Capture packets.

    Capture network packets between the pod and the target database using the container PID.

    nsenter -t <container PID> tcpdump -i any -n -s 0 tcp and host <database IP address> 

    Capture network packets between the pod and the host using the container PID.

    nsenter -t <container PID> tcpdump -i any -n -s 0 tcp and host <node IP address>

    Capture network packets between the host and the database.

    tcpdump -i any -n -s 0 tcp and host <database IP address> 
6. Optimize application
  • Implement an automatic reconnection mechanism in your application to ensure it can restore connections automatically during a database switchover or migration.

  • Use persistent connections instead of short-lived connections to communicate with the database. Persistent connections can significantly reduce performance overhead and resource consumption, improving overall system efficiency.

Console troubleshooting

Log on to the ACK console and go to the details page of your cluster to troubleshoot Pod issues.

Actions

Console

Check the status of a Pod

  1. On the Clusters page, click the name of your cluster. In the left navigation pane, click Workloads > Pods.

  2. In the upper-left corner of the Pods page, select the Pod's Namespace and check its status.

    • If the status is Running, the Pod is working as expected.

    • If the status is not Running, the Pod is in an abnormal state. See this topic for troubleshooting steps.

Check the basic information of a Pod

  1. On the Clusters page, click the name of your cluster. In the left navigation pane, click Workloads > Pods.

  2. In the upper-left corner of the Pods page, select the target Pod's Namespace. Then, click the Pod's name or click Details in the Actions column to view details such as the Pod name, image, IP address, and the node on which it runs.

Check the configuration of a Pod

  1. On the Clusters page, click the name of your cluster. In the left navigation pane, click Workloads > Pods.

  2. In the upper-left corner of the Pods page, select the target Pod's Namespace. Then, click the Pod's name or click Details in the Actions column.

  3. In the upper-right corner of the Pod details page, click Edit YAML to view the Pod's YAML configuration file.

Check the events of a Pod

  1. On the Clusters page, click the name of your cluster. In the left navigation pane, click Workloads > Pods.

  2. In the upper-left corner of the Pods page, select the target Pod's Namespace. Then, click the Pod's name or click Details in the Actions column.

  3. At the bottom of the Pod details page, click the Events tab to view the Pod's events.

    Note

    By default, Kubernetes retains events for the past hour. To store events for a longer period, see Create and use K8s Event Center.

View the logs of a Pod

  1. On the Clusters page, click the name of your cluster. In the left navigation pane, click Workloads > Pods.

  2. In the upper-left corner of the Pods page, select the target Pod's Namespaces. Then, click the Pod's name or click Details in the Actions column.

  3. At the bottom of the Pod details page, click the Logs tab to view the Pod's logs.

Note

ACK integrates with Simple Log Service (SLS) for container log collection. See Collect container logs from an ACK cluster.

Check the monitoring data of a Pod

  1. On the Clusters page, click the name of your cluster. In the left navigation pane, click Operations > Prometheus Monitoring.

  2. On the Prometheus Monitoring page, click the Cluster Overview tab to view monitoring dashboards for the Pod's CPU, memory, and network I/O.

Note

ACK integrates with Managed Service for Prometheus for real-time cluster and container monitoring. See Connect to and configure Managed Service for Prometheus.

Use a terminal to access a container and view local files

  1. On the Clusters page, click the name of your cluster. In the left navigation pane, click Workloads > Pods.

  2. On the Pods page, find the target Pod and click Terminal in the Actions column.

Run Pod diagnostics

  1. On the Clusters page, click the name of your cluster. In the left navigation pane, click Workloads > Pods.

  2. On the Pods page, find the target Pod and click Diagnose in the Actions column. Resolve any identified issues based on the diagnostic results.

Note

Container Intelligent Service provides one-click diagnostics. See Use cluster diagnostics.

Unexpected Pod deletion

The kube-controller-manager (KCM) garbage-collects pods in Completed status when their count exceeds the default threshold of 12,500. The --terminated-pod-gc-threshold parameter configures this threshold. See the KCM parameter documentation.

Recommendation: Periodically clean up Completed pods to prevent them from affecting controller efficiency.