NVIDIA GPUs have hardware counters that collect device-level performance metrics, such as GPU utilization and memory usage. You can use the NVIDIA Management Library (NVML) or Data Center GPU Manager (DCGM) to query these hardware-level metrics. This topic describes the advantages and limitations of hardware-level profiling. It also covers scenarios where operations engineers and developers use DCGM for GPU performance analysis.
Advantages and limitations
Performance analysis at the hardware layer has the following advantages and limitations:
Comparison criteria | Description |
Advantages |
|
Limitations |
|
User roles
Cluster administrators and developers have different focuses and scenarios when using DCGM for performance analysis.
Role type | Description |
Cluster administrator | As a Kubernetes cluster administrator, you may need to understand the GPU resource usage patterns of different departments in your company. This helps you better understand and optimize the allocation and use of GPU resources across the cluster, improving overall efficiency and service quality. For specific scenarios, see: |
Developer | As an AI application developer, you might focus on hardware-level profiling metrics to make decisions based on best practices. Understanding your service's GPU usage helps with capacity planning and task scheduling. For specific scenarios, see: |
Prerequisites
A Container Service for Kubernetes (ACK) managed cluster or an ACK dedicated cluster with GPU-accelerated nodes is created. For more information, see Create an ACK cluster with GPU-accelerated nodes.
For more information about the GPU-accelerated instance families supported by ACK clusters, see GPU-accelerated instance families supported by ACK.
GPU monitoring is enabled for the ACK cluster. For more information, see Enable GPU monitoring for an ACK cluster.
Scenarios
Scenario 1: Analyze whether a cluster uses GPUs efficiently
In some scenarios, high GPU utilization does not mean that an application is making full use of GPU resources. When you analyze GPU performance, you must observe not only GPU utilization but also other key metrics to fully assess whether an application is using GPU resources effectively.
The following simple CUDA program example shows that high GPU utilization does not always mean efficient use of GPU resources.
Create a file named cuda-sample.yaml and copy the following content into the file to create a pod.
apiVersion: v1
kind: Pod
metadata:
  name: cuda-sample
spec:
  containers:
  - name: cuda
    image: nvidia/cuda:12.1.0-devel-ubuntu22.04
    command:
    - sleep
    - 1d
    resources:
      limits:
        nvidia.com/gpu: 1
Run the following command to create the pod.
kubectl apply -f cuda-sample.yamlAfter the pod is in the Running state, run the
kubectl exec -ti cuda-sample bashcommand to enter the pod. Then, save the following code to a file named Test_GPU_Utilization.cu.The following C++ code is a simple example in the CUDA programming language. It runs a simple empty loop on an NVIDIA GPU to simulate a GPU thread waiting for a period of time.
# include <stdio.h>
# include <unistd.h>
# include <stdlib.h>

const long long tdelay=100000000000000LL;

// Kernel function definition. This function is similar to keeping the GPU thread in a sleep state.
__global__ void dkern(){
        long long start = clock64();
        long long targetClock = start+tdelay;
        while(clock64() < targetClock);
}

int main(int argc, char *argv[]){
        dkern<<<1,1>>>(); // Call the kernel function to start one thread block that contains one thread.
        cudaDeviceSynchronize();
        return 0;
}
Use the nvcc compiler to compile the code and generate an executable file named Test_GPU_Utilization.
nvcc -o Test_GPU_Utilization Test_GPU_Utilization.cuIf an error occurs during compilation, a relevant error message is displayed.
Run the following command to run the generated executable file.
./Test_GPU_UtilizationOpen another terminal, enter the cuda-sample pod, and run the following command to check the GPU utilization.
nvidia-smiExpected output:
Wed Mar 27 15:08:29 2024
+-----------------------------------------------------------------------------+
| NVIDIA-SMI 470.161.03   Driver Version: 470.161.03   CUDA Version: 11.4     |
|-------------------------------+----------------------+----------------------+
| GPU  Name        Persistence-M| Bus-Id        Disp.A | Volatile Uncorr. ECC |
| Fan  Temp  Perf  Pwr:Usage/Cap|         Memory-Usage | GPU-Util  Compute M. |
|                               |                      |               MIG M. |
|===============================+======================+======================|
|   0  Tesla T4            On   | 00000000:00:07.0 Off |                    0 |
| N/A   44C    P0    39W /  70W |    100MiB / 15109MiB |    100%      Default |
|                               |                      |                  N/A |
+-------------------------------+----------------------+----------------------+

+-----------------------------------------------------------------------------+
| Processes:                                                                  |
|  GPU   GI   CI        PID   Type   Process name                  GPU Memory |
|        ID   ID                                                   Usage      |
|=============================================================================|
|    0   N/A  N/A    108695      C   ./Test_GPU_Utilization             97MiB |
+-----------------------------------------------------------------------------+
The output from nvidia-smi shows that the GPU uses about 97 MiB of memory and the GPU utilization is 100%. This suggests the GPU is running the program at full capacity.
However, if you log on to the Container Service for Kubernetes (ACK) console and view the monitoring dashboard, you can see from metrics such as FP32 Pipe Active, FP64 Pipe Active, and Tensor Core Pipe Active that the CUDA Cores and Tensor Cores are barely used.
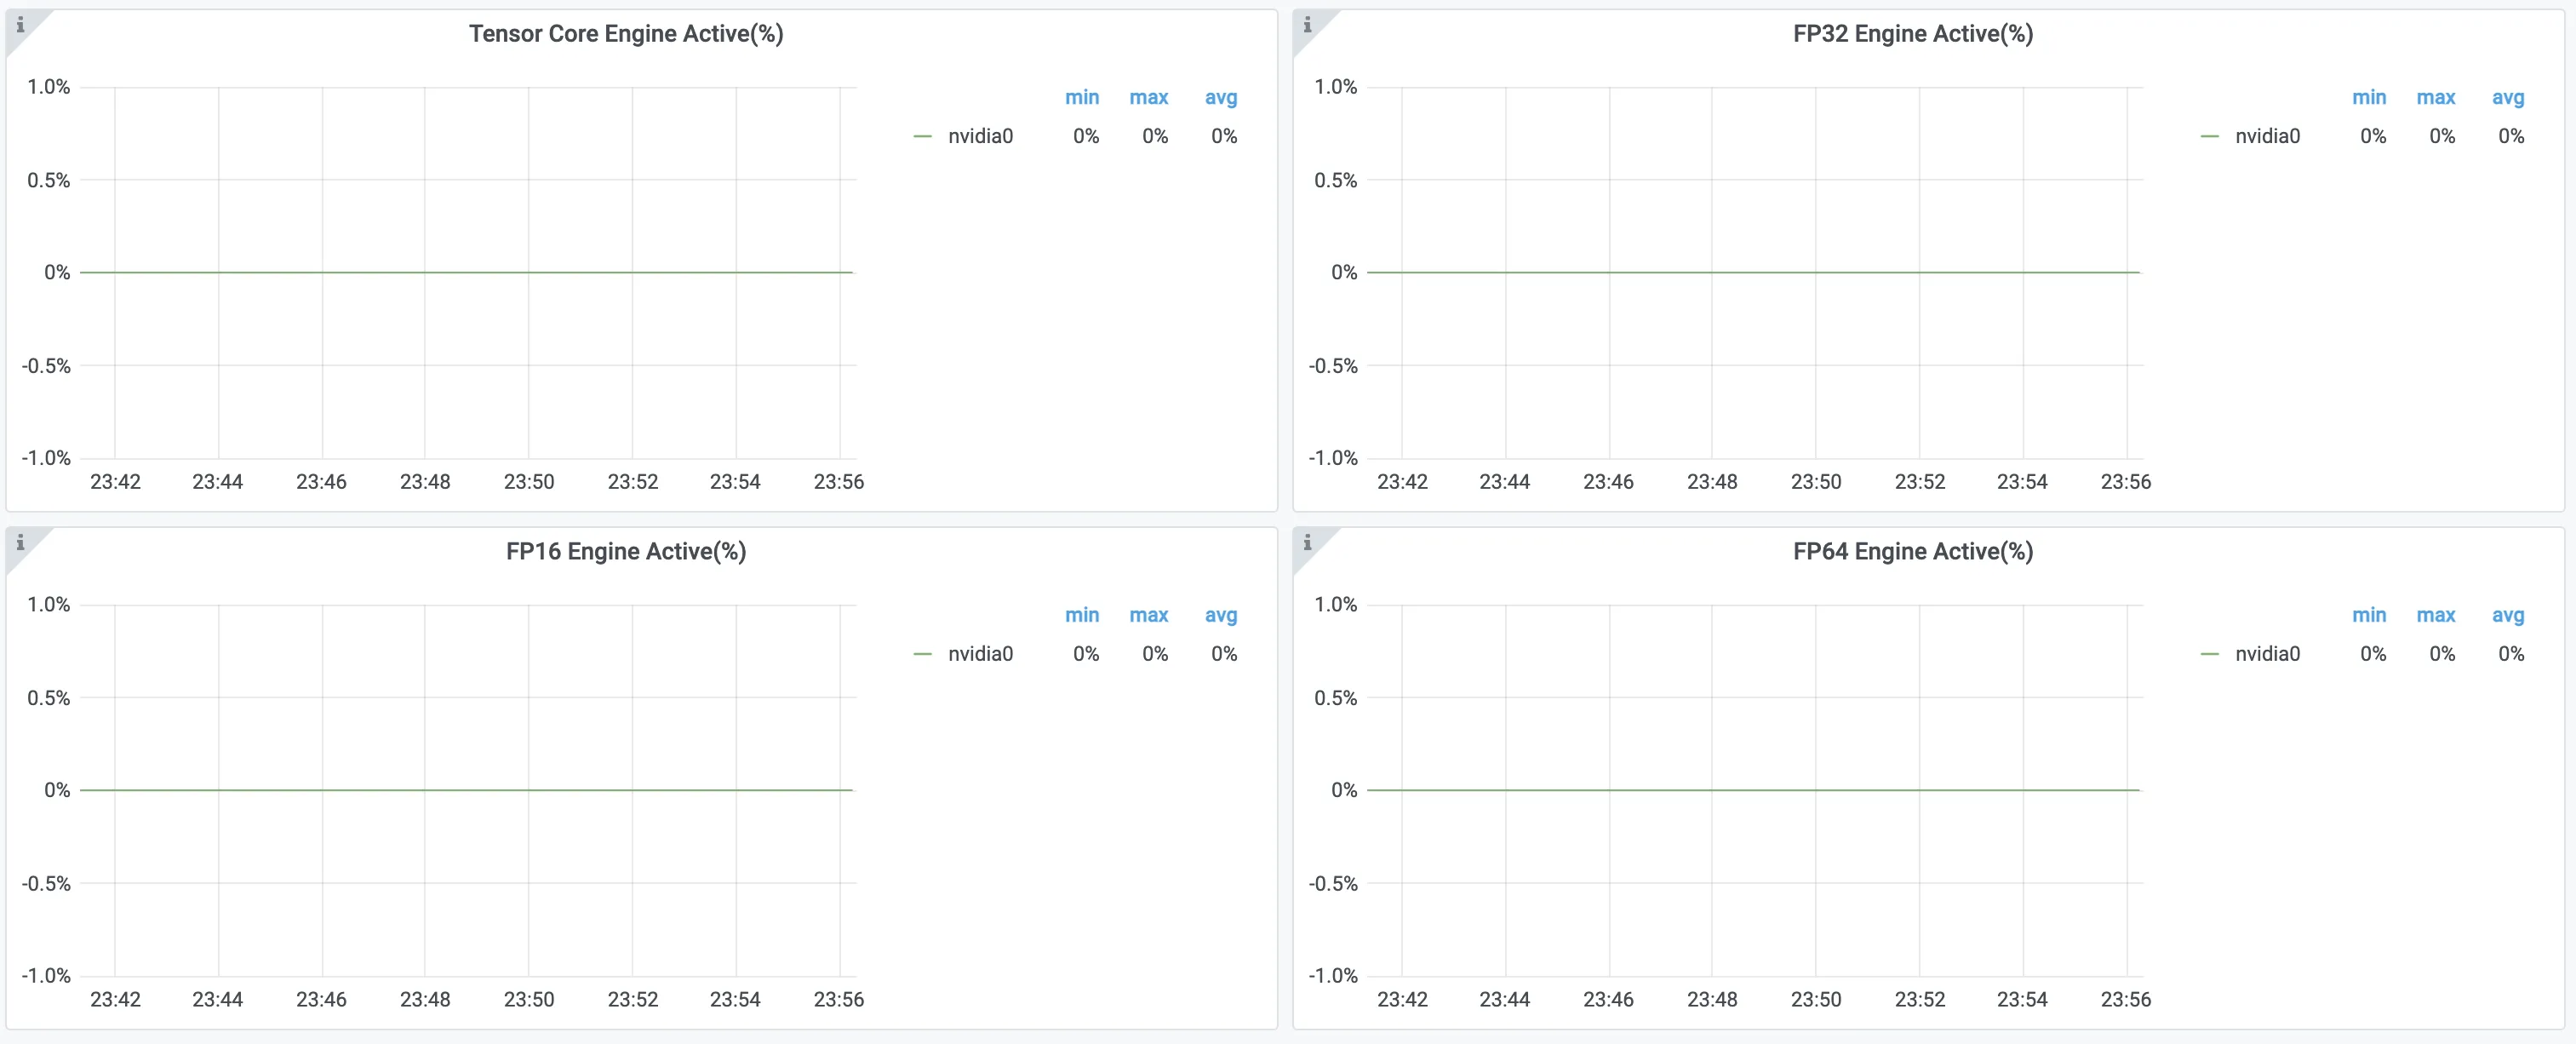
Therefore, even if a command shows that GPU utilization has reached 100%, you must also check metrics related to CUDA Cores and Tensor Cores to determine the actual usage of GPU resources. For more information about how to view GPU monitoring dashboards, see Best practices for monitoring GPU resources.
Scenario 2: Understand the GPU resources that are commonly used by each department
As a Kubernetes cluster administrator, you might have a cluster with a mix of GPU types, such as V100, T4, and A10. This means some nodes have V100 GPUs, while others have T4 GPUs. You need to manage resource allocation with fine-grained control to maximize the use of these limited and valuable GPU resources.
For example, an application from Department A might rely mainly on FP32 (single-precision floating-point) computing power. An application from Department B might need data types such as bf16 (bfloat16 floating-point) and int4 (4-bit integer).
Multiple GPU types, such as V100, T4, and A10, support FP32 computing. However, V100 and T4 cards do not support data types such as bf16 and int4.
As shown in the following figure, hardware-level profiling shows that Department A's application primarily uses CUDA Cores for FP32.
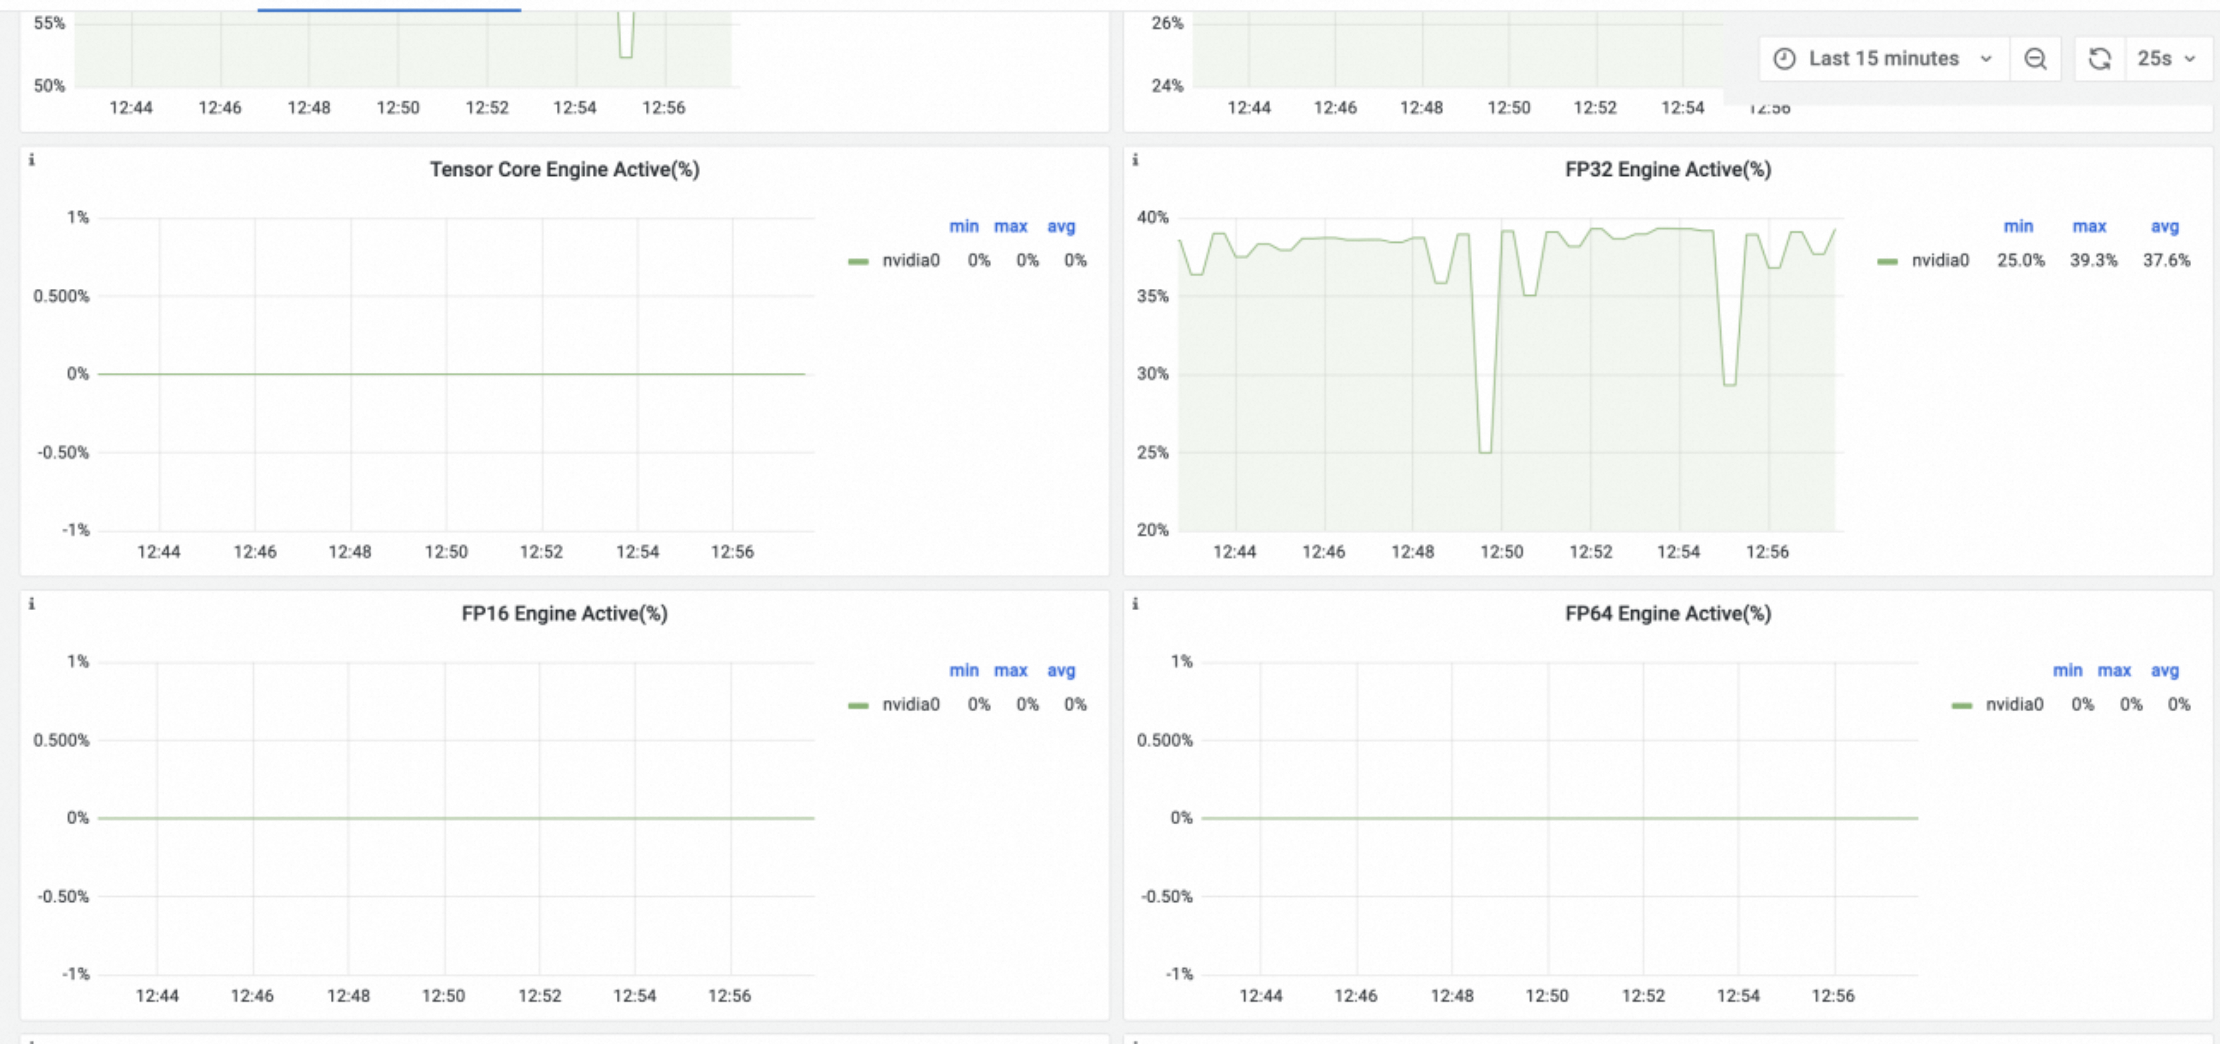
In this situation, if you indiscriminately deploy Department A's application on A10 nodes, which are better suited for Department B, Department A's application might consume too many A10 cards. This could prevent Department B's application from obtaining suitable GPU resources and cause it to fail.
In summary, you should prioritize deploying Department A's application on V100 or T4 nodes. This frees up more advanced GPUs, such as the A10, to meet Department B's need for specific hardware acceleration features.
Scenario 3: Evaluating how to set the Batch Size for a training job
In deep learning training jobs, the batch size is a hyperparameter. When you set the batch size, you must consider its impact on model training and the capabilities of the GPU hardware.
If the batch size is too small, the GPU may be underutilized. This is known as GPU starvation.
If the batch size is too large, a large amount of data may be waiting on the GPU, which can decrease performance.
To avoid these issues, you can prepare a small batch of data. The data should be enough for the training job to run for 5 to 10 minutes. Then, start multiple replicas of the training job. Each replica should have the same configuration, except for the batch size. Use hardware-level profiling metrics to find a suitable batch size by following these steps:
Run the following command to run a Python script named main.py.
This example uses the word_language_model from PyTorch Examples to train a Transformer model.
python main.py --cuda --epochs 500 --batch_size 16 --model Transformer --lr 5The parameters in the preceding command are described as follows:
--cuda: Indicates that the GPU is used for accelerated computing.--epochs 500: Sets the number of training epochs to 500. This provides enough time to observe the profiling metrics.--batch_size: Sets the number of samples in each batch of the training job.--model Transformer: The model architecture used is Transformer.--lr 5: The learning rate is 5. This is the speed at which model parameters are updated.
Log on to the Container Service for Kubernetes (ACK) console to view the GPU monitoring dashboard data and metrics.
For more information about how to view GPU monitoring dashboards, see Best practices for monitoring cluster GPU resources.
Set the batch size to 8, 32, 64, 128, 256, and 512. Step 1 already set the batch size to 16. Then, calculate the average value of the relevant metrics over a five-minute period.
In the following table, the SM Active metric corresponds to the DCGM_FI_PROF_SM_ACTIVE metric, the SM Occupancy metric corresponds to the DCGM_FI_PROF_SM_OCCUPANCY metric, and the FP32 Pipe Active metric corresponds to the DCGM_FI_PROF_PIPE_FP32_ACTIVE metric. For more information about DCGM metrics, see Introduction to metrics.
BatchSize
8
16
32
64
128
256
512
SM Active(%)
35.8
53.2
66.6
77.5
81.5
86.9
88.4
SM Occupancy(%)
18.2
25.1
32.1
38.8
43.7
46.9
48.1
FP32 Pipe Active(%)
15.6
27.7
37.6
45.1
49.3
54.7
55.7
The following line chart summarizes the data from the table:
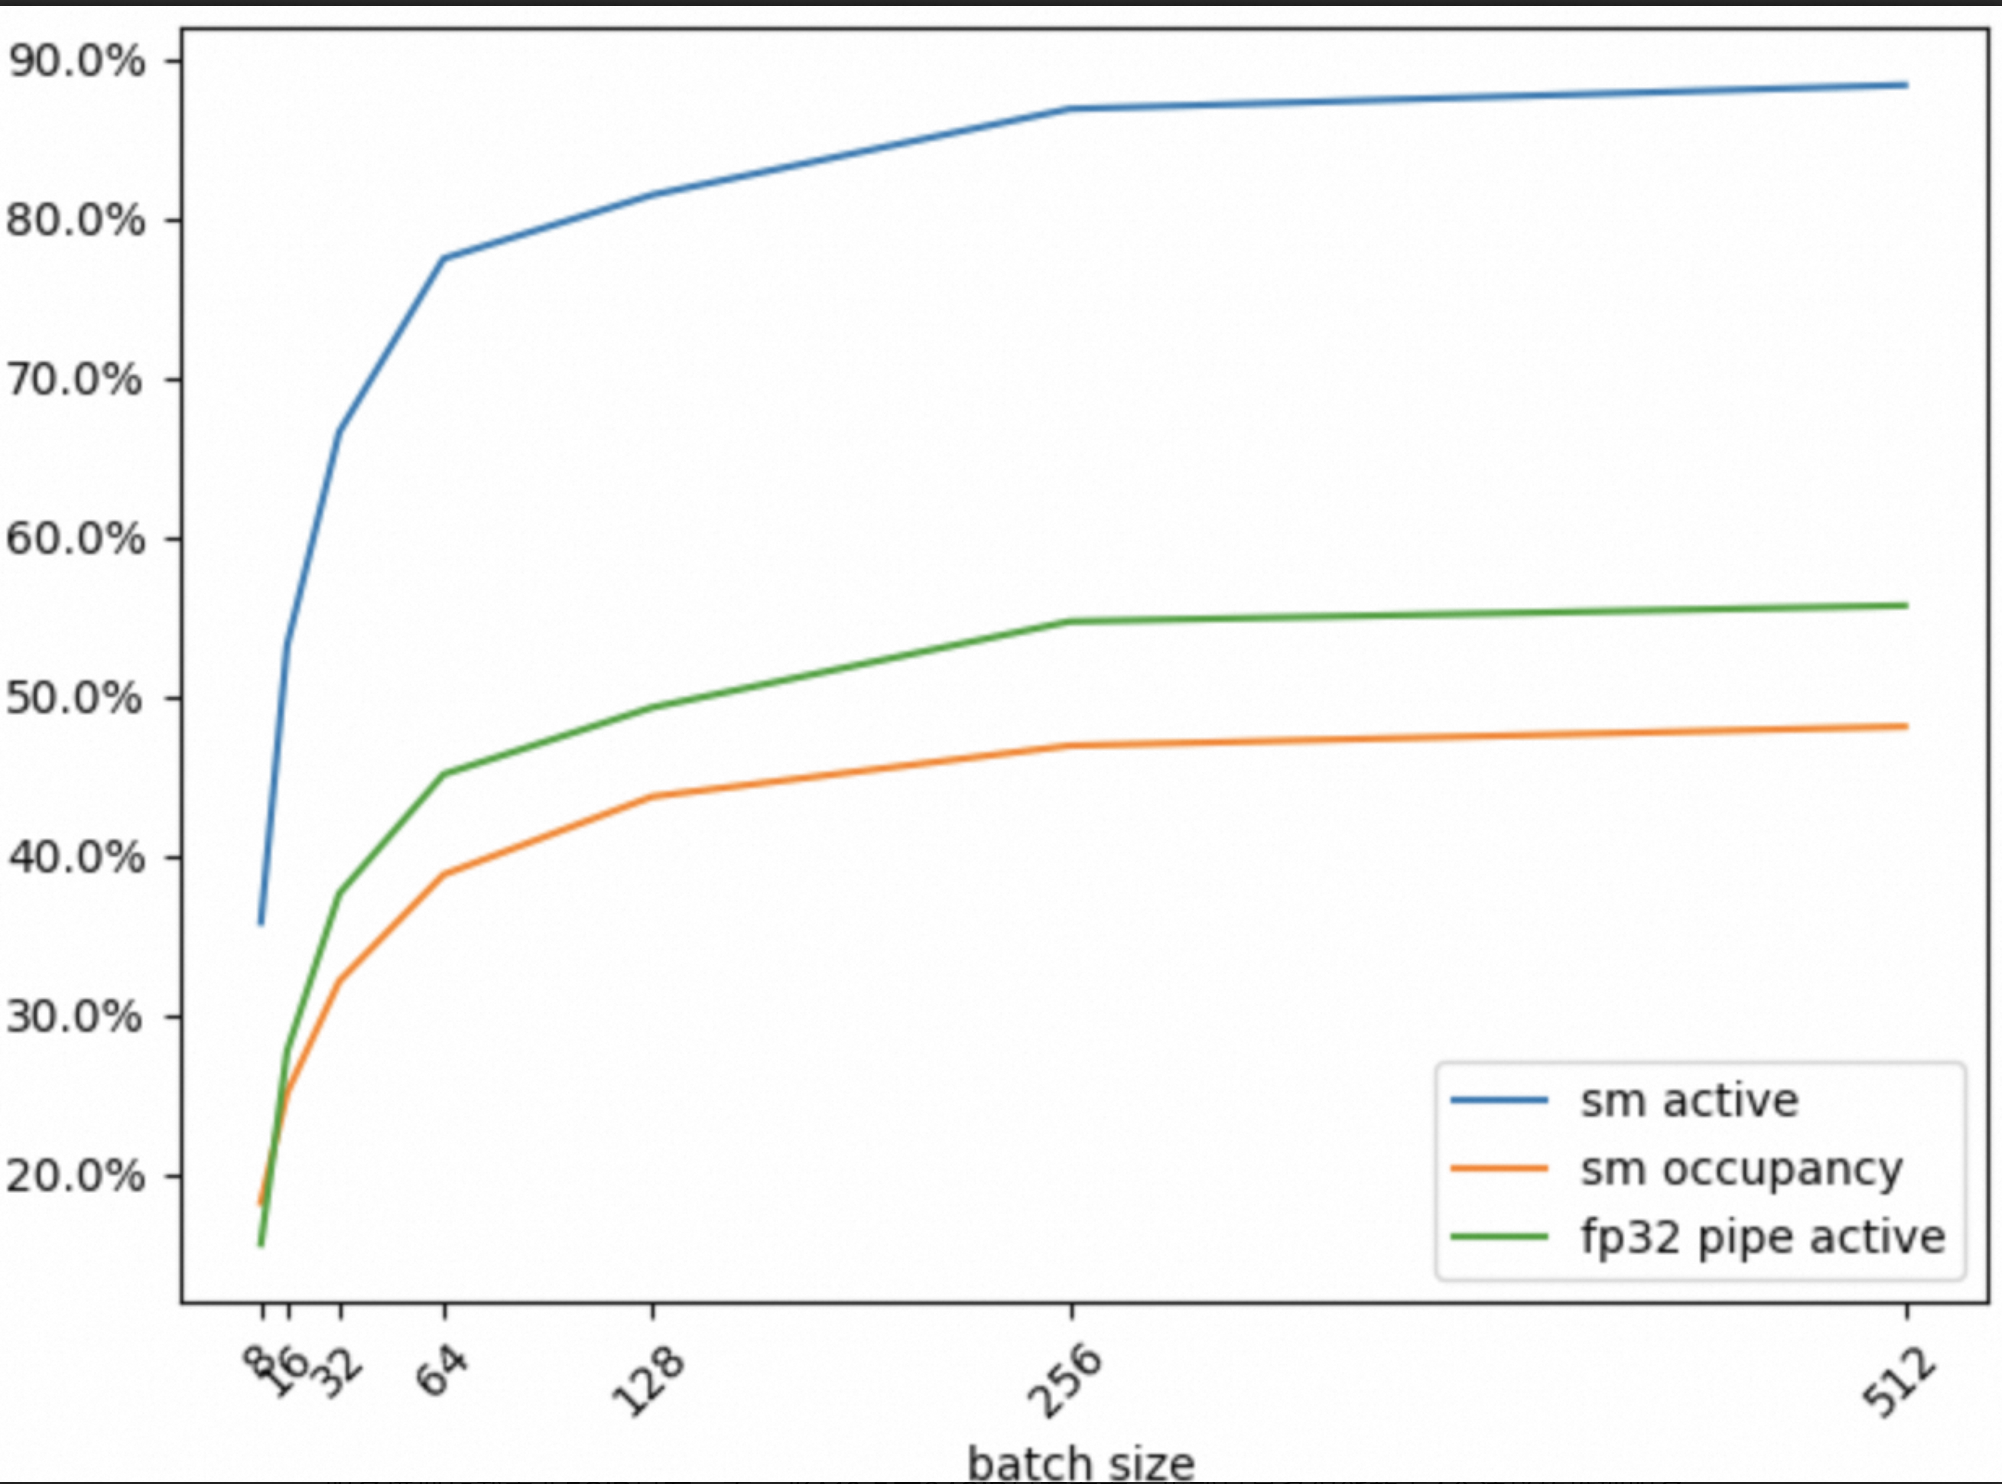
The following conclusions can be drawn:
When the batch size increases from 8 to 64, the values of the SM Active, SM Occupancy, and FP32 Pipe active metrics increase significantly. This means that increasing the batch size can significantly improve GPU resource utilization.
When the batch size increases from 64 to 256, the three metrics continue to increase, but at a slower rate.
When the batch size increases from 256 to 512, the three metrics show almost no improvement.
For this training job, from the perspective of efficient GPU resource utilization, a batch size between 64 and 256 is appropriate.
Scenario 4: Evaluating a single shared GPU card's capacity for AI inference services
Inference services generally use GPU resources inefficiently. If you allocate an entire GPU card to a single inference service, you may waste GPU resources. A better approach is to use a shared GPU solution. This involves deploying multiple inference services on one GPU to increase the resource usage density of the card. However, you need to determine how many inference services to deploy on a single GPU card.
From a GPU resource usage perspective, consider the following two issues:
Loading the model for an inference service consumes GPU memory. Therefore, the inference service has a minimum GPU memory requirement. For example, if loading a model requires 5 GiB of GPU memory, and an A10 card has about 24 GiB of GPU memory, you can run a maximum of four such inference services.
During peak business hours, multiple inference services on a single GPU card handle high concurrency requests. You need to evaluate whether insufficient compute resources on the GPU will cause some inference requests to wait. This can lead to increased service latency.
For the first issue, after you deploy an inference service on a card, you can easily determine the GPU memory used for model loading using the nvidia-smi tool or the GPU monitoring dashboard.
For the second issue, you can use profiling metrics to perform an evaluation. The steps are as follows:
Use Arena to submit a bloom-tgi inference service to the ACK cluster.
If the Arena client is not installed, you must first configure the Arena client. For more information, see Configure the Arena client.
arena serve custom \
    --name=bloom-tgi-inference \
    --gpumemory=6 \
    --version=alpha \
    --replicas=1 \
    --restful-port=8080 \
    --image=ai-tool-registry.cn-beijing.cr.aliyuncs.com/kube-ai/bloom-tgi:v0.1.0 \
    "text-generation-launcher --disable-custom-kernels --model-id /model/bloom-560m --num-shard 1 -p 8080"
Use the Hey stress testing tool to test the inference service.
NoteFor more information about the Hey stress testing tool, see Hey.
hey \
	-z 500000s \
	-c 120 \
	-m POST \
	-H "Content-Type: application/json" \
	-D ./bloom-tgi.json \
	"http://bloom-tgi-inference-alpha:8080/generate"
Log on to the Container Service for Kubernetes (ACK) console to view the GPU monitoring dashboard metrics.
For more information about how to view GPU monitoring dashboards, see Best practices for monitoring cluster GPU resources.
Increase the number of sample inference services from 1 to 5.
The following table shows the average values of various profiling metrics over 10 minutes as the number of sample inference services deployed on a single V100 card is increased from 1 to 5. The hey command from the previous step is used to stress test each service.
Number of inference services
1
2
3
4
5
GPU Utilization(%)
18
74
94
98.0
100
SM Active(%)
5.87
11.3
16.0
18.6
20.6
SM Occupancy(%)
1.15
2.24
3.19
3.66
4.07
Tensor Core(%)
1.39
1.92
2.65
3.36
3.47
FP32 Core(%)
0.532
0.823
1.13
1.33
1.47
FP16(%)
0.0482
0.0736
0.0986
0.12
0.125
When the number of inference services on a single GPU card increases from 1 to 5, GPU Utilization increases significantly, approaching 100%. On the surface, this indicates high resource usage on the card.
When the number of services increases from 1 to 5, SM Active increases significantly to about 20%. However, this is still low. This value should generally reach 80% to be considered efficient use of GPU resources.
When the number of services increases from 1 to 5, SM Occupancy, FP32 Pipe Active, FP16 Pipe Active, and Tensor Pipe Active increase, but not significantly. Their usage rates are generally below 5%.
In summary, even with five sample inference services deployed on the GPU card, the GPU compute resources are far from fully utilized. From a GPU resource usage perspective, deploying five services is feasible.
Scenario 5: Evaluate whether to enable the MPS feature on a shared GPU
In Scenario 4 of this topic, even if five inference services are deployed on an NVIDIA V100 GPU under high concurrency, the utilization of metrics such as FP32 Pipe Active, FP16 Pipe Active, and Tensor Pipe Active remains very low (no more than 5%). To further improve GPU resource utilization, you can evaluate whether to enable the Multi-Process Service (MPS) capability on this GPU card.
You can use profiling performance metrics to evaluate the effects before and after using MPS. For example, first enable the MPS capability for the GPU card on the node. Then, redeploy these inference services. Use the Hey stress testing tool and observe metrics such as SM Occupancy, FP32 Pipe Active, FP16 Pipe Active, and Tensor Pipe Active to make an assessment.
Scenario 6: Evaluate the basic performance of GPUs
When you evaluate the basic performance of a GPU, you can first use hardware-level profiling for a preliminary performance assessment of the application. If you find that the application's GPU utilization is low, use professional GPU profiling tools, such as Nsight System and Nsight Compute, for in-depth analysis and optimization.
References
For more information about how to use GPU memory and computing power in a more fine-grained manner, see Allocate computing power by scheduling shared GPU.
For more information about the panels on GPU monitoring dashboards, see Panels.
For more information about GPU monitoring metrics, see Introduction to metrics.