View cluster details
After you configure cluster throttling rules, you can go to the Cluster Details page to view data for the entire cluster and its interfaces. The data includes cluster-level and node-level throttling statistics, throttling ratio, interface traffic change, Token Client request latency, and Token Client response types.
Public preview notice
The cluster throttling feature is in public preview and free of charge. The trial tier is for testing only. The sum of QPS thresholds for a single application cannot exceed 2,000, and the total API traffic cannot exceed 3,000.
During the public preview, the real-time creation of the Token Server and the stability of throttling are not guaranteed. Exercise caution when using this feature in a production environment, even with the production tier.
Prerequisites
Connect your application to AHAS Application Protection. For more information, see Application connection methods.
Configure cluster throttling rules. For more information, see Configure cluster throttling rules.
Feature access
Log on to the AHAS console. In the top-left corner, select the region where your application is deployed.
In the navigation pane on the left, choose .
On the Application Protection page, click the card for your application.
In the navigation pane on the left, choose .
View data details
The details page for the destination cluster displays the cluster status. In the Cluster Name area, you can click All Interfaces or the name of a specific interface to view details for the entire cluster or for that interface.
All charts show data from the last 5 minutes. The data refreshes every 10 seconds.
Cluster rate limiting statistics
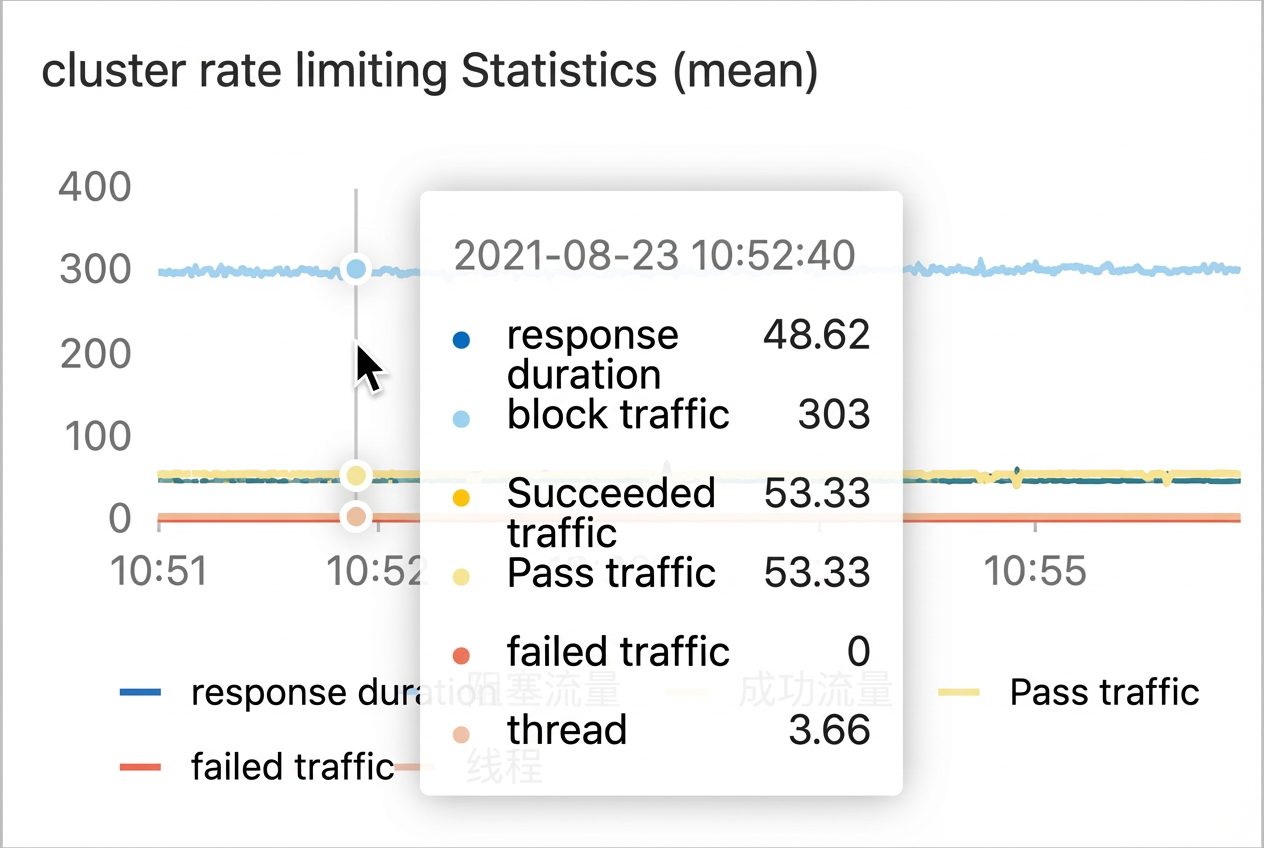
This chart shows an overview of cluster throttling for the specified time range, including metrics such as Response Time, Blocked Traffic, Successful Traffic, Passed Traffic, Failed Traffic, and Threads.
You can hover your mouse pointer over the graph to view the value of a metric at a specific point in time. You can also click a metric name (such as response time) on the panel to show or hide that metric in the chart.
Throttling ratio
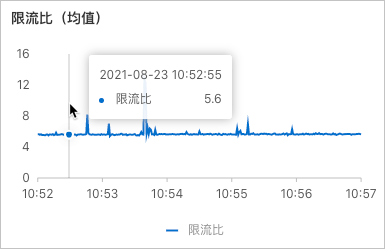
This chart shows the ratio of throttled traffic to passed traffic. A high ratio indicates that excessive traffic is being blocked. In this case, you can adjust the traffic throttling rules accordingly.
You can hover your mouse pointer over the graph to view the value of the metric at a specific point in time.
Period-over-period interface traffic
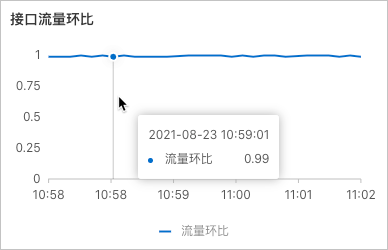
This chart shows the change in external traffic over time by comparing the traffic from the current 10-second period to the previous 10-second period.
You can hover your mouse pointer over the graph to view the value of the metric at a specific point in time.
Token Client response types
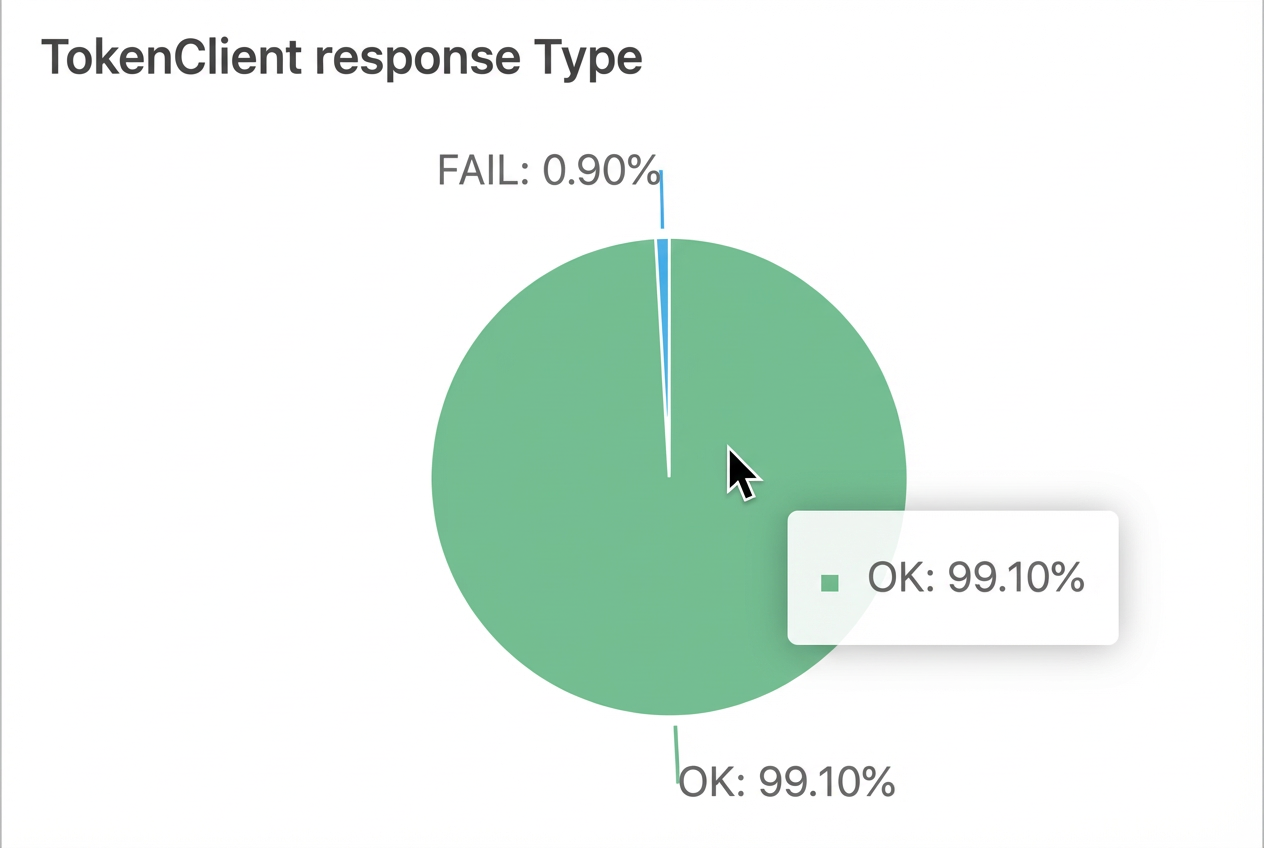
This chart shows the proportion of successful and failed Token Client responses.
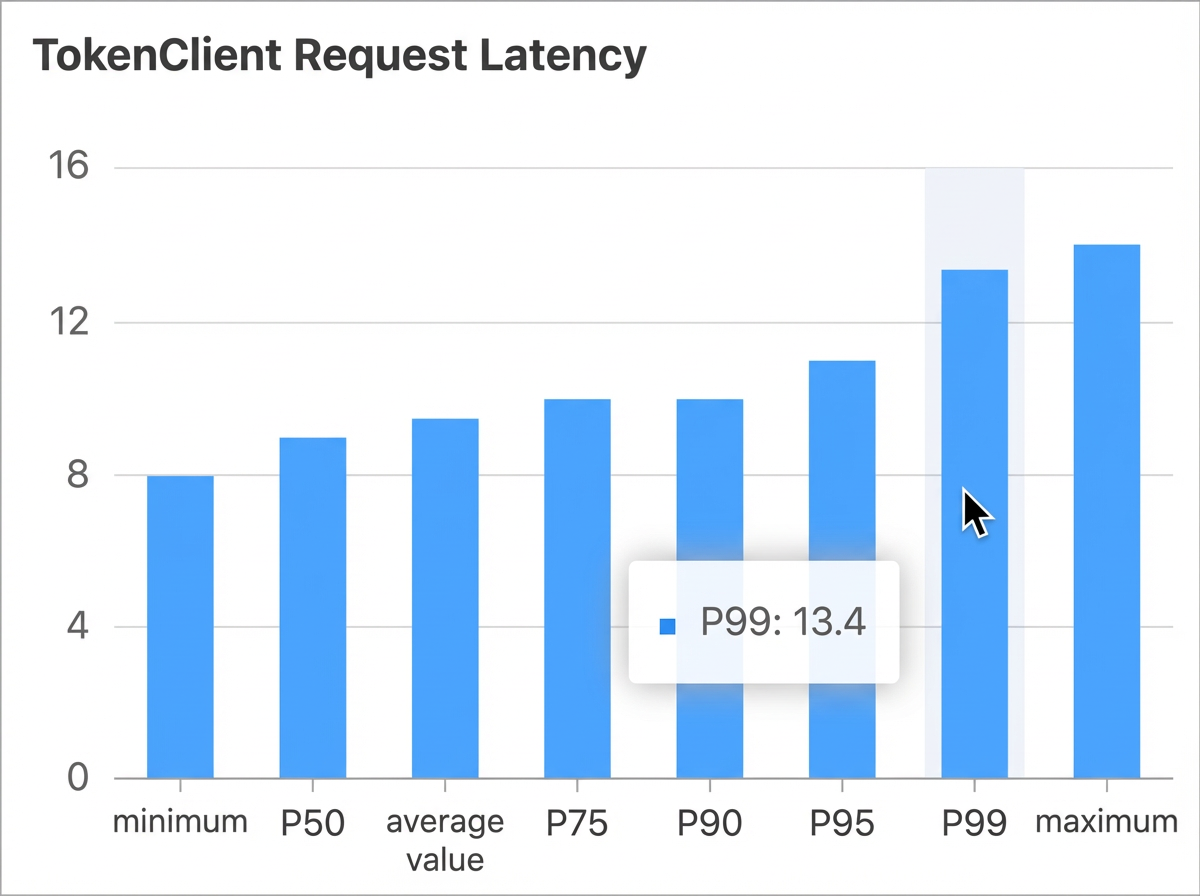
This chart shows the latency of Token Client requests. You can use the P99 or maximum values to adjust the Token request timeout in your cluster configuration.
Rate limiting statistics by node
This chart shows the distribution of traffic across different nodes, which lets you verify that load balancing is working as expected. PQPS represents passed traffic, and BQPS represents blocked traffic.
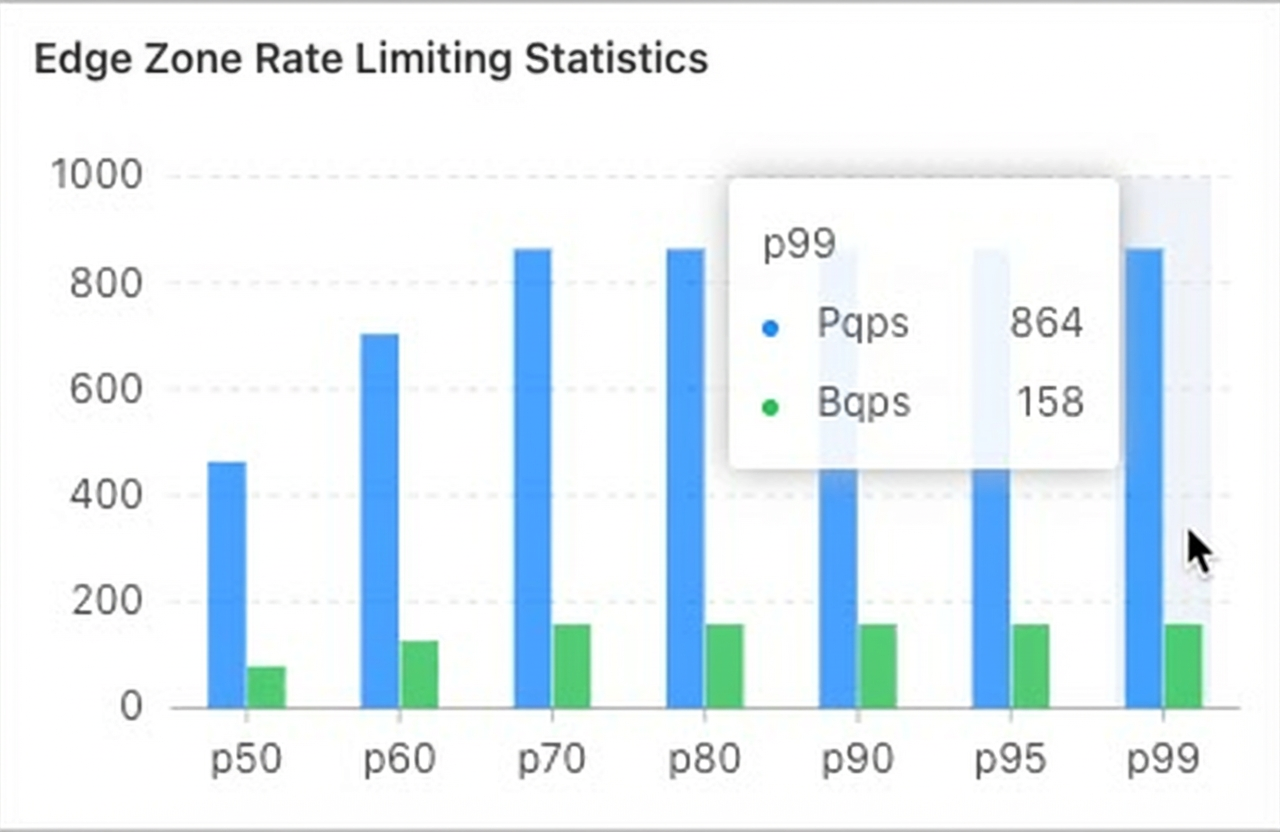
You can slide the pointer in the Select Query Time area to view data in the Token Client Response Type, Token Client Request Duration, and Throttling Statistics by Node charts for a specific point in time.