AI Profiling is an advanced analytics tool that helps you observe, diagnose, and optimize the performance of AI applications across their entire lifecycle. It deeply traces the call paths of AI models during training and inference across the full software stack, including the Python stack, Torch layer, GPU memory, CUDA Runtime, and GPU kernels. It combines this data with fine-grained, operator-level performance metrics (such as FLOPs and time spent on compute, communication, GPU memory, and idle) and resource consumption data to provide an end-to-end solution for developers and operations teams.
Limitations
This feature is currently available on an allowlist basis. To request a trial, please submit a ticket.
-
Region availability
This feature is currently available only in Chinese mainland and China (Hong Kong).
-
Operating system limitations
Architecture
Operating system
x86
-
Alibaba Cloud Linux 3
-
Alibaba Cloud Linux 2
-
Ubuntu 22.04
-
Ubuntu 24.04
-
-
Other limitations
ImportantAI Profiling consumes memory and CPU resources of the target process. The amount of overhead depends on the collection duration and the number of iterations. If the target process has less than 0.5 GB of available memory, data collection is aborted.
-
Machines must be onboarded before you can use AI Profiling.
-
Supported GPUs: A-series, L-series, and T-series.
-
AI jobs are supported in virtual environments or containers, such as ACK or self-managed Kubernetes. When using containers, the job container must not mount the host's
/procdirectory. Running AI jobs directly in the host's Python environment is not recommended. For support in other scenarios, submit a ticket. -
Only Python processes that use a GPU can be profiled. Supported Python versions range from 3.9 to 3.12.
-
Supported Torch versions include 2.1.0 or later.
-
Supported CUDA versions range from 12.0 to 12.8, excluding version 12.7.
-
If your AI job uses NVIDIA Nsight Systems (nsys) by default, GPU kernel data cannot be collected.
-
The Python interpreter for the target process must have pip installed.
Verified environments:
-
Alibaba Cloud Linux 2 + (conda) Python 3.11.13 + pip 25.1.1 + NVIDIA A10 + CUDA Version: 12.4 + 4.19.91-28.2.al7.x86_64
-
Alibaba Cloud Linux 3 + (conda) Python 3.10.18 + pip 25.1 + Tesla T4 + CUDA Version: 12.4 + 5.10.134-19.1.al8.x86_64
-
Alibaba Cloud Linux 3 + (conda) Python 3.9.23 + pip 21.2.4 + Tesla T4 + CUDA Version: 12.4 + 5.10.134-19.1.al8.x86_64
-
Ubuntu 24.04 + (conda) Python 3.12.1 + pip 22.0.4 + NVIDIA A10 + CUDA Version: 12.8 + 6.8.0-63-generic
-
Ubuntu 22.04 + (conda) Python 3.12.11 + pip 22.0.4 + Tesla P4 + CUDA Version: 12.8 + 5.15.0-142-generic
-
Ubuntu 22.04.3 LTS + Python 3.10.12 + NVIDIA A10 + CUDA Version: 12.2 + 5.10.134-18.al8.x86_64 (ACK container)
-
-
Data richness
Metric
Description
Supported environments
Example
Default metric collection
Enabled by default:
-
GPU kernel
-
Torch
-
Python stack
-
The union of the supported environments for GPU kernel, Torch, and Python stack.
GPU kernel
Information about GPU operators.
-
Supported hardware: NVIDIA, AMD
-
CUDA versions: 12.0 to 12.8
Torch
Information from the Torch layer.
-
Supported hardware: NVIDIA, AMD
-
Torch version: 2.1.0 or later
-
Python versions: 3.9 to 3.12
-
pip is installed in the Python interpreter.
Python stack
Information from the Python stack.
-
Supported hardware: NVIDIA, AMD
-
Python versions: 3.9 to 3.12
-
pip is installed in the Python interpreter.
Profile memory
Information about Torch GPU memory usage.
-
Note: TensorRT jobs are not supported. If this option is enabled for a TensorRT job, Torch metric collection fails.
GPU memory snapshot
Collects data on GPU memory allocation, fragmentation, and allocation stack traces.
-
Supported hardware: NVIDIA
-
Torch version: 2.1.0 or later
-
Python versions: 3.9 to 3.12
-
pip is installed in the Python interpreter.

RDMA monitor
RDMA monitoring information. The following metrics are collected by default:
-
vport_rx_write_requests
-
vport_rx_read_requests
-
An RDMA network interface card (NIC) must be available.
DCGM monitor
DCGM monitoring information. The following metrics are collected by default:
-
DCGM_FI_DEV_FB_FREE
-
DCGM_FI_DEV_FB_USED
-
DCGM_FI_DEV_GPU_UTIL
-
Supported hardware: NVIDIA
-
Tesla driver
NVTX
Custom NVTX markers.
-
Supported hardware: NVIDIA, AMD
-
Torch version: 2.1.0 or later
-
Your code contains NVTX markers.
-
Python versions: 3.9 to 3.12
-
pip is installed in the Python interpreter.
FLOPs
FLOPs information from Torch.
-
Supported hardware: NVIDIA, AMD
-
Torch version: 2.1.0 or later
-
Python versions: 3.9 to 3.12
-
pip is installed in the Python interpreter.
Record shapes
Record Shapes information from Torch.
-
Supported hardware: NVIDIA, AMD
-
Torch version: 2.1.0 or later
-
Python versions: 3.9 to 3.12
-
pip is installed in the Python interpreter.
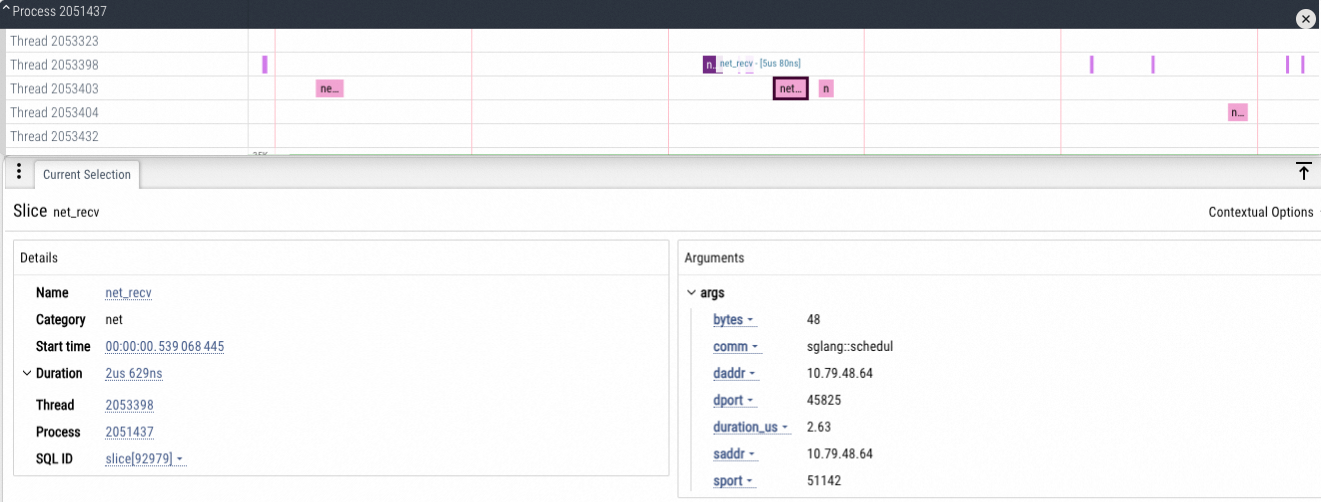
TCP network metrics
Information about sending and receiving TCP network packets.
-
Kernel version 5.10 or later
-


Benefits
-
Zero-instrumentation: Uses a non-intrusive profiling technique that requires no changes to your containers.
-
Rich data collection: Collect a wide range of metrics on demand, including Python call stacks, CPU information, GPU operators, Torch data, GPU memory, and FLOPs. You can also collect RDMA, GPU, and CPU monitoring metrics.
-
Centralized analysis: Raw data is automatically sent to a centralized service for statistical analysis, providing a multi-dimensional view of your job's performance.
-
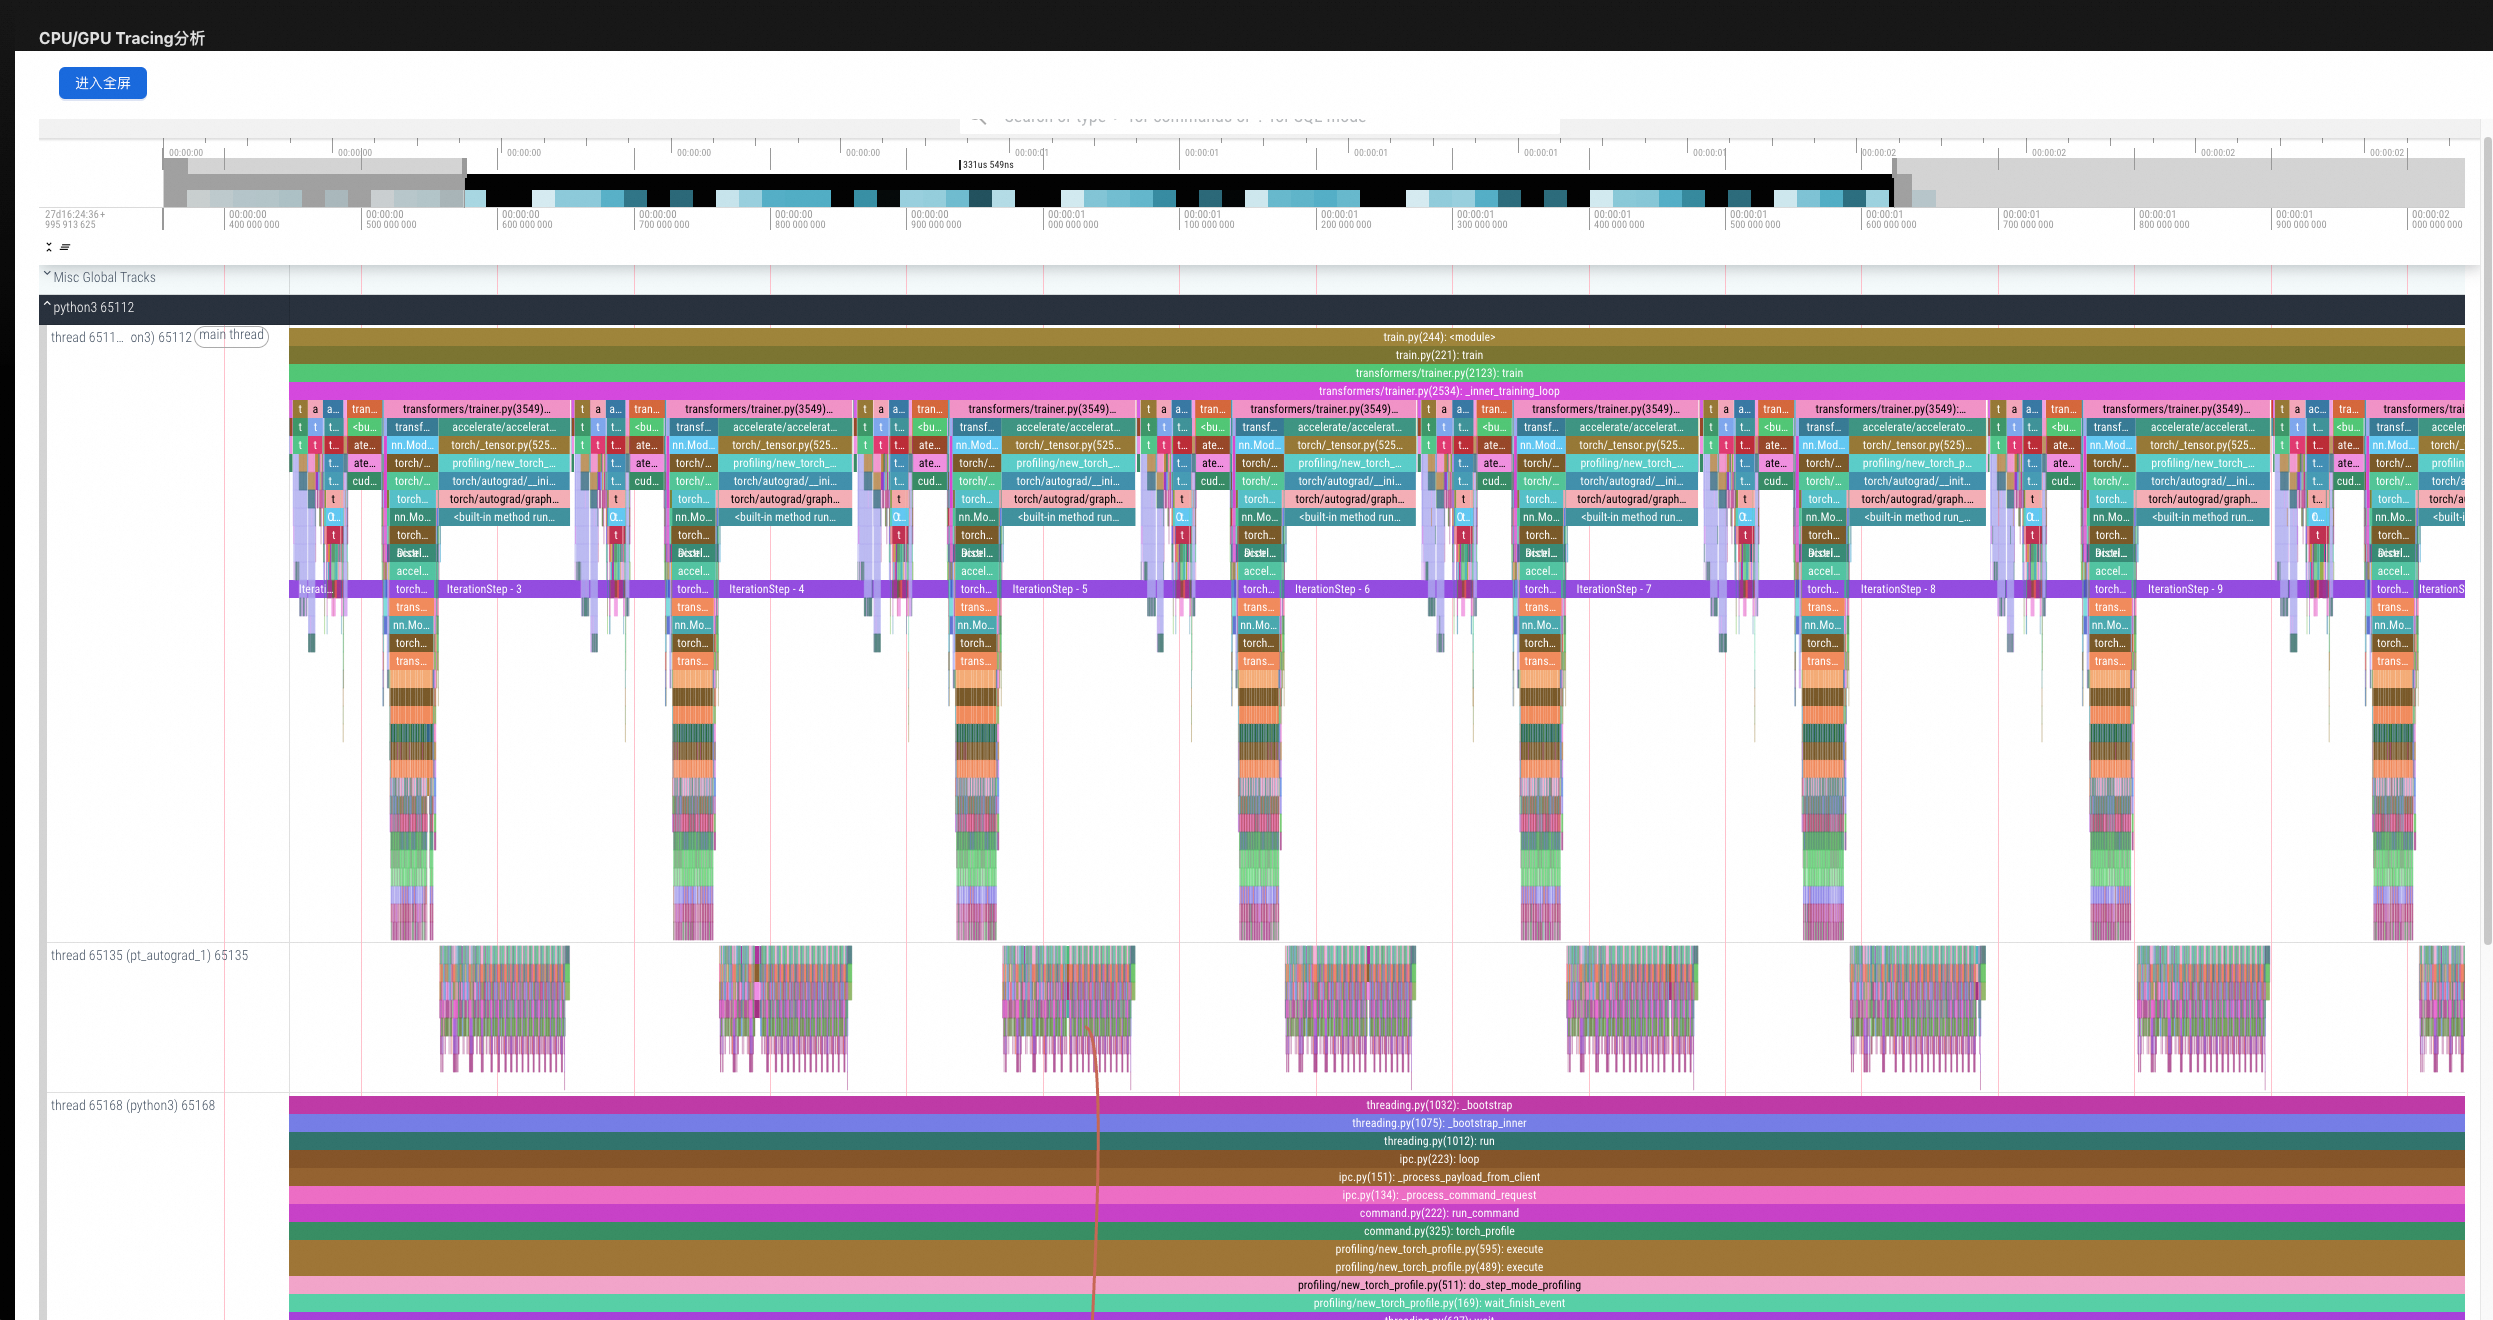
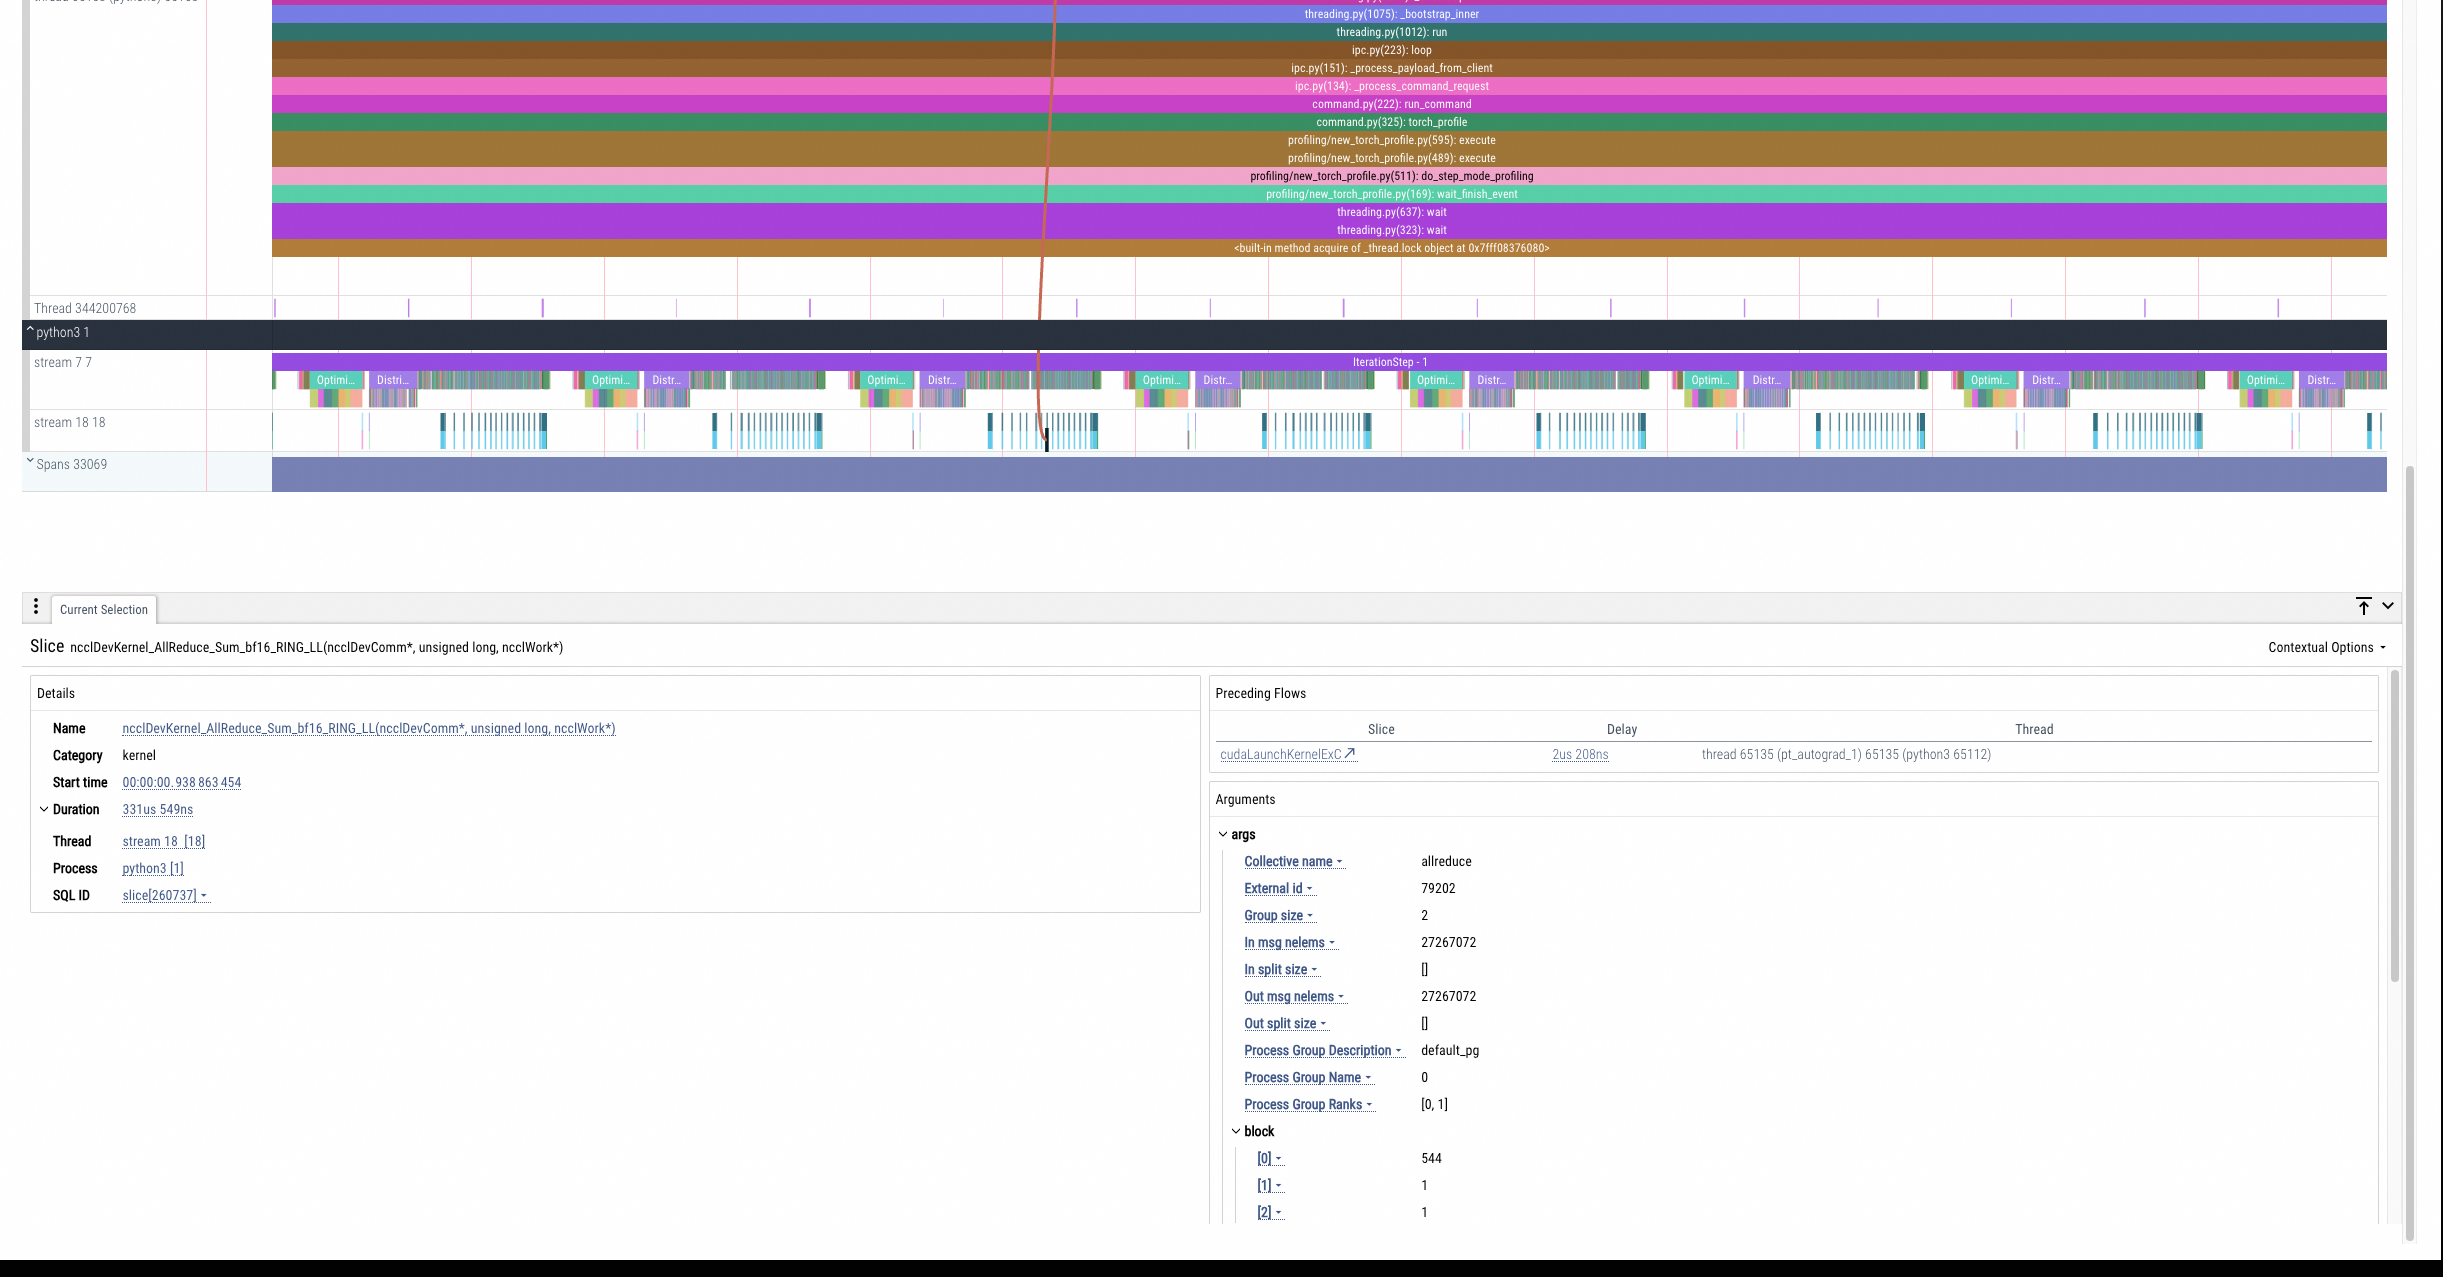
Ease of use: The entire profiling process is automated and completes in minutes. To trigger AI Profiling, simply configure the instance ID on the console. After collection, the system automatically uploads and analyzes the data, and then displays the report on the console. The built-in timeline view eliminates the need to export data to external tools like Chrome Tracing or Perfetto.
-
Stability: The feature has been deployed and verified in clusters with thousands of GPUs and does not affect the stability of AI jobs.
-
Flexible collection modes: Supports data collection by duration or by iteration. Advanced options also allow you to define custom iteration entry points and skip a specified number of initial iterations.
-
Low overhead: You can configure the richness of the collected data to manage performance impact. The overhead during collection ranges from 5% to 40%.
-
Multi-process support: Supports simultaneous profiling of multiple processes.
Use cases
This topic describes common scenarios where you can use AI Profiling to diagnose issues and take action based on the recommendations.
-
Troubleshoot failures that occur after you deploy an AI application.
-
Investigate why an AI job is running slower than expected.
-
Identify server bottlenecks, such as a time-consuming operator.
Prerequisites
If you are a RAM user, ensure that the primary Alibaba Cloud account grants the
AliyunECSReadOnlyAccessandAliyunSysomFullAccesssystem policies to your RAM user.Enable the console service.
When you log on to the Operating System Console for the first time, click Enable Service.
-
The SysOM component is installed. For installation instructions, see Component Management.
Procedure
-
Go to the Operating System Console > AI Profiling page.
-
Select or enter the required parameters and click Start Analysis.
Parameters
-
Instance ID: Choose the ID of an onboarded instance under your account. The instance must be equipped with a GPU and be running an AI job.
-
You can specify an AI job by entering the AI job PID or AI job process name. You can enter multiple AI job PIDs or AI job process names. Use a comma (
,) to separate multiple AI job PIDs or AI job process names. If you enter both an AI job PID and an AI job process name, the system processes the union of both during analysis.NoteYou can run the
topcommand to find the process ID (in the PID column) and process name (in the COMMAND column) of your AI job.You can also run the nvidia-smi command to view this information.
-
Data richness: Select the types of data to collect based on your needs. Options include GPU operators, Python call stacks, CPU information, Torch GPU memory, and FLOPs. You can select multiple options.
-
Analysis mode:
-
duration mode
Collects data for the time interval specified in Collection duration.
-
iteration mode
-
Iteration range: By default, iterations 0 to 10 are collected. You can configure the profiler to skip a specified number of initial iterations. This iteration count is specific to the data collection module and is independent of the iteration count within the AI job.
-
Iteration entry module: For example,
transformers.trainer. -
Iteration entry function:
-
For vLLM inference scenarios, the default is
LLMEngine.step. -
For training scenarios, the default is
Optimizer.step.
-
-
-
-
Collection duration: The duration for data collection in duration mode. The default is 2,000 ms, and the supported range is 1,000 ms to 5,000 ms.
-
-
In the Analysis Records section, click View Report for the desired record.
Interpreting the results
-
Analysis suggestions
This section provides recommendations based on the analysis of your AI job.
These suggestions typically include an assessment of overall GPU utilization, identification of the most time-consuming functions or modules, and recommendations for further analysis.
-
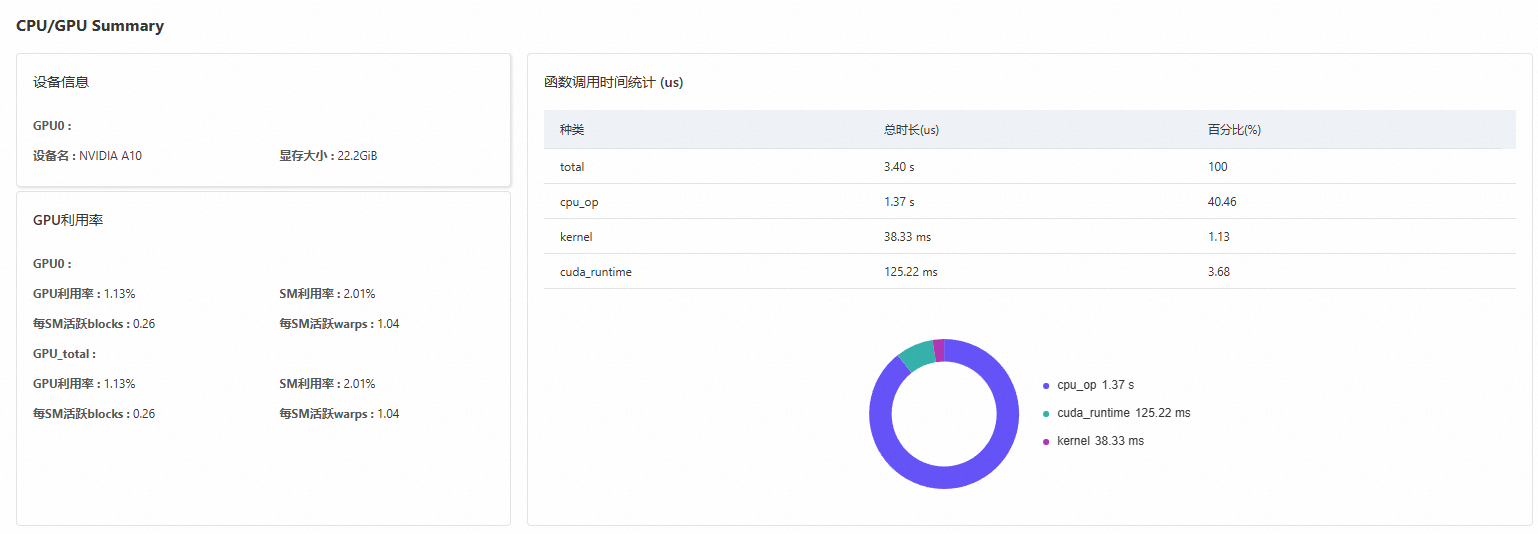
CPU/GPU summary
Displays device information, function call time statistics (in microseconds), and GPU utilization, as shown in the following figure.
-
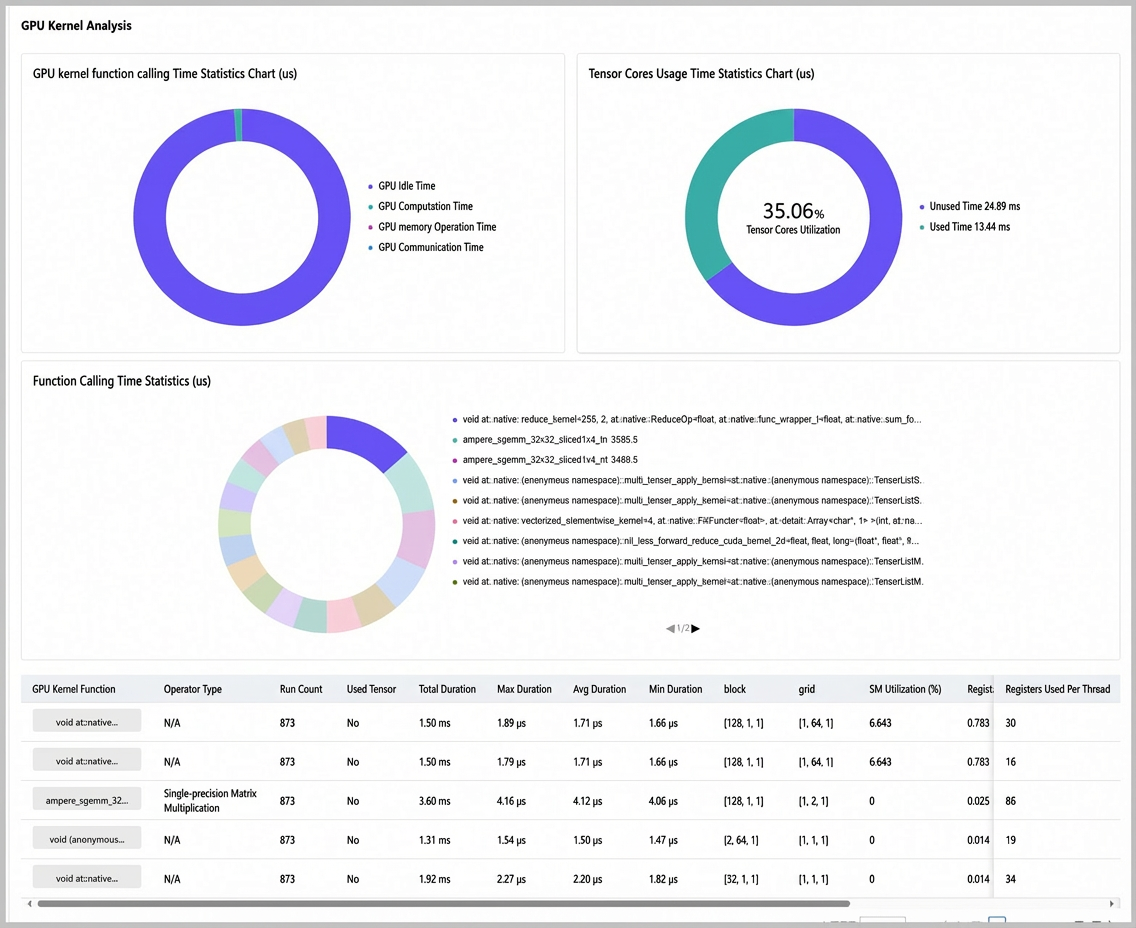
GPU kernel analysis
This section displays charts for GPU kernel call times and Tensor Core usage (us), along with detailed statistics for each GPU kernel, as shown in the following figure.
-
Iteration statistics and differential analysis
-
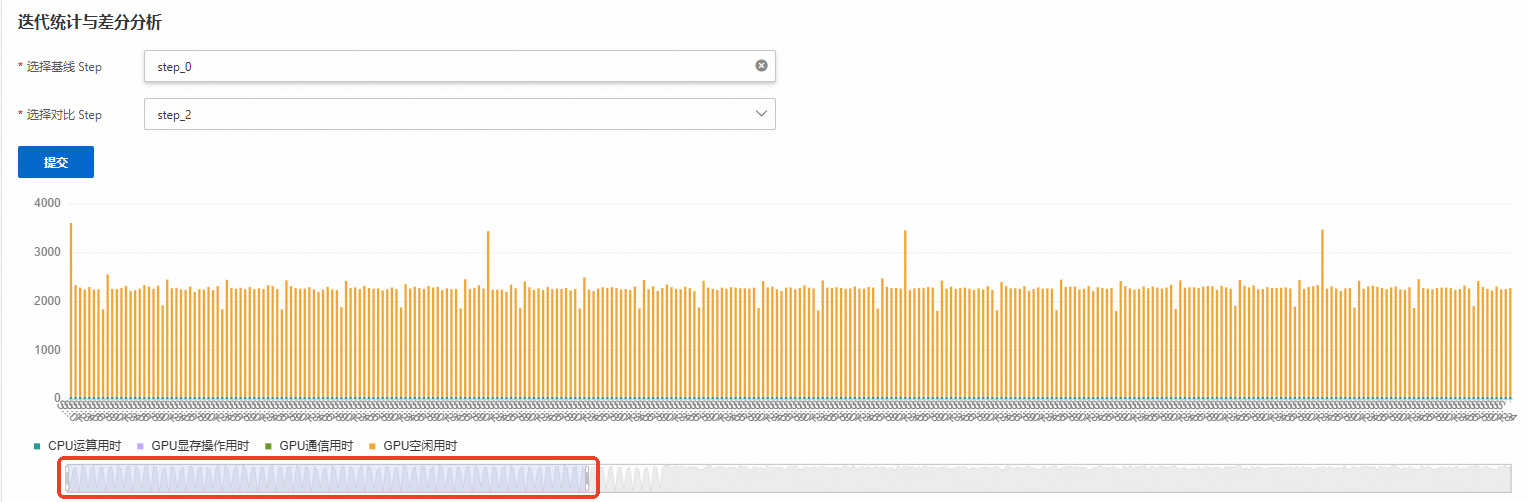
AI iteration statistics
This feature uses iteration markers to anchor the training or inference process and perform separate statistical analysis for each iteration. It calculates the loss value and the time spent on computation, storage, and communication for each iteration. The data is summarized in a bar chart to help you visually identify iterations with abnormal gradients or unusually high communication times. You can drag the slider to view data for specific iterations, as shown in the following figure.
-
For training jobs, the system uses
Optimizer.stepas the default iteration delimiter. -
For inference jobs, the system uses the
LLMEngine.stepfunction as the default delimiter.
-
-
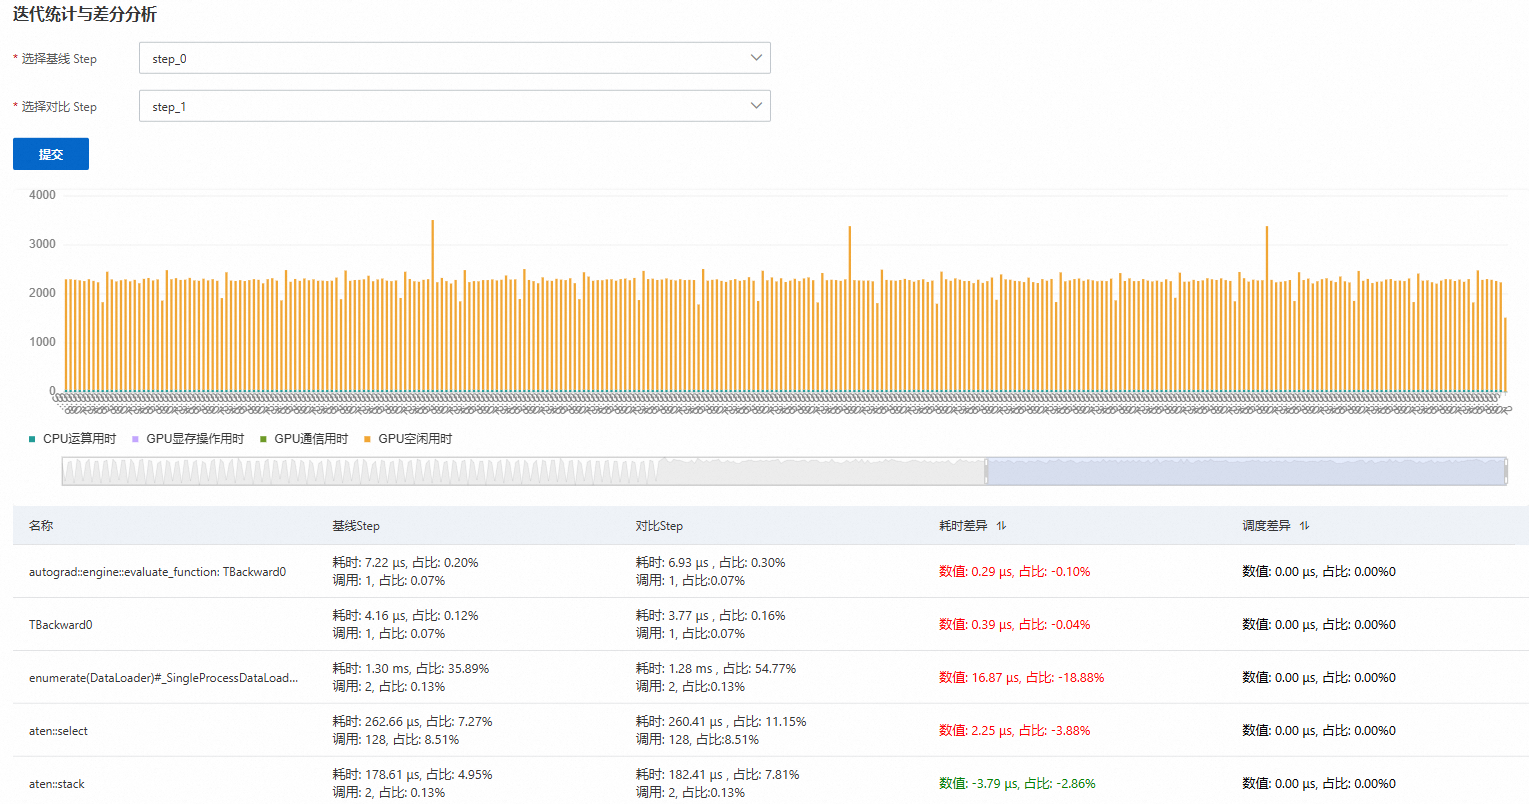
AI differential analysis
The timeline data collected by AI Profiling can be complex and large (gigabyte-scale), making manual analysis difficult. In performance comparison or anomaly analysis scenarios, traditional methods struggle to quickly identify differences between two datasets. AI differential analysis compares the kernel function duration and call count differences between an abnormal and a normal iteration. This allows you to precisely locate the root-cause functions responsible for performance differences across iterations, enabling rapid bottleneck identification and optimization.
Select a Baseline step and a Comparison step, and then click Submit. For example, you can select a normal iteration as the baseline and an abnormal iteration for comparison, as shown in the following figure.
Parameter
Description
Name
The root-cause function.
Baseline step
The duration, call count, and their respective percentages for the selected iteration.
Comparison step
Duration difference
The difference in duration and percentage between the Baseline Step and the Comparison Step.
Call count difference
The difference in call count and percentage between the Baseline Step and the Comparison Step.
-
-
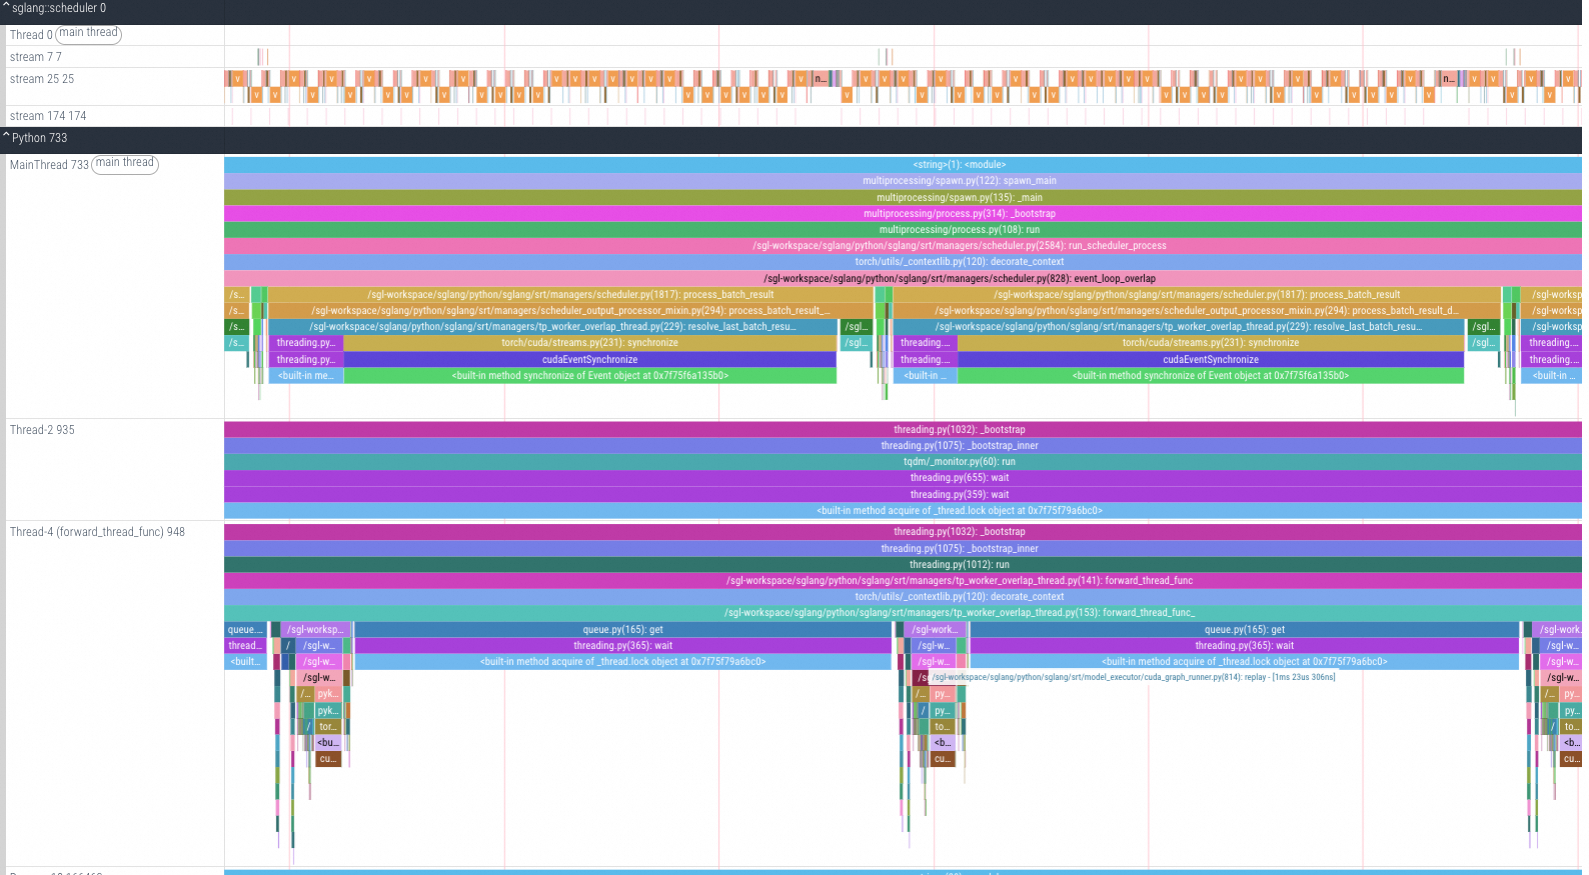
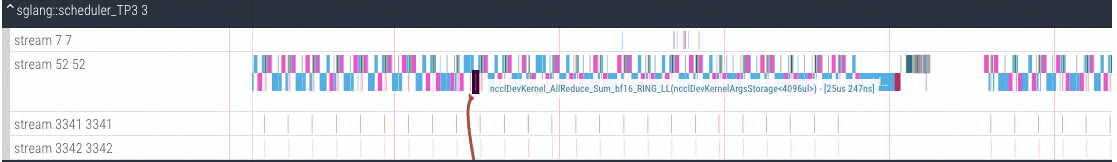
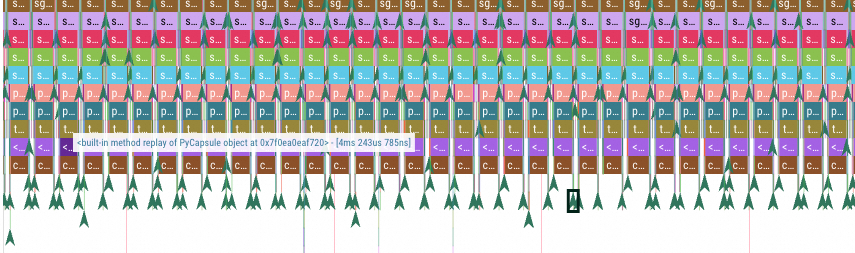
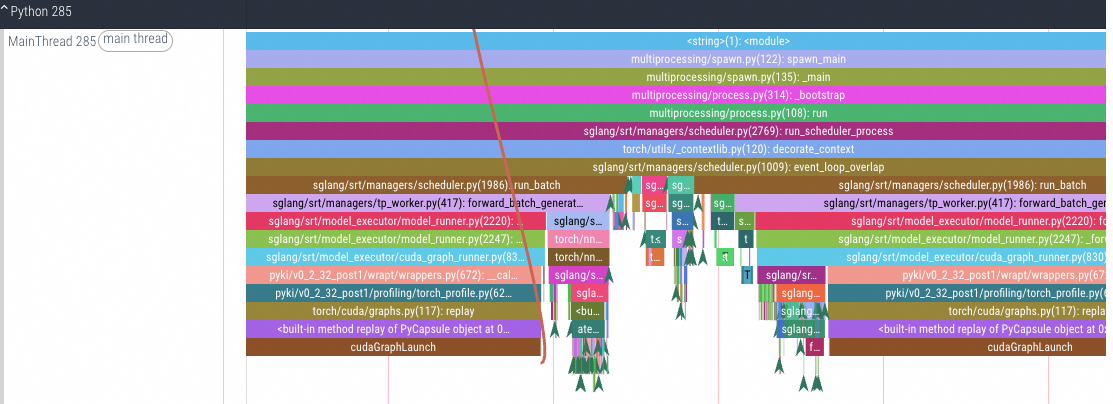
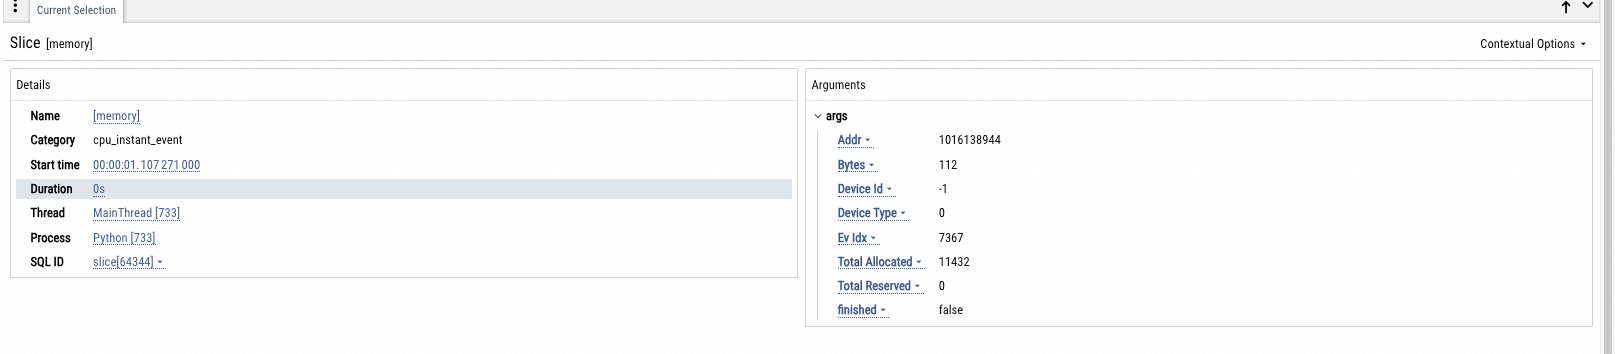
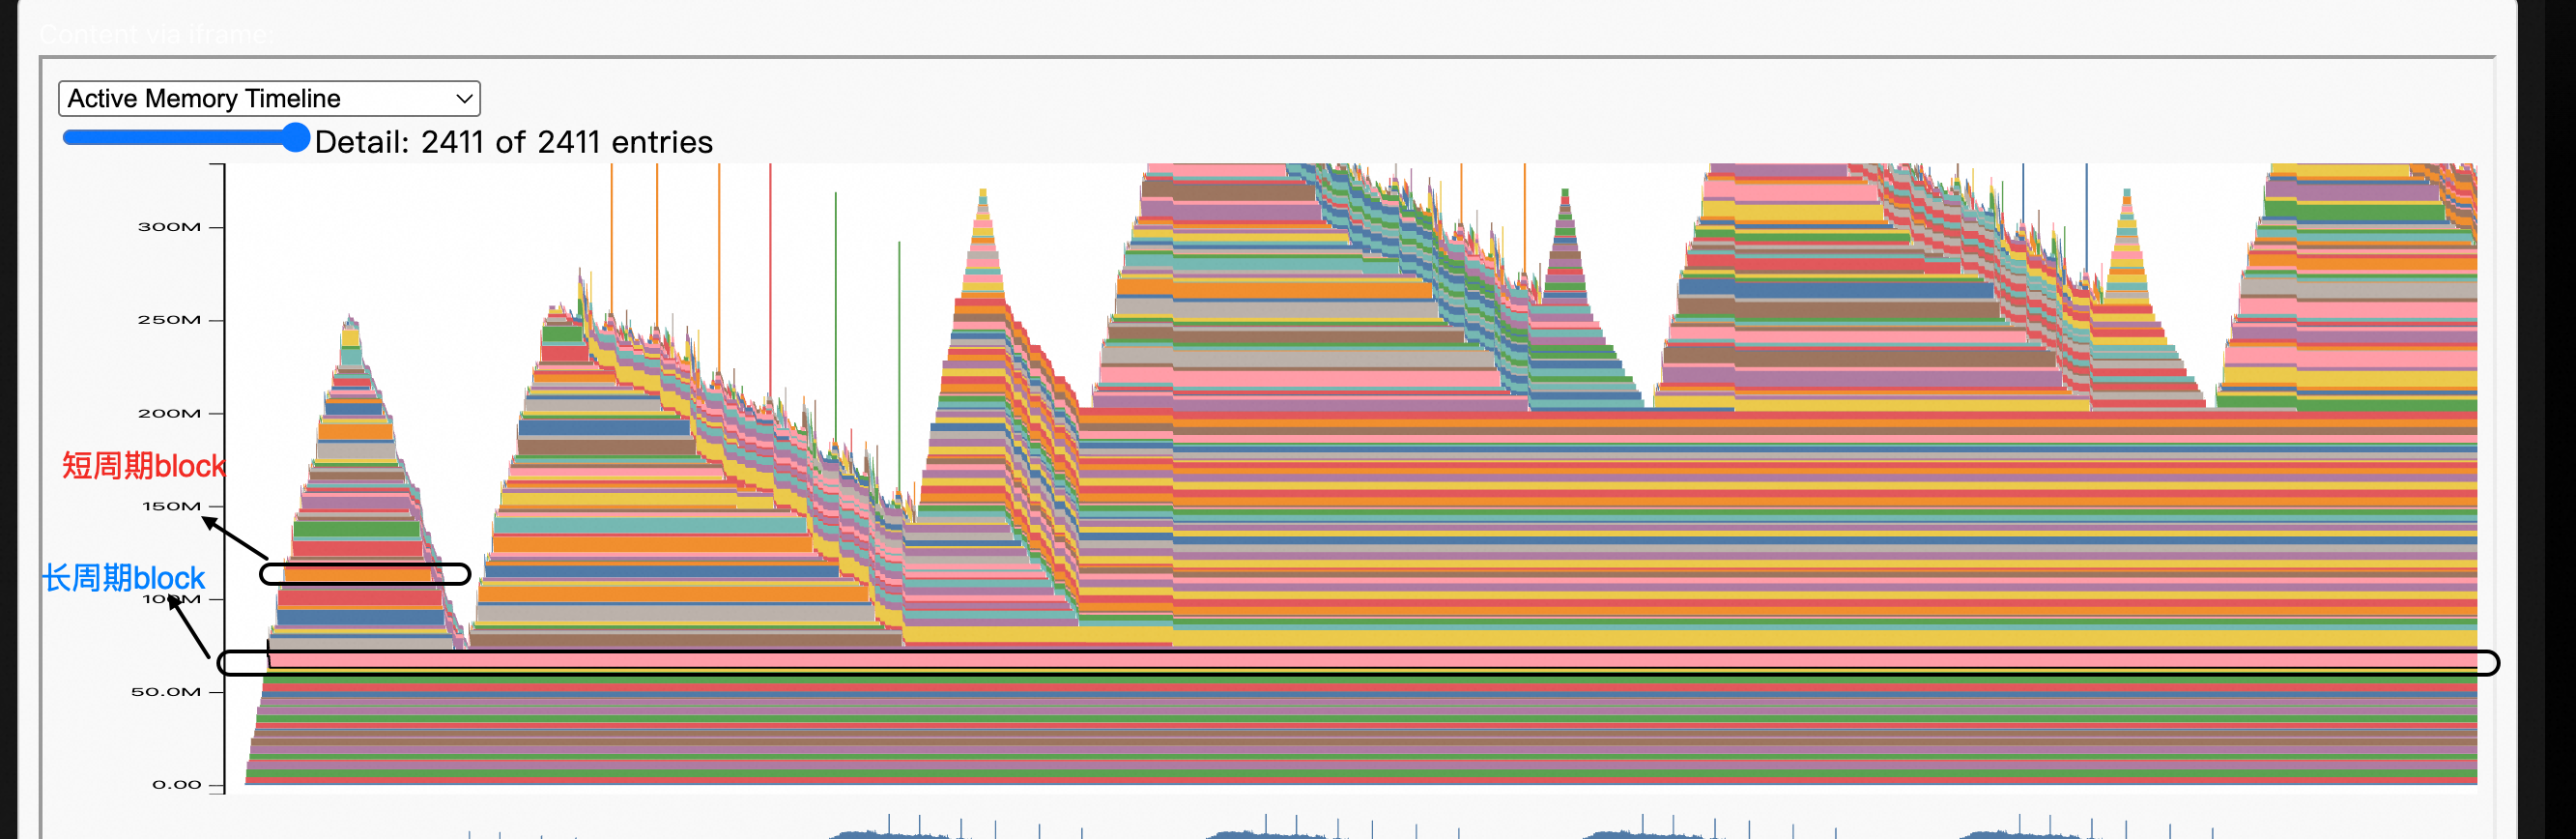
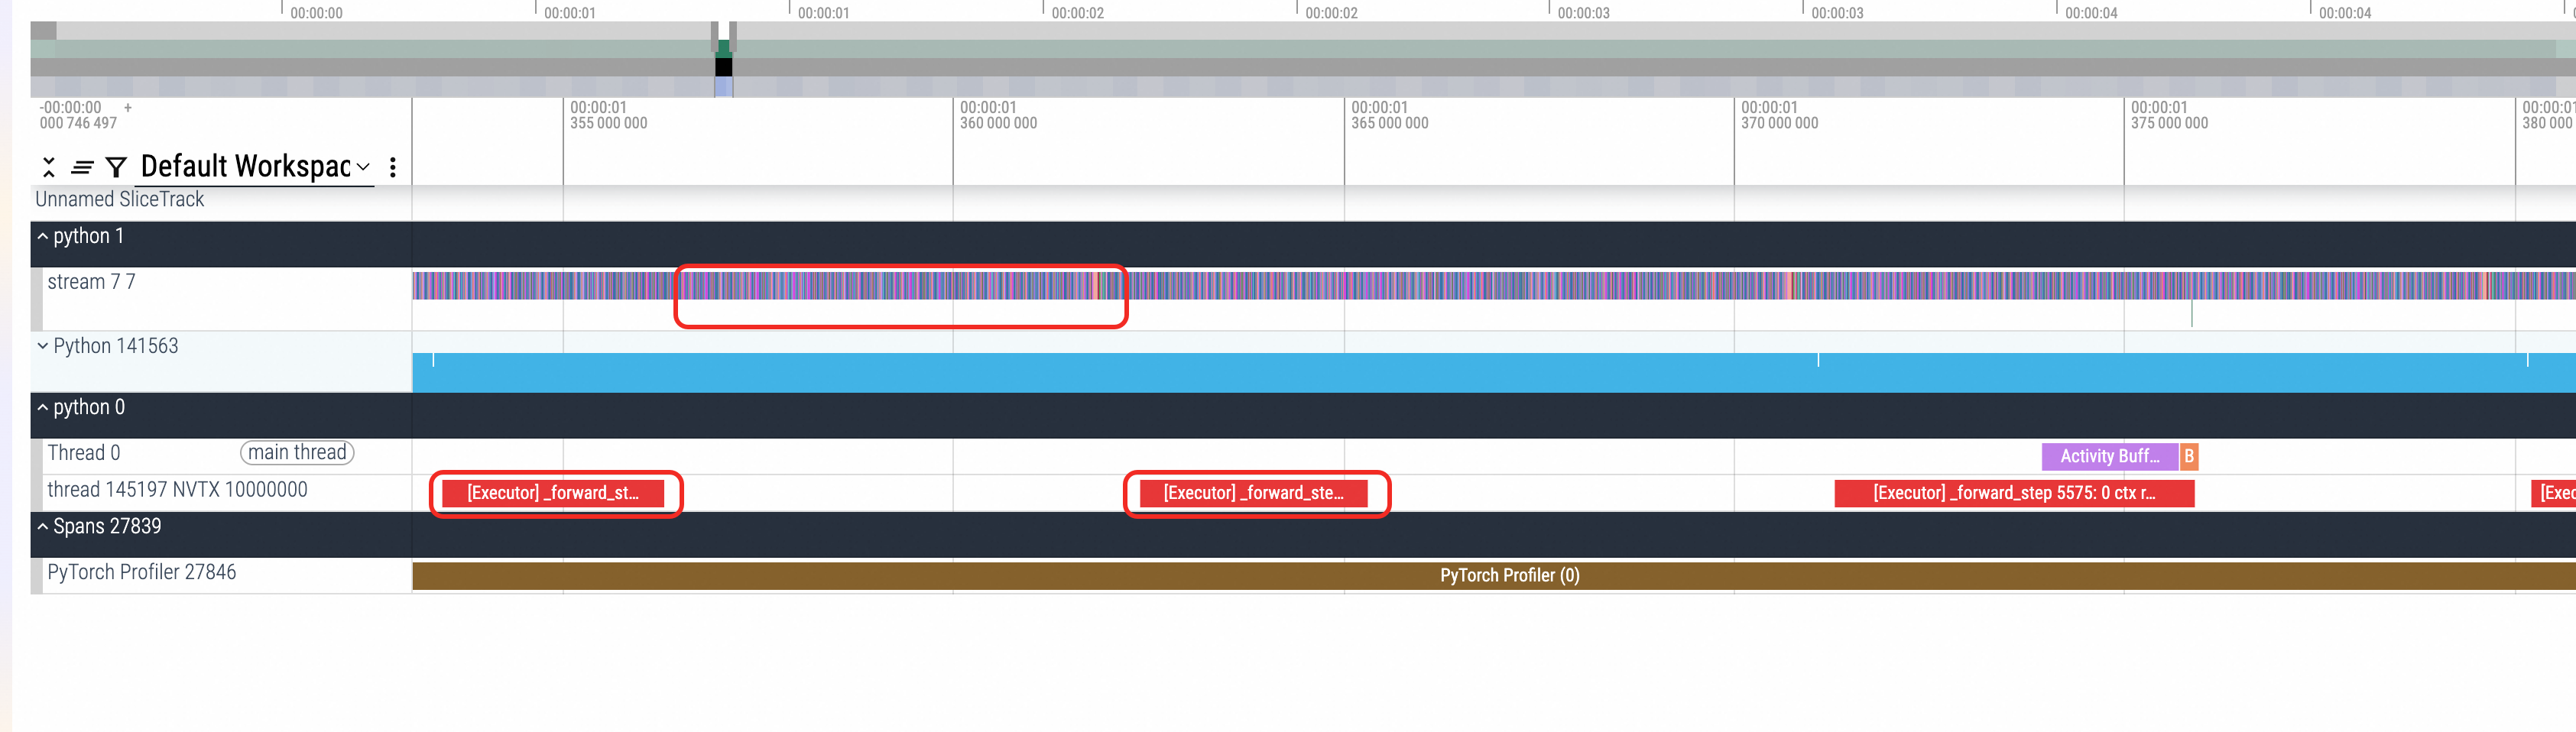
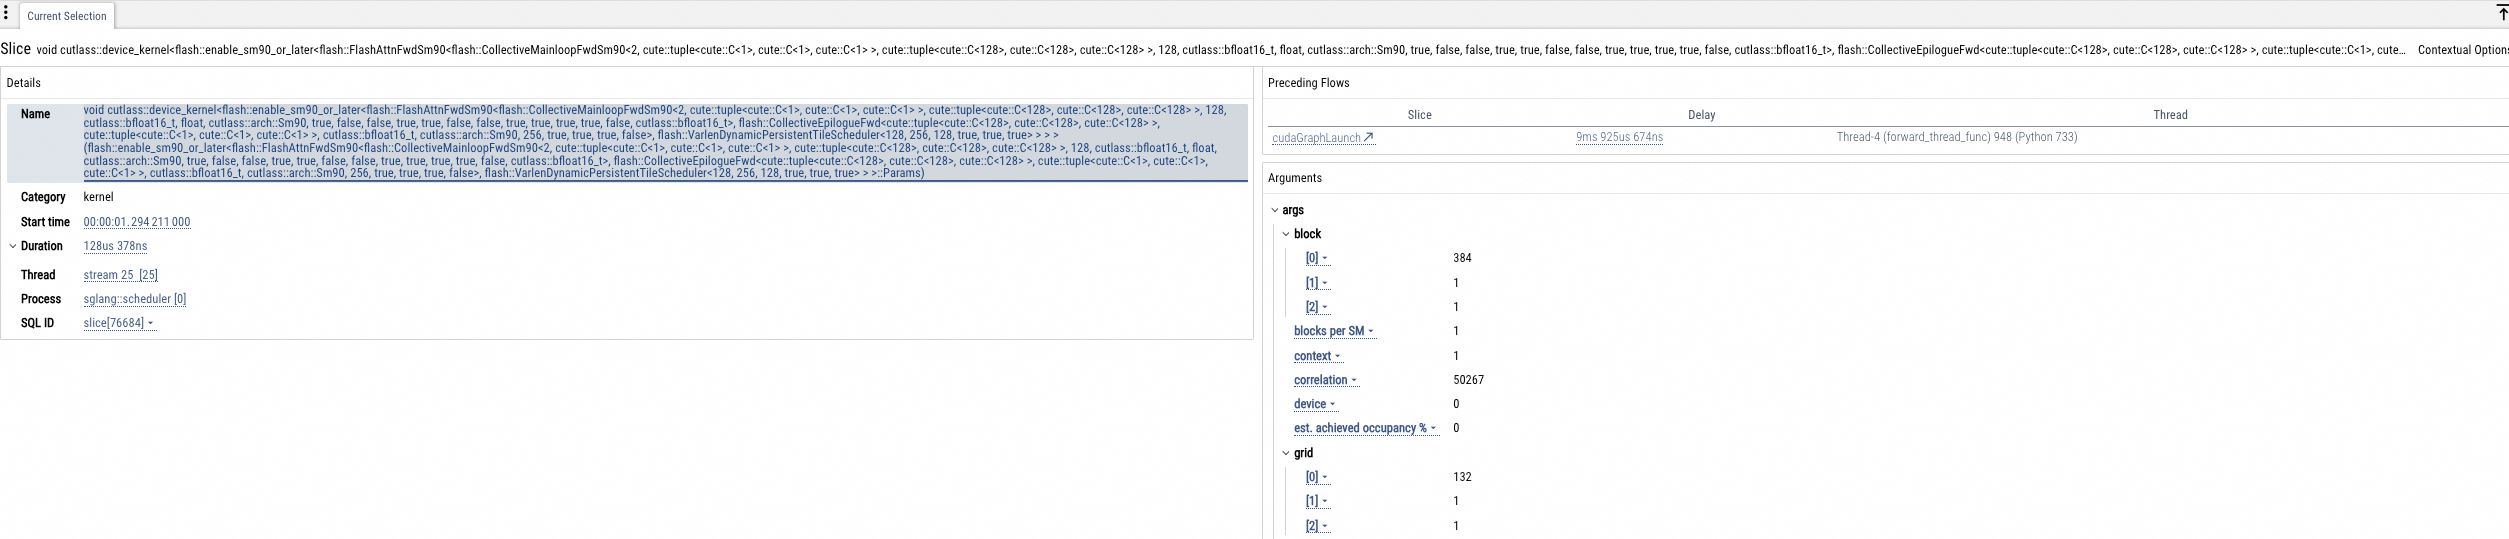
CPU/GPU tracing analysis
The built-in timeline view eliminates the need for external tools like Chrome Tracing or Perfetto. You can analyze configurable data types, including Python call stacks, CPU information, GPU operators, Torch data, GPU memory, and FLOPs.