This topic describes how to diagnose Shared Memory Communications (SMC) faults.
Prerequisites
The smc-tools O&M toolset provided by Alibaba Cloud Linux 3 is installed.
If the smc-tools toolset is not installed, you can run the following command to install it.
sudo yum install -y smc-toolsFallback diagnostics
The SMC protocol stack automatically negotiates with the peer during connection establishment to decide whether to use SMC. If the conditions for SMC are not met, the connection safely falls back to TCP. You can use the smcss command to view the fallback reason for each SMC connection. For more information, see Connection monitoring.
Packet capture diagnostics
The SMC protocol stack uses technologies such as elastic Remote Direct Memory Access (eRDMA) for data transmission. This process bypasses the traditional network protocol stack. Therefore, traditional sniffing points cannot directly capture data and control packets.
Starting from version ANCK 5.10.134-18, the Alibaba Cloud Linux 3 kernel provides a solution to capture data and control packets from the SMC protocol stack:
When the SMC kernel stack sends or receives connection control messages and data blocks in shared memory, it constructs a UDP socket buffer (skb). The skb points to the target data memory and is sent to a specific virtual network device (dummy device). The virtual network device silently consumes the skb, which never actually enters the network. During this process, the skb passes through existing kernel sniffing points, such as
dev_queue_xmit_nit(). This allowstcpdumpandlibpcapto capture the data and control packets that the SMC stack sends or receives on the virtual network device.
The TCP network packets from the SMC handshake process are still captured on the original Ethernet network interface controller (NIC).
The following table summarizes the packet capture methods for these two stages.
Packet type | Traffic-bearing device | Capture device | Captured packet format |
SMC handshake negotiation TCP packets or packets sent after a fallback to the TCP protocol stack | Ethernet NIC (for example, | Ethernet NIC (for example, | TCP message |
SMC data or control packets | RDMA NIC (for example, | Virtual NIC (for example, | UDP datagram |
smc-tools provides the smcdump-ex packet capture tool based on this solution. smcdump-ex is a wrapper script for the tcpdump tool that captures the entire SMC communication process. The script creates a virtual network device named smc-dummy{four-random-characters} in the current net namespace and enables the capture of SMC data and control packets. It uses tcpdump to capture SMC handshake negotiation packets, data packets, and control packets on Ethernet or virtual network devices as required. When it receives a SIGINT signal (Ctrl+C), it stops the capture, disables the capture feature, and destroys the virtual network device.
Tool usage
You can run the following command to view the usage of
smcdump-ex.Warningsmcdump-ex is an experimental tool. Its usage may change in the future.
smcdump-ex -h
usage: smcdump-ex [-h] [-m {all,smc,smcd,smcr}] [-t {all,raw,cdc}]
                  [--param PARAM] [--filter FILTER] [--legacy]
SMC Dump - SMC Traffic Capture (Experimental)
optional arguments:
  -h, --help            show this help message and exit
  -m {all,smc,smcd,smcr}, --mode {all,smc,smcd,smcr}
                        Select the mode (default: smc)
  -t {all,raw,cdc}, --type {all,raw,cdc}
                        Select the packet type (default: all)
  --param PARAM         Additional parameters for tcpdump. e.g. --param '-w
                        packets.pcap'
  --filter FILTER       Additional filter expressions for tcpdump. e.g.
                        --filter 'host xxx.xxx.x.x and port 8080'
  --legacy              Use the legacy SMC dump header format
Use
-mto set the data capture modeThe following capture modes are available:
all: Captures packets on all network interfaces, which is equivalent to callingtcpdump -i any. This captures SMC handshake negotiation packets on the Ethernet interface and SMC data and control packets on the new virtual network interface. In this mode, you can use--filterto set additionaltcpdumpfilter expressions. This narrows the scope of packet capture to accurately capture SMC negotiation packets. For more information, see the description of--filter.smc,smcr, andsmcd: Captures only SMC, SMC-R, or SMC-D data and control packets on the new virtual network interface. This is equivalent to callingtcpdump -i smc-dummy{four-random-characters}.
Use
-tto set the type of network packets to captureThe following network packet types can be captured:
all: SMC data and control packets.raw: SMC data packets only.cdc: SMC control packets only.
Use
--paramto set othertcpdumpparametersFor example, you can use
--param '-w smcdata.pcap'to dump the captured content to a file.Use
--filterto set othertcpdumpfilter rulesFor example, you can use
--filter 'host <ip> and port <port>'to set the IP address and port of the packets to capture. This ensures that SMC negotiation packets are accurately captured and prevents other TCP network packets from interfering with the analysis.Use
--legacyto parse the oldsmc dump headerformatThis parameter is only for compatibility with kernel version
ANCK 5.10.134-17.3. For kernel versionsANCK 5.10.134-18and later, you do not need to set this parameter.
Usage example
For example, to capture all packets during the communication of an SMC connection with the IP address 192.168.2.5 and port 5201, and dump them to the
smc.pcapfile, run the following command:smcdump-ex -m all -t all --param '-w smc.pcap' --filter 'host 192.168.2.5 and port 5201'The captured results saved to a
.pcapfile using the--param '-w <pcap file>'parameter can be further analyzed with the Wireshark tool and a Lua plugin:Download and install Wireshark.
You can use Wireshark with the Lua plugin to analyze the captured results stored in the
.pcapfile.Download the Lua plugin: https://os-smc-new.oss-cn-hangzhou.aliyuncs.com/smc_dump.lua.
NoteTo use this Lua plugin, ensure that the Lua interpreter in Wireshark is version 5.3 or later.
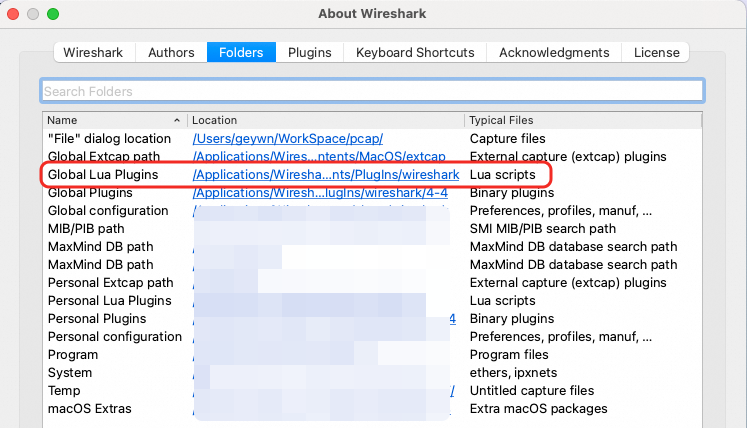
Find the installation path for the
Wireshark Lua scriptand place the Lua script in that path.You can view the installation path of the
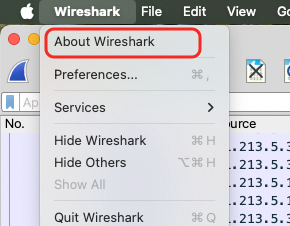
Wireshark Lua scripton macOS.Run Wireshark.
From the menu bar, click .
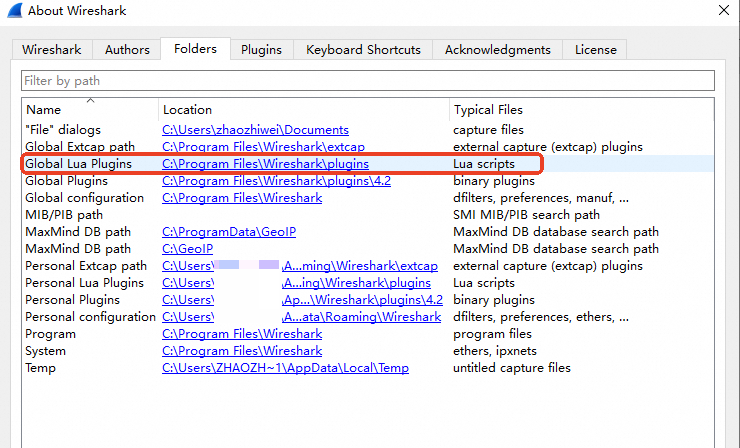
You can find the installation path of the
Wireshark Lua scripton Windows.Run Wireshark.
From the main Wireshark interface, click .
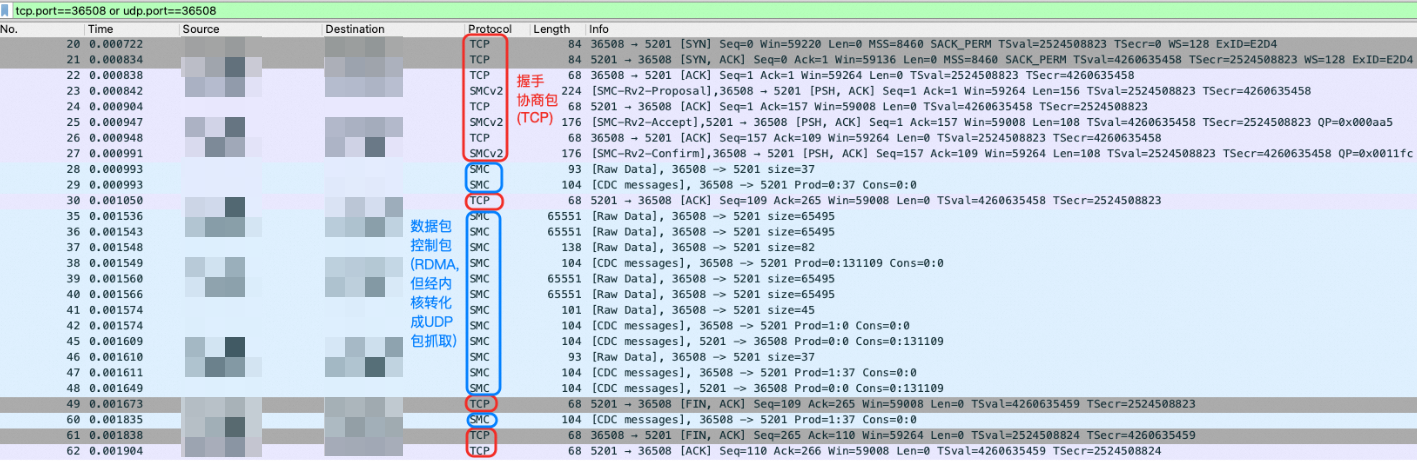
Restart Wireshark or reload the Lua plugins to apply the script. After this, all UDP packets that have an SMC dump header in their payload will be parsed as the SMC protocol, as shown in the following figure.
Performance diagnostics
If you encounter issues such as SMC performance degradation during comparative performance tests, you can use basic performance testing tools to perform an initial diagnosis.
For SMC, you can use basic network performance testing tools such as
sockperf,qperf,iperf3, andnetperfto run bandwidth and latency benchmark tests.For eRDMA, you can use the
perftestbasic performance testing tool to run bandwidth and latency benchmark tests. For more information, see eRDMA network performance tests.
If SMC or eRDMA shows performance degradation during the benchmark tests, submit a ticket for further assistance. If the benchmark tests are normal, check your SMC configuration as described in Enable and configure Shared Memory Communications (SMC).