Connect FineReport to AnalyticDB for MySQL
This topic describes how to use FineReport to connect to an AnalyticDB for MySQL cluster and manage reports.
Prerequisites
-
You are familiar with the compatibility between FineReport and AnalyticDB for MySQL. For more information, see Compatibility overview.
-
You have installed MySQL Connector/J.
-
You have installed FineReport. A new FineReport installation requires a MySQL server, such as ApsaraDB RDS for MySQL, to store metadata. FineReport offers two methods for creating a data connection:
-
Method 1: Connect in the data decision-making system. For more information, see Connect to a database using JDBC.
-
Method 2: Connect in the designer. For MySQL 5.x, see MySQL data connection. For MySQL 8.x, see MySQL 8 Data Connection Plug-in.
-
-
To connect to an AnalyticDB for MySQL cluster over the internet, see Apply for and release a public endpoint.
Connect to AnalyticDB for MySQL
-
Start FineReport. In the menu bar, choose .
-
On the Define Data Connection page, configure the connection parameters.
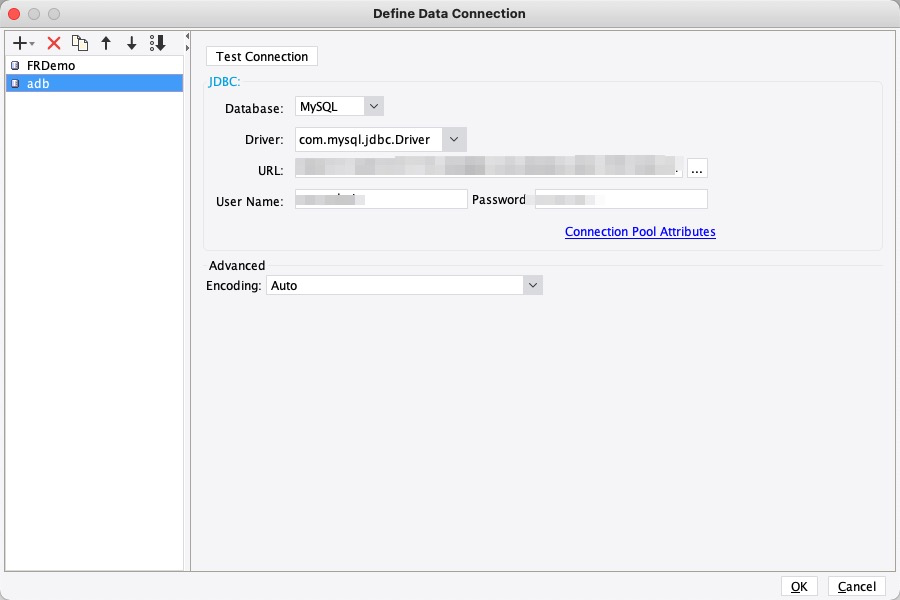
Parameter
Description
Database
Select Insert.
Driver
Select com.mysql.jdbc.Driver.
Basic
The connection string for the AnalyticDB for MySQL cluster. The format is
jdbc:mysql://hostname:port.-
hostname: The public endpoint or Virtual Private Cloud (VPC) endpoint of the cluster. -
port: The port number. The default is 3306.
Database Account
The account for your AnalyticDB for MySQL cluster. You can use one of the following account types:
-
privileged account
-
standard account
Password
The password for the account.
-
-
After you configure the parameters, click Test Connection. If the test is successful, click OK to connect to the AnalyticDB for MySQL cluster.
Add a dataset
After connecting to AnalyticDB for MySQL, create a dataset. A dataset uses SQL queries to retrieve data from the database, which is then displayed as a two-dimensional table in the dataset management panel.
-
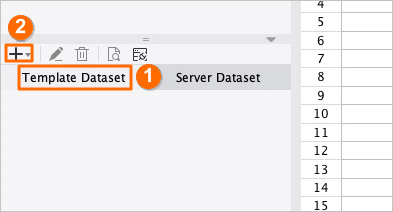
In the dataset management panel, select the Template Dataset tab and click + at the top.
-
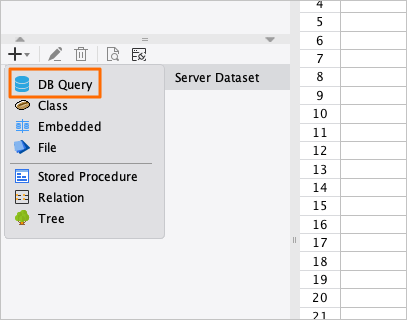
From the drop-down list, select Expand.
-
In the DB Query dialog box, select the data source for your AnalyticDB for MySQL cluster and the target table. Enter an SQL query to create a new dataset named ds1. For example, the query
select * from demo_salesretrieves all data from thedemo_salestable.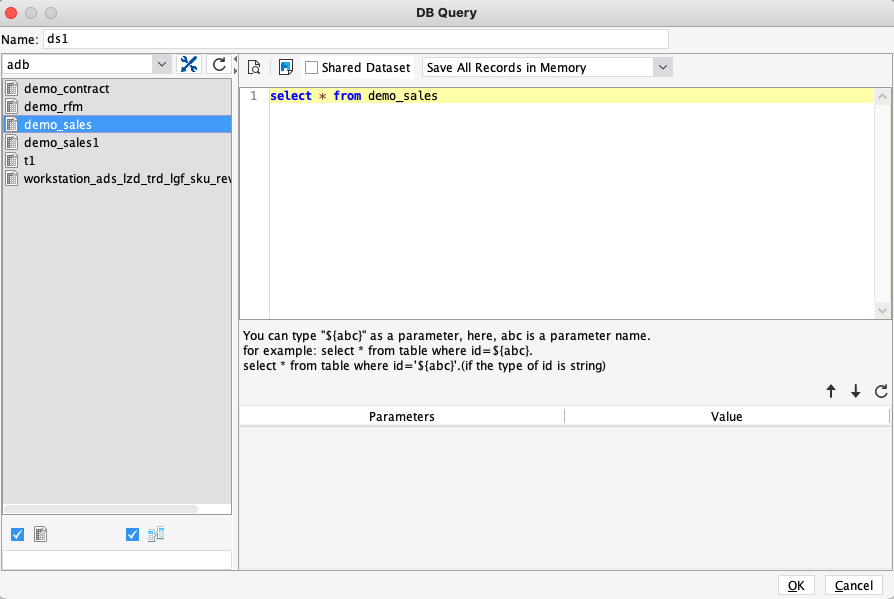
-
Use an aggregate query to create a new dataset. For example, create a dataset named
ds2and run the querySELECT store_name, SUM(sales_amount) AS total_sales FROM demo_sales GROUP BY store_nameto retrieve the total sales for each store. -
Click OK. The retrieved data appears in the dataset management panel.
Example
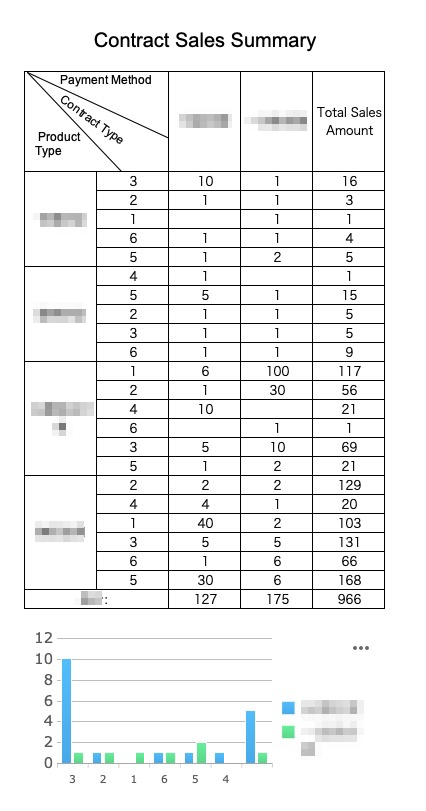
This example shows how to create a report with a table and a column chart. The report displays the maximum contract sales and total sales volume, grouped by product type, contract type, and payment type. The final report is shown in the following figure:
-
Download the "Contract Sales Summary" sample data file: demo_contract.
-
Create a table in AnalyticDB for MySQL.
-
Use a column with an even data distribution as the distribution key and a time-based column as the partition key. For more information, see Table schema design.
-
In the sample data, the values in the
contract_idcolumn are randomly distributed. Use this column as the distribution key. The following DDL statement creates the table:CREATE TABLE `demo_contract` ( `contract_id` VARCHAR, `customer_id` VARCHAR, `contract_type` VARCHAR, `amount` BIGINT, `payment_type` VARCHAR, `register_time` DATE, `purchase_amount` INT, `create_time` TIMESTAMP, `product_type` SMALLINT, `paid` tinyint, PRIMARY KEY (`contract_id`) ) DISTRIBUTED BY HASH(`contract_id`) INDEX_ALL='Y' STORAGE_POLICY='COLD'
-
-
After creating the table, use Kettle to import the downloaded Excel file into AnalyticDB for MySQL.
-
For more information about using Kettle, see Import data to Data Warehouse Edition by using Kettle.
-
After the import is complete, execute
select count(*) from demo_contract, and you will see that there are 668 records.
-
Use the imported data to generate the sample report:
-
Create two datasets in FineReport, d1 and d2. These datasets will retrieve the maximum contract sales for each payment type and the total sales volume, grouped by product type and contract type.
-
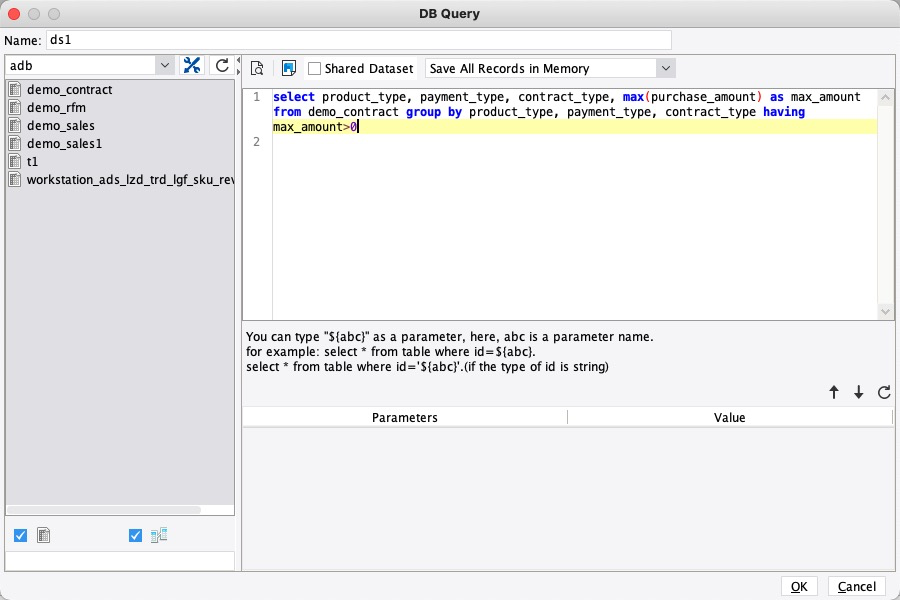
The dataset
d1groups the data by product type, contract type, and payment type, and retrieves the maximum sales volume for each group:SELECT product_type, payment_type, contract_type, MAX(purchase_amount) AS max_amount FROM demo_contract GROUP BY product_type, payment_type, contract_type HAVING max_amount>0 -
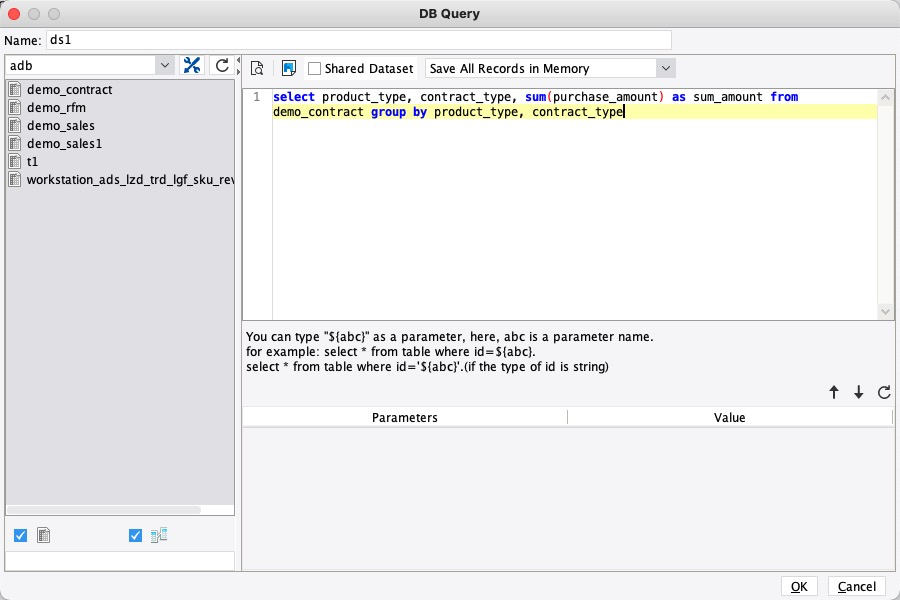
The dataset
d2groups the data by product type and contract type to calculate the total sales volume for all payment types:
-
-
Design the table:
-
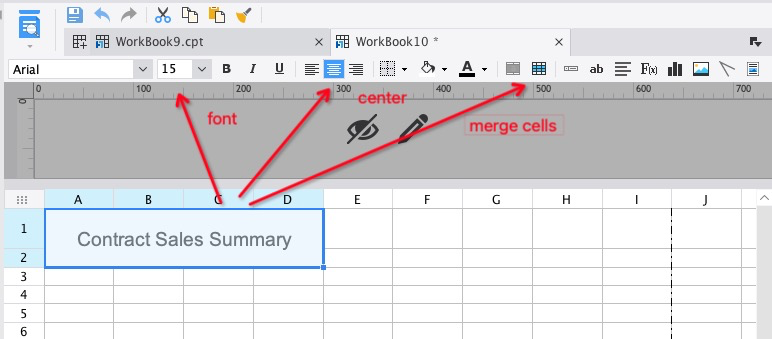
Title: Merge cells A1 to D2, enter the report title "Contract Sales Overview", and format the text to be bold, centered, and 15-point font.
-
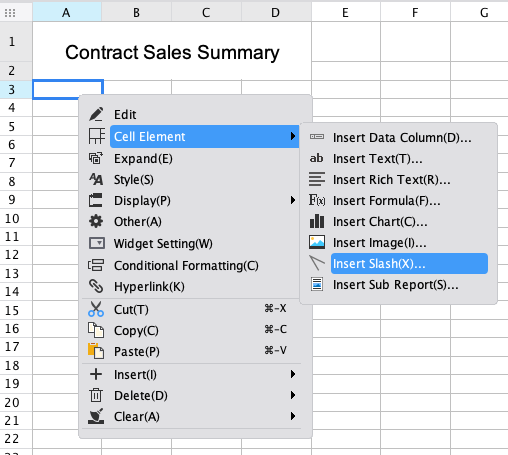
Slashed header cell: To display three header fields separated by slash lines in a single merged cell, merge cells A3 and B3. Right-click the merged cell and choose . In the Slope Line dialog box, enter the text
Payment Type | Contract Type | Product Type. Add spaces as needed to adjust the text position.
-
-
Bind data:
-
Drag the data columns from the dataset to the corresponding cells.
-
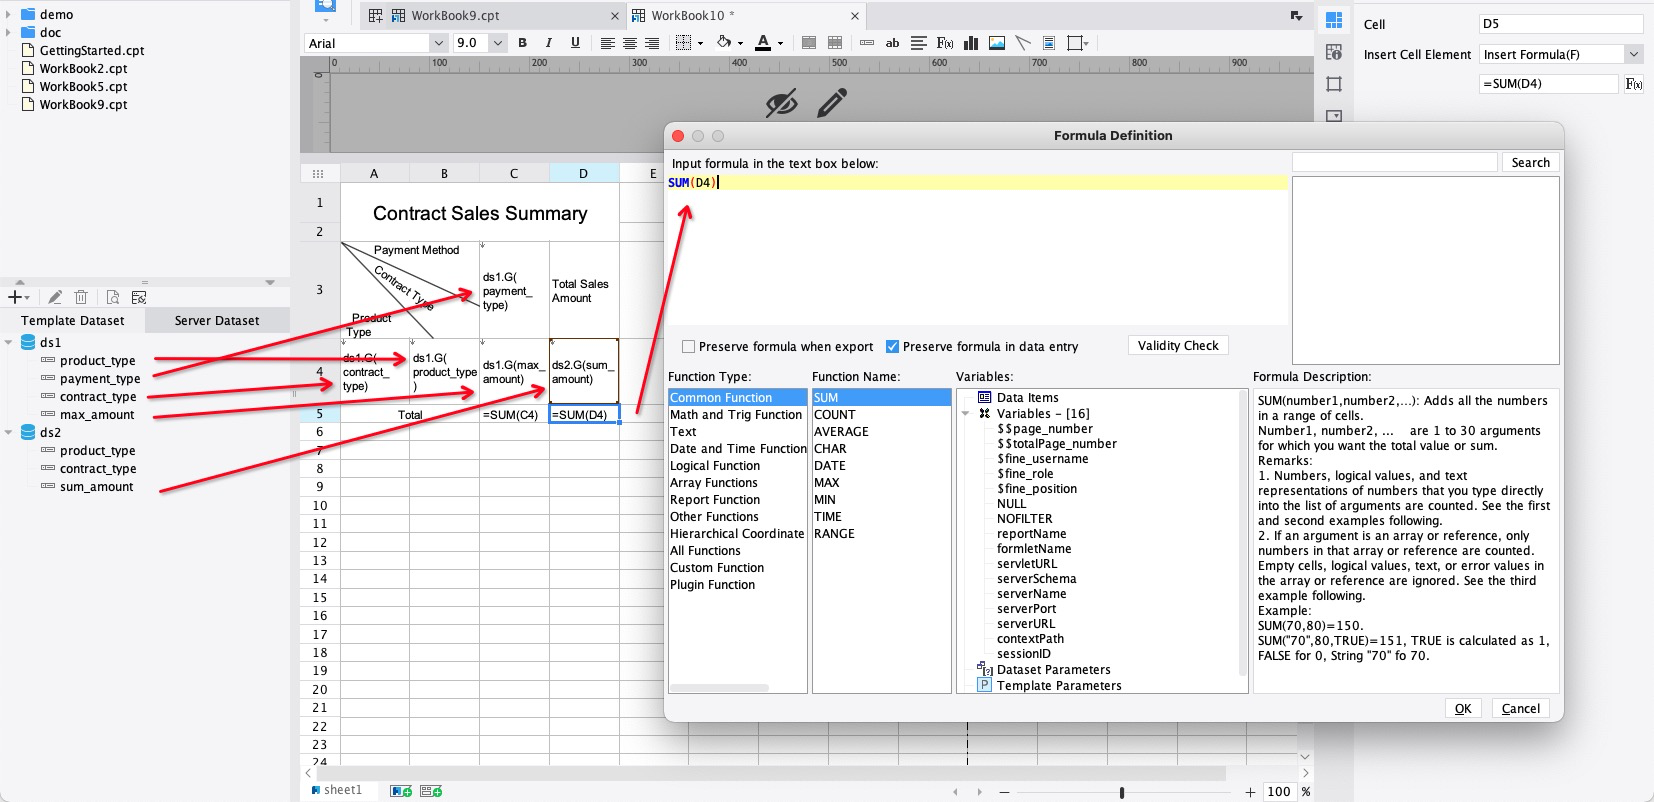
To calculate the total sales volume for each product, cell C5 must sum the values from cell C4. To do this, select cell C5, click Insert Formula in the shortcut bar, and enter the formula
SUM(C4)in the formula editor. -
Similarly, to calculate the total sales volume for all products, insert the formula
SUM(D4)into cell D5.
-
-
Configure cell properties:
-
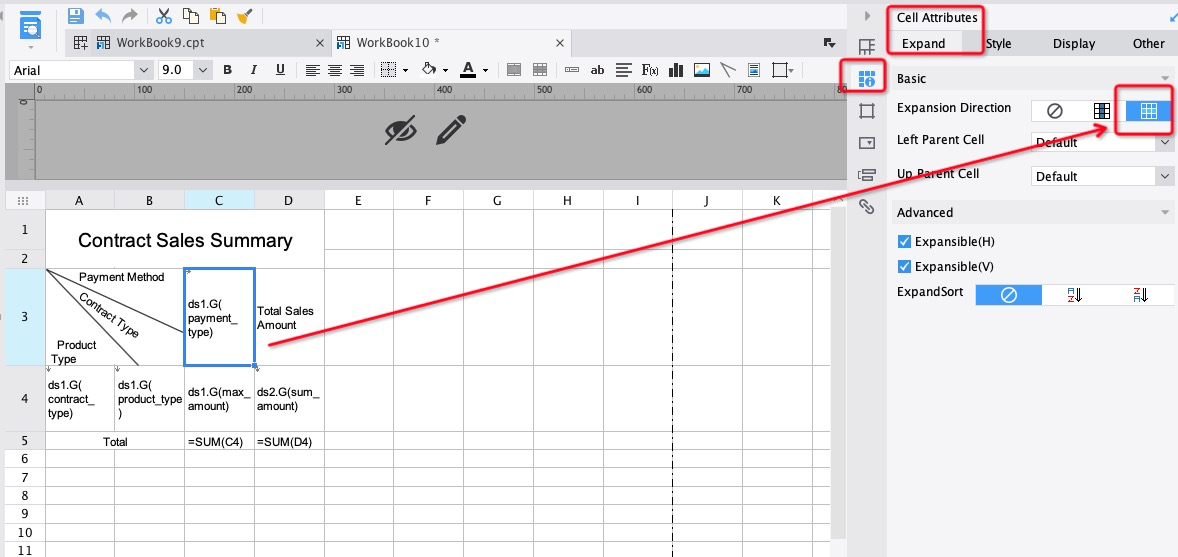
Select cell C3. To expand the data horizontally, in the properties panel, choose and set Expand Direction to Preview.
-
Cell C4 does not need to expand because its value is uniquely defined by the expansion of cells A4, B4, and C3. Set its expansion direction to none. The expansion direction for cells C5 and D5 must also be set to none.
-
-
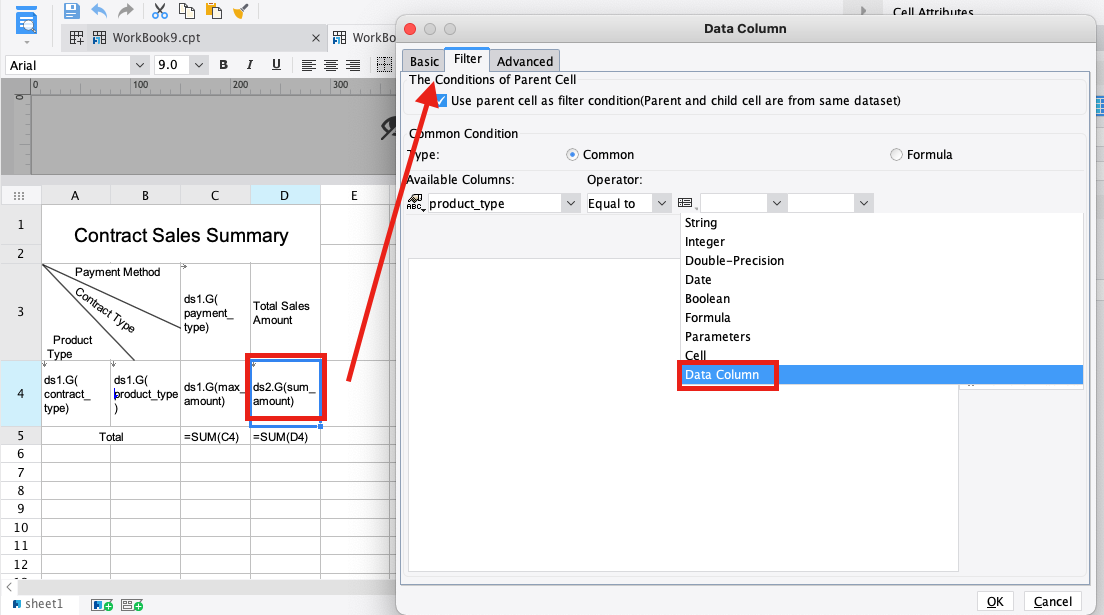
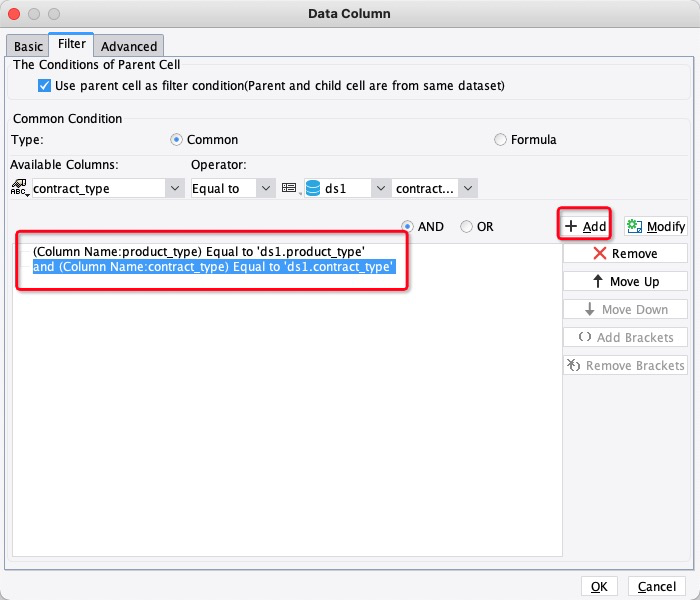
Link multiple datasets: When a report uses data from different datasets, you must link them by adding a data filter.
This report uses data from two datasets, ds1 and ds2, which share the
product_typeandcontract_typefields. Use these common fields to link the datasets by double-clicking cell D4 to open the Data Column dialog box. On the Filter tab, add a condition to bind theproduct_typeandcontract_typefields from ds1 and ds2. -
Design the chart:
-
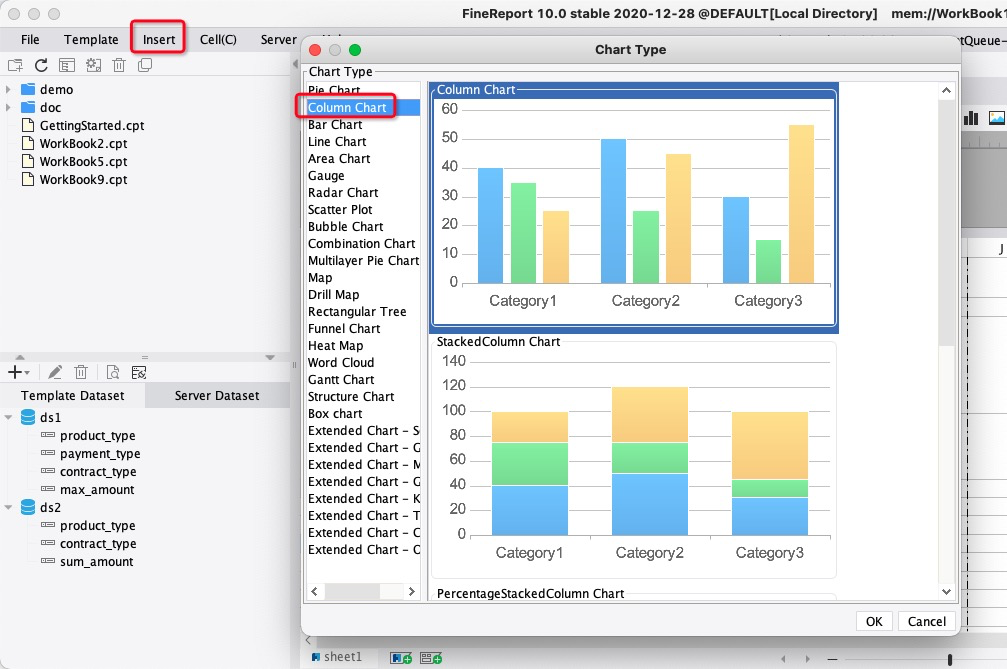
Merge cells A7 to D15. From the menu bar, choose . Select and click OK.
-
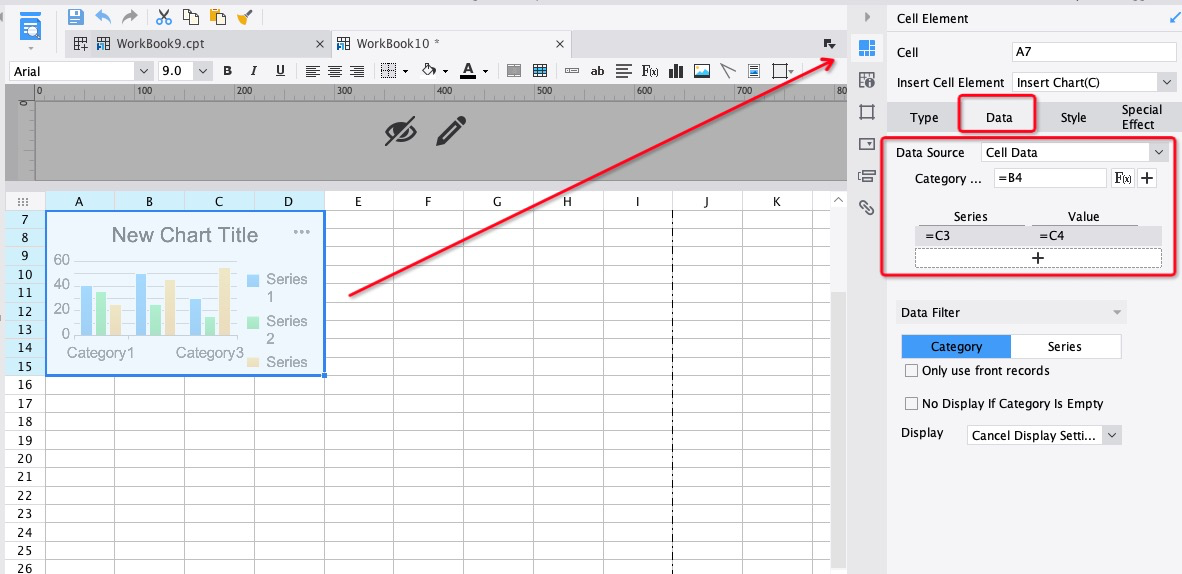
Select the chart. In the properties panel, choose to configure its data. Set Data Source to Cell Data, Category to =B4, Series to =C3, and Value to =C4.
NoteYou must include the equals sign (=) when setting the Category, Series, and Value. Otherwise, FineReport treats the cell reference as a string.
-
-
Preview the report: You must save the report before you can preview it. Click Save. Then, click Horizontal and select Pagination Preview to view it in your browser.
Related documents
Differences between FineReport and FineBI: Differences between FineReport and FineBI.
FineReport and FineBI have some similar operations. For frequently asked questions about FineBI, see FineBI usage FAQ.
FineReport FAQ for new users: Designer FAQ.
For more information about report design in FineReport, see Report application learning path.