This topic describes how to integrate a Kitex application with Managed Service for OpenTelemetry.
ARMS Application Monitoring uses a proprietary probe for the Go language to provide non-intrusive instrumentation, a wide range of features, and high stability. For more information, see Monitor Go applications.
Prerequisites
You have activated Managed Service for OpenTelemetry.
Background information
CloudWeGo-Kitex is a high-performance and highly scalable open source remote procedure call (RPC) framework for Go microservices developed by ByteDance. By default, Kitex supports the Thrift, Kitex Protobuf, and gRPC protocols. It also provides a wide range of service administration and extension features.
Step 1: Integrate Kitex
In your Kitex application, add the following code.
import (
    "github.com/kitex-contrib/obs-opentelemetry/provider"
    "github.com/kitex-contrib/obs-opentelemetry/tracing"
    // ...
)

func main() {
    // Omit some initialization code.
    // **Integrate OpenTelemetry. The configuration is read from environment variables by default.**
    p := provider.NewOpenTelemetryProvider(
        provider.WithServiceName(constants.NoteServiceName),
        provider.WithEnableMetrics(false),
    )
    defer p.Shutdown(context.Background())

    Init()
    svr := note.NewServer(new(NoteServiceImpl),
        server.WithServerBasicInfo(&rpcinfo.EndpointBasicInfo{ServiceName: constants.NoteServiceName}), // server name
        // ...
        // **Inject tracing into the server instance.**
        server.WithSuite(tracing.NewServerSuite()),
    )
    err = svr.Run()
    if err != nil {
        klog.Fatal(err)
    }
}
Step 2: Obtain the endpoint information
-
Log on to the ARMS console. In the left-side navigation pane, click Integration Center.
-
On the Integration Center page, click the OpenTelemetry card in the Server-side Applications section.
-
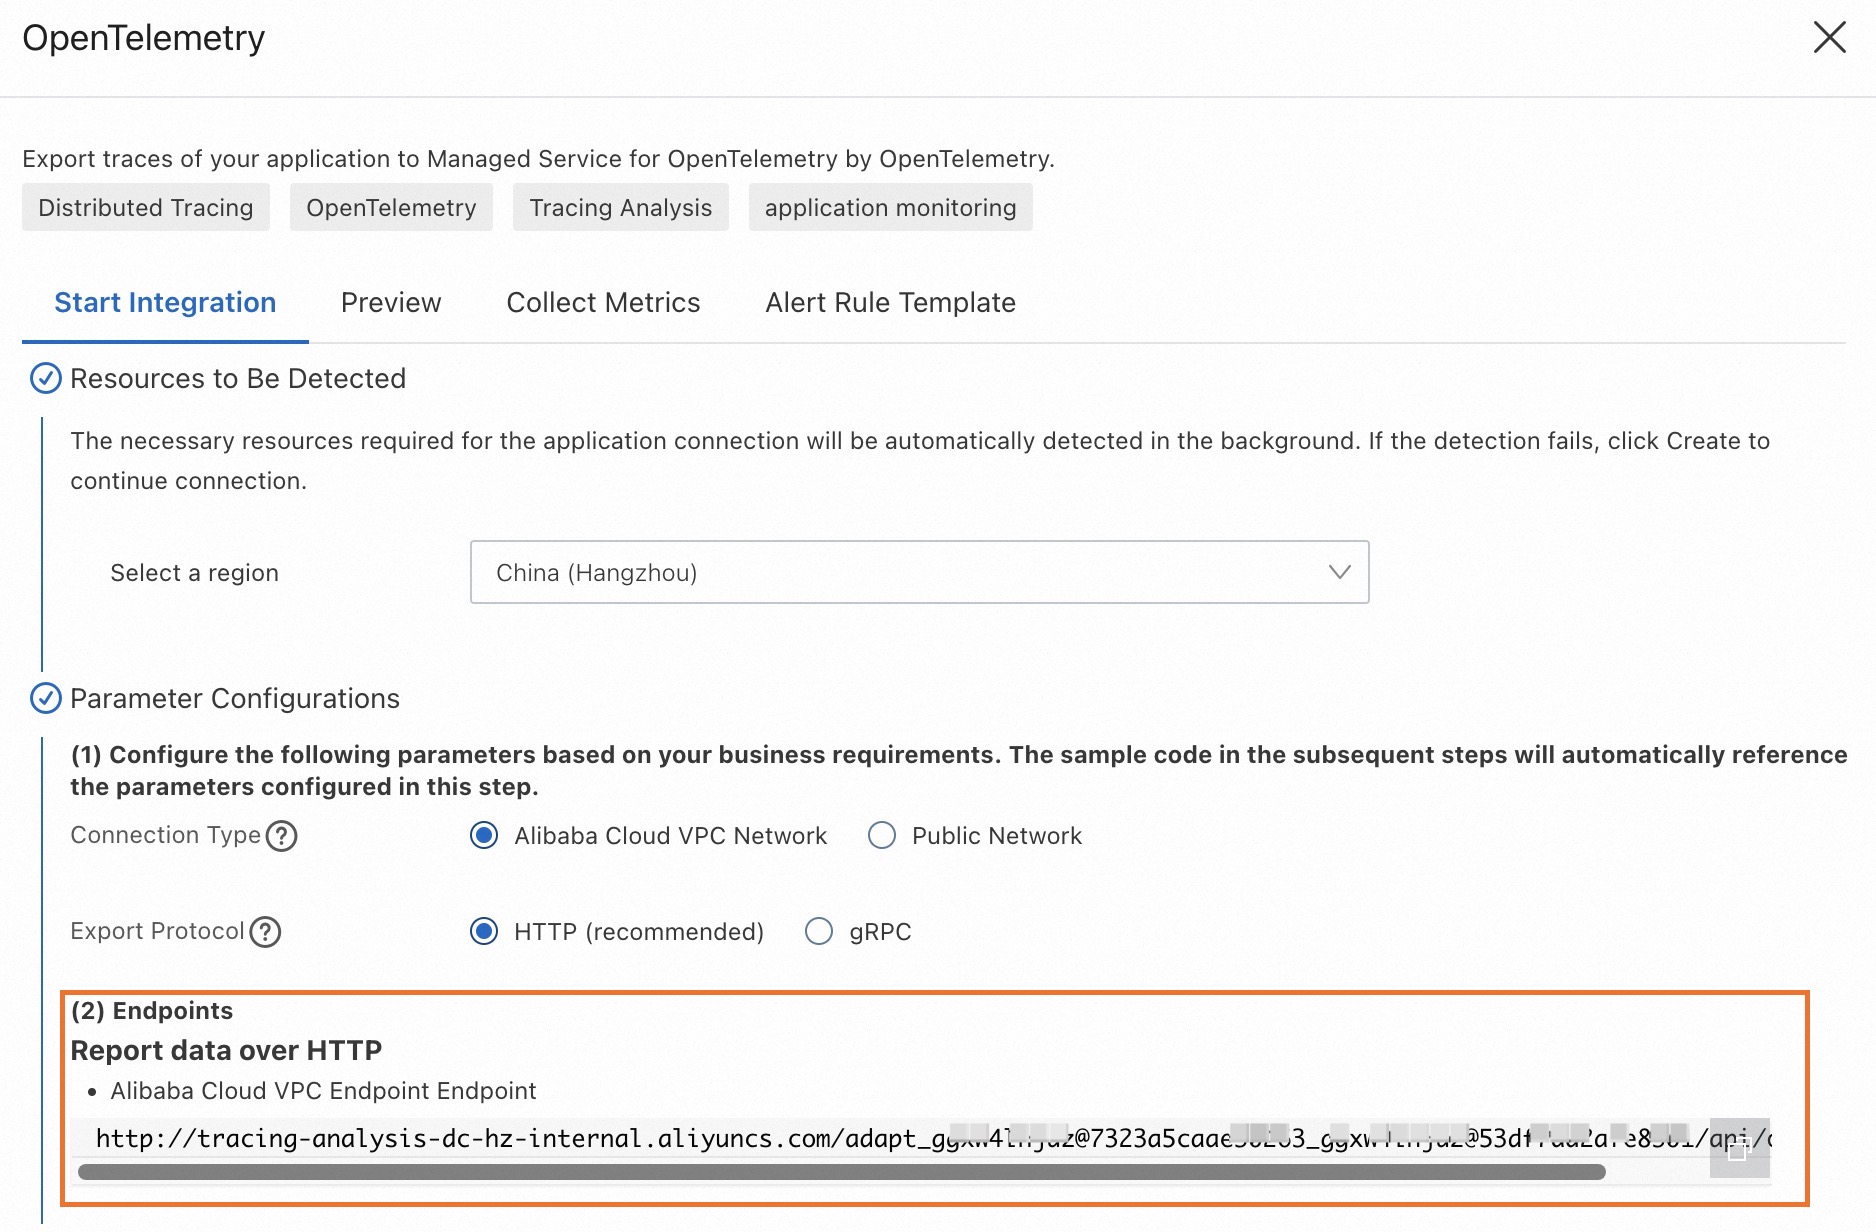
In the OpenTelemetry panel, click the Start Integration tab, and then select a region in which you want to report data.
NoteWhen you access a region for the first time, resources are automatically initialized there.
-
Configure the Connection Type and Export Protocol parameters and copy an endpoint.
-
Connection Type: If your service is deployed on Alibaba Cloud and resides in the region that you selected, we recommend that you set this parameter to Alibaba Cloud VPC Network. Otherwise, set this parameter to Public Network.
-
Export Protocol: Set this parameter to HTTP (recommended) or gRPC based on the protocol that is supported by the client.
-
Step 3: Deploy the application
If you use Container Service for Kubernetes (ACK), go to the ACK console and create a deployment on the page of the destination cluster. For more information, see Create a stateless application using a Deployment.
Configure the following environment variables using the endpoint information that you obtained in Step 2 to report data to Managed Service for OpenTelemetry.
Key
Description
Example
OTEL_EXPORTER_OTLP_TRACES_ENDPOINT
The endpoint for reporting traces.
http://tracing-analysis-dc-zb.aliyuncs.com:8090
OTEL_EXPORTER_OTLP_TRACES_HEADERS
The header that is included in OpenTelemetry reports for authentication.
authentication=cx0xxxxx@285xxxxx_cx0xxxxx@53xxxxx
Validation
Start the application and generate some traffic.
Log on to the ARMS console. In the left-side navigation pane, choose . On the Applications page, click the name of the application. On the page that appears, view the trace data.
If the  icon is displayed in the Language column, the application is connected to Application Monitoring. If a hyphen (-) is displayed, the application is connected to Managed Service for OpenTelemetry.