Dependencies
After you report application data to Managed Service for OpenTelemetry, Managed Service for OpenTelemetry starts monitoring the application. The Dependencies page shows your application's dependencies, including external calls, database calls, and message queues.
Prerequisites
Before you begin, make sure that you have:
An application that reports data to Managed Service for OpenTelemetry. For details, see Integration guide
Application dependencies
-
Log on to the ARMS console. In the left-side navigation pane, choose .
-
On the Applications page, select a region in the top navigation bar and click the name of the application.
NoteIf the
 icon is displayed in the Language column, the application is connected to Application Monitoring. If a hyphen (-) is displayed, the application is connected to Managed Service for OpenTelemetry.
 -
In the top navigation bar, click Dependencies.
-
In the quick filter area, you can filter the charts and service list by request type, operation, and application instance name.
-
In the trend chart area, you can view time-series curves for the total number of requests, number of errors, and average response time for calls to dependent services within a specified time range.
Click the
 icon to view statistics for the metric over a specific period or to compare statistics for the same period on different dates. Click the
  icon to switch between a bar chart and a trend chart.
 -
In the service list area, you can view information such as the request's operation, type, and RED metrics (Requests, Errors, and Duration).
In the service list, you can perform the following operations:
-
Click an operation to view its service details. For more information, see Dependency details.
-
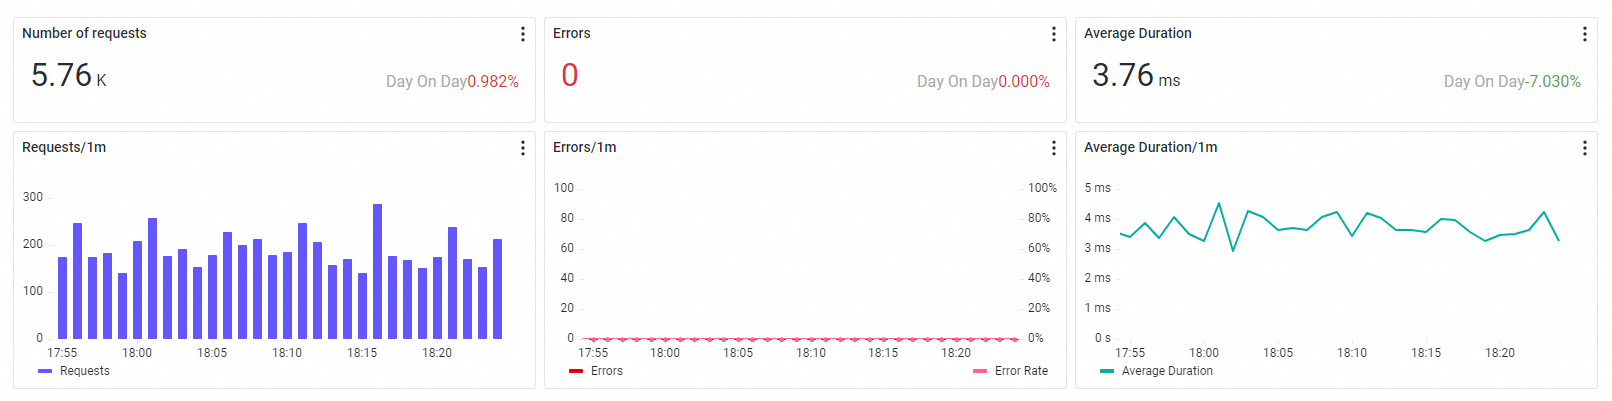
In the Actions column, click Overview to open a side panel with a service overview, including the number of requests, number of errors, and average response time.
-
In the Actions column, click Traces to view the traces for calls to the dependent service. For more information, see Trace Explorer.
-
-
Request types
Client request types:
-
http_client: A client for HTTP requests. -
dubbo_client: A client for Dubbo RPC requests. -
dsf_client: A client for DSF RPC requests. -
hsf_client: A client for HSF RPC requests. -
grpc_client: A client for gRPC requests. -
thrift_client: A client for Thrift RPC requests. -
sofa_client: A client for SOFARPC requests. -
client: A generic client request type.
Message middleware request types:
-
kafka_client: A producer for Kafka message queues. -
producer: A generic message producer type.
Database request types:
-
MySQL
-
Oracle
-
PostgreSQL
-
PPAS
-
SQL Server
-
MariaDB
-
DMDB
-
Redis
-
Memcached
-
MongoDB
-
DB
Dependency details
External and message calls
Overview
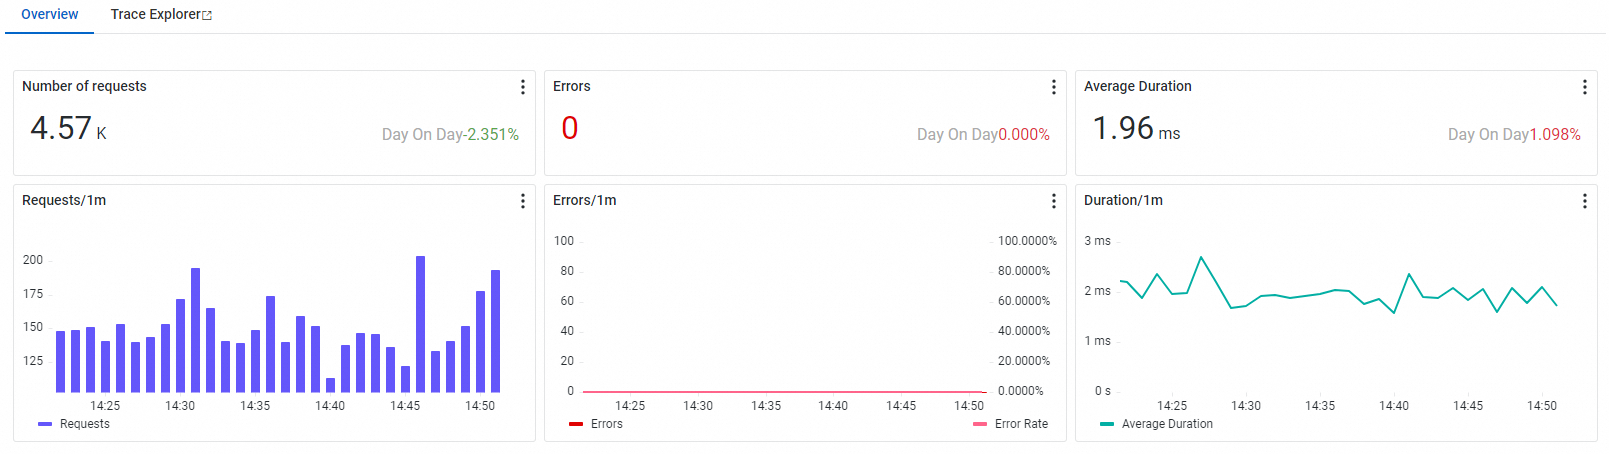
On the Overview tab, you can view the number of requests, number of errors, and average response time for the target address, service, or message, along with their corresponding time-series curves.
Trace Explorer
Trace Explorer enables real-time analysis of full trace data by combining various filter conditions and aggregation dimensions to meet custom diagnostic needs in different scenarios. For more information, see Trace Explorer.
At the top of the Trace Explorer page, the query bar supports combined filter conditions, such as serviceName="service-product-skywalking" AND attributes.ali.trace.rpc="HikariCP/Connection/close". The quick filter panel on the left lets you filter by status, duration, API name, and host address. The central area displays time-series charts for Call Count, HTTP Errors, and Latency Percentiles (p50/p90/p95/p99 and average). Below these charts, several tabs are available: List, Scatter Plot, End-to-end Aggregation, End-to-end Topology, and Error/Slow Trace Analysis. The list view presents a table with details for each trace, such as TraceId, API name, application name, duration, status, and start time.
Database calls
Overview
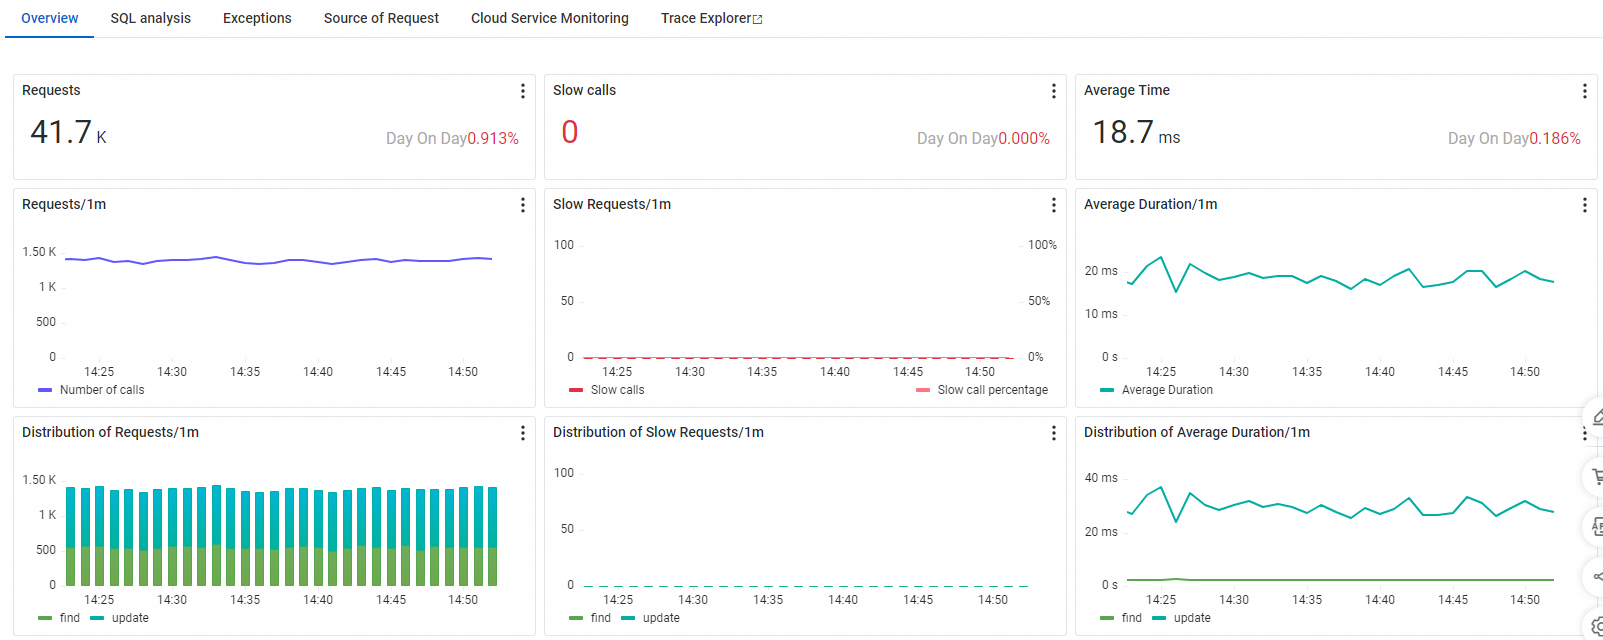
On the Overview tab, you can view statistical metrics, time-series metrics, and distributions for the number of requests, number of slow calls, and average response time of the application's calls to the target database instance.
SQL analysis
On the SQL analysis tab, you can view request trends (number of requests, number of slow SQL queries, and average response time) and SQL-level statistics for the selected database instance.
Click Traces to the right of an SQL statement to view the complete code trace for the corresponding SQL execution. For more information, see Trace Explorer.
The left panel contains the Dependency List and Application Instance List, which you can use to filter SQL analysis data by database instance or application instance.
Exception analysis
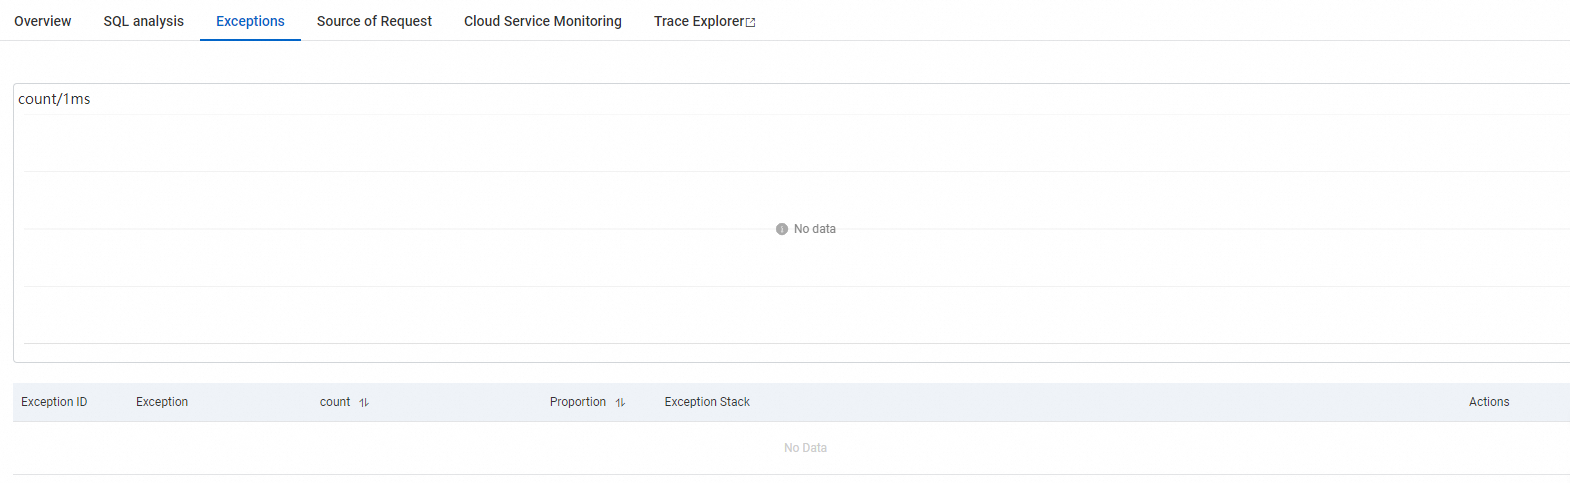
On the Exception Analysis tab, you can view the number of times an exception was thrown when the application called the target database within a specified time range, as well as the exception details. For more information, see Exception analysis.
Request source
On the Request source tab, you can view time-series curves for the response time, request count, and error count from the source APIs that call the target database.
Trace Explorer
Trace Explorer enables real-time analysis of full trace data by combining various filter conditions and aggregation dimensions to meet custom diagnostic needs in different scenarios. For more information, see Trace Explorer.
What to do next
Set up alert rules so that the system automatically notifies your O&M team when metrics cross a threshold. For example, create a rule that triggers when the error rate for a specific operation exceeds a baseline. See Create an alert rule.