This topic explains how to deploy a code component instance and view its deployment records and logs.
Prerequisites
-
You have created an environment in your project. For more information, see Create and manage project environments.
-
You have added a code component. For more information, see Add and manage code components.
-
You have configured an image repository in your project to store images built from code components. For more information, see Configure project image repositories.
Deploy a code component instance
Log in to BizWorks, in the select Platform drop-down list selected microservice Development Platform.

Click the
 icon or the text box in the upper-right corner of the page. From the drop-down list, click the name of the project that you want to view and click the Applications tab. On the Applications page, click the name of the target managed application.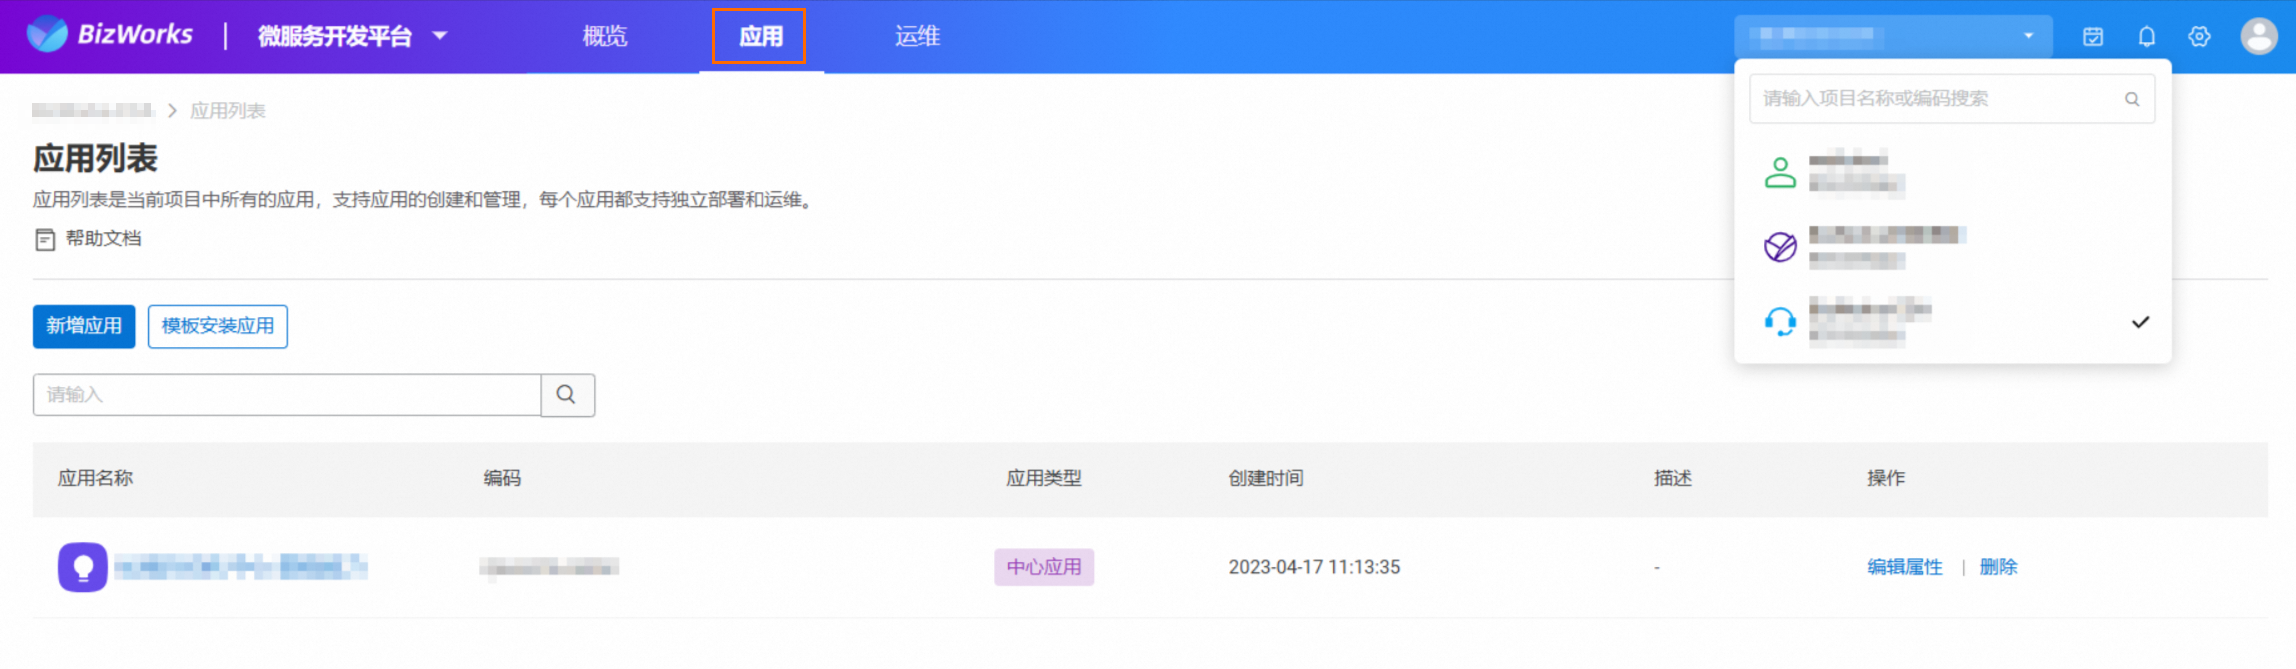
In the navigation pane, choose .
-
On the Application Deployment page, select the environment that you want to deploy to, and click the
 icon in the upper-right corner of the environment card.Note
The Application Deployment page displays the instances, their associated workloads, and workload types within an environment.
Users with enterprise, project owner, or application owner roles can view and manage deployments in the development environment, testing environment, staging environment, and production environment. Other roles are restricted to viewing and managing deployments in the development environment and testing environment only.
For more information about the BizWorks account and permission system, see Platform accounts and permissions.
-
On the Create Deployment Instance - Select Deployment Component panel, select the target code type component, and click Next.
NoteYou cannot create a new deployment for a component that is already deployed in the current environment.
-
In the Create Instance Deployment - Deployment Configuration panel, complete the parameter configuration and click Next.
Parameter
Description
Component source
You can select either Branch or Tag. Select the desired branch or tag from the corresponding drop-down list.
If you select Branch, you can optionally specify a commit ID.
NoteIf you leave the commit ID empty, the latest commit from that branch is used by default. After the instance is successfully deployed, the platform records the commit ID used for the code checkout. When you update the instance deployment, the commit ID field is empty by default. You must specify a commit ID again if you want to deploy a specific version.
Pipeline
From the Select pipeline drop-down list, select a pipeline.
-
Default pipeline: The built-in pipeline provided by BizWorks, which includes basic steps such as pulling code, compiling code, building an image, and deploying the application.
-
Custom pipeline: A custom pipeline appears in the drop-down list only if it meets all of the following conditions:
-
The pipeline is associated with the component you are deploying.
-
The pipeline includes a Deploy to Target Environment task step, and the Target deployment environment type matches the environment where you are deploying the component. For more information about adding a Task Step to a pipeline, see Add a custom pipeline.
NoteIf a qualifying custom pipeline exists, the default pipeline is not available for selection. If no qualifying custom pipelines are found, you can still use the default pipeline.
-
-
Third-party pipeline:
-
You can integrate third-party pipeline products to gain more DevOps capabilities. If you have added a third-party pipeline for your application, you can select it to deploy the instance. For more information about how to integrate a third-party pipeline, see Third-party pipeline integration overview.
-
If you have enabled the Project pipeline configuration switch, the Default pipeline option is not available in the Deployment pipeline drop-down list. For more information about how to enable the Project pipeline configuration switch, see Create and manage third-party pipeline connections.
-
Deployment configuration
-
Deployment policy:
-
Default policy: Releases updates in a rolling manner. A new replica is started, and an old one is stopped after the new one becomes ready. This process repeats until the rollout is complete.
-
Custom policy: You can select By number of pods or By Percentage.
-
-
Advanced: Click Add to configure the following items.
Toleration: Configure Kubernetes tolerations to allow pods to be scheduled on nodes with matching taints.
This section also includes the Operator, Effect, and Time columns.
The configuration rules for key and value are as follows:
-
Key:
-
Cannot exceed 253 characters.
-
Can contain letters, digits, hyphens (-), and periods (.).
-
Must begin and end with an alphanumeric character (a-z, 0-9, A-Z).
-
-
Value:
-
Cannot exceed 63 characters.
-
Can contain letters, digits, hyphens (-), and periods (.).
-
If the value is not empty, it must begin and end with an alphanumeric character (a-z, 0-9, A-Z).
-
-
Network access
Configure rules for accessing the deployed instance.
BizWorks simplifies the Kubernetes Ingress and Service networking models to meet common network access requirements, allowing development teams to deploy and debug quickly. For more advanced networking needs, you can configure them directly on the managed cluster after deployment. Network access supports two simplified scenarios:
-
Invoked only within the cluster: Instances are accessed within the cluster by using the Service name.
-
Invoked from within and outside the cluster: Instances can be accessed from outside the cluster by using the HTTP protocol or other TCP/UDP protocols. Instances are still accessed within the cluster by using the Service name.
Resource configuration
Configure the Total number of instances and Resource quota per instance. CPU resource limits and requests are measured in CPU units. For example, a value of 0.1 is equivalent to 100 mCPU. Memory limits and requests are measured in bytes, typically expressed in mebibytes (MiB). For example, 1024 MiB is equivalent to 1 GiB. The resource limit must be greater than the resource request.
Configure network access
-
In the Network access section of the Create Instance Deployment - Deployment Configurations panel, click + Add Network Access Configuration.
-
Set the protocol (TCP or UDP) and port that the container exposes.
-
Select an Allowed invocation scope.
-
If you select Invoked only within the cluster, the instance is accessed by using the automatically generated Service name and port.
-
If you select Accessible from inside and outside the cluster and set External access method to HTTP (to provide cluster access over HTTP), the Domain + Path routing method is supported. The platform provides two quick configuration methods: Quick Configuration (Independent Domain) and Quick Configuration (Path Matching). You can click the Access domain text box and select the target access domain from the drop-down list.
The configuration rules for Path are as follows:
-
Can contain uppercase and lowercase letters, digits, and the following characters:
_@#%*./-. -
Must begin with a forward slash (/) but not end with one. The Path cannot contain consecutive forward slashes (//).
-
Cannot exceed 50 characters in length.
Note-
If you use path-based routing, where the path is not a single forward slash (/), the platform adds an Ingress rewrite rule by default, setting the Enable rewrite parameter to Yes.
-
If you do not need to use a path for routing (for example, when the path is a forward slash (/)), the platform does not add an Ingress rewrite rule by default. The Enable Rewrite parameter is set to No, and the Enable Rewrite parameter is not displayed.
-
The platform currently supports only the Nginx Ingress rewrite rule provided by Kubernetes. App Root is not supported. For more information, see Rewrite - NGINX Ingress Controller.
-
Configuring the Invocation domain as the environment domain while setting the Path to a single forward slash (/) is not supported.
-
-
If you select Invoked from within and outside the cluster and set the External invocation method to TCP/UDP, the platform uses the NodePort service type in Kubernetes to expose the instance to external traffic.
-
-
-
On the Create Instance Deployment - Environment Configuration panel, after you complete the environment configuration, click Start Deployment.
-
Optional: Configure Lifecycle management.
-
Optional: Configure Environment variables.
-
Optional: Configure Storage.
-
Optional: Configure Health check.
-
Optional: Configure Labels.
Parameter
Description
Lifecycle management
ImportantIf you are unfamiliar with the
CMDorENTRYPOINTof the original Docker image, we recommend that you do not customize the Start command and Start parameters.Because the Docker runtime supports only one
ENTRYPOINTcommand, the Start command set on the Create Instance Deployment - Environment configurations or Update Instance Deployment - Environment configurations page overrides theENTRYPOINTandCMDcommands set in the Docker image.-
Start command: Enter the start command in the Start command text box. For example,
nginx. -
Start parameters: Each start parameter must be in a separate text box. For example, enter the parameter
-g, click Add below the Start parameters text box, and then enter the parameterdaemon off;in the new text box.
Environment variables
Environment variables can be configured in bulk.
You can add custom variables. For example, set the key to
TZand the value toAsia/Shanghaito specify the time zone.Storage
Configure the external storage required by the container's runtime environment.
-
Storage type: Only the PVC type is supported. When you use PVC-based storage, ensure that the PVC is not exclusively used by another workload.
-
Mount source: The platform does not manage PVC resources. If no PVC is available in the application deployment cluster, go to the corresponding cluster to create a PVC. For more information, see Create a PersistentVolumeClaim.
-
Path in container: A custom file path inside the container.
Note-
The system does not support configuring external storage for the container runtime environment in the following EDAS-type container clusters: Alibaba Cloud Enterprise Distributed Application Service (EDAS)
 and Alibaba Cloud Enterprise Distributed Application Service (EDAS)
 . For more information about clusters, see Connect to a cluster.
 -
When you deploy a PVC in a specified environment, you must first manually create the PVC in the corresponding Kubernetes
namespace. If a specific mode is set for theaccessModesof the PVC, the system enforces restrictions according to Kubernetes specifications. For more information, see persistent-volumes.
Health check
-
On the Liveness probe and Readiness probe tabs, configure the following parameters:
-
initialDelaySeconds: The delay in seconds before the probe starts for the container. If the value is 0, the probe starts immediately after the container starts.
For a liveness probe, the default value is 60. For a readiness probe, the default value is 10. The unit is seconds (s).
-
PeriodSeconds: The period for probing the container. For example, if you set this parameter to 10, the container is probed every 10 seconds. The default value is 10 seconds.
-
SuccessThreshold: The number of consecutive successes required for a probe to be considered successful. The default value is 1, which indicates that a single successful probe is sufficient.
-
TimeoutSeconds: Specifies the maximum timeout period for a container to respond to a probe. If the value is set to 1, the container must respond within 1 second. Otherwise, the probe is considered a failure. The default value is 1, and the unit is seconds (s).
-
FailureThreshold: The number of consecutive probe failures required before the probe is considered to have failed. The default value is 3, which means that the container is restarted after 3 consecutive failures.
-
-
Probe settings:
-
Path: The path for the health check probe. For example: /actuator/health/liveness.
-
Port: The port number where the application is deployed. For example, if the application instance type is Central Middle Platform Application, the port number can be set to 8080. If the application instance type is Managed Application, the port number can be set to 8083.
-
Scheme: Supports the HTTP protocol.
-
HTTPHeaders: The HTTP request headers, including Name and Variable Value.
-
Labels
Add Kubernetes labels to the Deployment and pods. The platform can only manage labels that are added through BizWorks.
A Creation successful message appears, and a card for the new component instance is added to the environment.
-
 . For more information about clusters, see
 View deployment records and logs
You can only view logs for deployments of the Update and Create types.
-
On the Application Deployment page, click the card for the target instance component to view the deployment records in the Deployment Record area of the component panel. The deployment records are displayed in a table that includes columns such as ID, Type, Status, Operator, and Completion Time.
-
Click Log to the right of the target deployment record ID to view the detailed pipeline logs for the deployment process.
The logs are displayed as follows:
If you selected the default pipeline for Deployment Pipeline, the deployment logs are displayed in the Instance Change Records dialog box, showing the execution progress of each pipeline stage and detailed build and deployment logs.
If you selected a third-party pipeline for Deployment Pipeline, the deployment logs appear in the Deployment Logs dialog box. This dialog box shows pipeline information, the instance ID, and the running status, followed by detailed build and deployment logs.
You can click View more run records to view more records on the pipeline instance page.
If a custom pipeline was selected for Deployment Pipeline, the deployment logs appear as follows.
This example uses a pipeline with an added Pipeline Control task to illustrate the deployment logs for a custom pipeline.
In the Instance Change Record dialog box, the pipeline displays five stages in sequence: Code Checkout, Maven, Create Image, Pipeline Control, and Deploy. A green checkmark next to each stage indicates it is complete. When the Deploy to Target Environment node is selected in the left-side pane, the right-side log area shows the Docker image push logs and application deployment status, ultimately displaying "Check deployment status [Deployment Successful]".
The deployment log details for a process in an approval workflow are as follows. In the Instance Change Record panel, the pipeline progress shows the execution status of each stage: Code Checkout, Maven, Create Image, Pipeline Control, and Deploy. The current Pipeline Control stage is shown as Pending for Approval.
Click View Progress to see the specific approval progress. The approval process details page displays the process instance ID, creation time, creator, and running status, which is currently In Progress. The business information section shows the associated central application, and you can click the View link for more details. The approval progress is presented as a timeline: the Start Node has been completed by the initiator, and the process is currently at the Manual Approval node, which requires all designated approvers to pass (countersign). It shows that two people are pending approval. The Approve and Reject buttons are available at the bottom of the page for approvers.
Alternatively, in the Deployment Records section of the instance details panel, click Details next to the target deployment record. In the Deployment Record Details panel, click Approval Progress to go to the approval progress details page. You can also find the target deployment record in the list and click Details to view its detailed information. The deployment record details include fields such as Operation Type, Status, Deployer, Completion Time, Deployment Environment, Deployment Content, Deployment Pipeline, and Deployment Policy. The Approval Progress button next to the status bar is the entry point for viewing the progress.
To terminate the deployment process of a custom pipeline, click Terminate Process in the Instance Change Record dialog box. In the confirmation dialog box, click OK. The deployment log details page shows the pipeline stage bar (including Code Checkout, Maven, Create Image, Pipeline Control, and Deploy), with status icons indicating whether each stage is completed, in progress, or not started. You can select a specific build step on the left to view its corresponding log output on the right. The Terminate Process button in the upper-right corner allows you to stop the current pipeline execution at any time.
-
Optional: View the deployment configuration for a specific record.
-
Click Details to the right of the target deployment record ID.
-
In the Deployment Record Details panel, you can view information such as Deployment Content, Resource Specifications, and Deployment Policy.
-
If you need to roll back to this version, click Roll back to this version. In the Roll Back Application Deployment dialog box, set the rollback policy and Release Volume, and then click Roll Back.
-