This article describes how to resolve website inaccessibility caused by abnormal traffic, such as excessive traffic.
Symptoms
A website hosted on a web hosting service becomes inaccessible after running for a period of time.
Cause
Abnormal traffic, such as excessive traffic, can make the website inaccessible.
Procedure
To resolve this issue, you need to analyze your website's access data to understand traffic trends and identify the specific cause of the failure. This guide demonstrates how to use the WebLog Expert tool to analyze website logs, using a website hosted on a Windows operating system as an example.
-
Merge all downloaded logs into a single
.logfile.This example uses a local computer running the Windows operating system.
NoteIf your local computer runs Linux or macOS, refer to the relevant documentation for instructions on how to merge log files.
-
Open Windows PowerShell.
-
Run the
typecommand to merge all log files into alogs.logfile.
type log?.log > logs.logAfter the command runs successfully, you can find the
logs.logfile in the log directory. Open the file to confirm that it contains the content from all log files. -
-
Download and install the WebLog Expert tool.
This example uses WebLog Expert version 9.53. The user interface may differ in other versions.
-
Analyze the website logs.
NoteThe following example covers only a few common parameters and configurations. You can adjust them as needed.
-
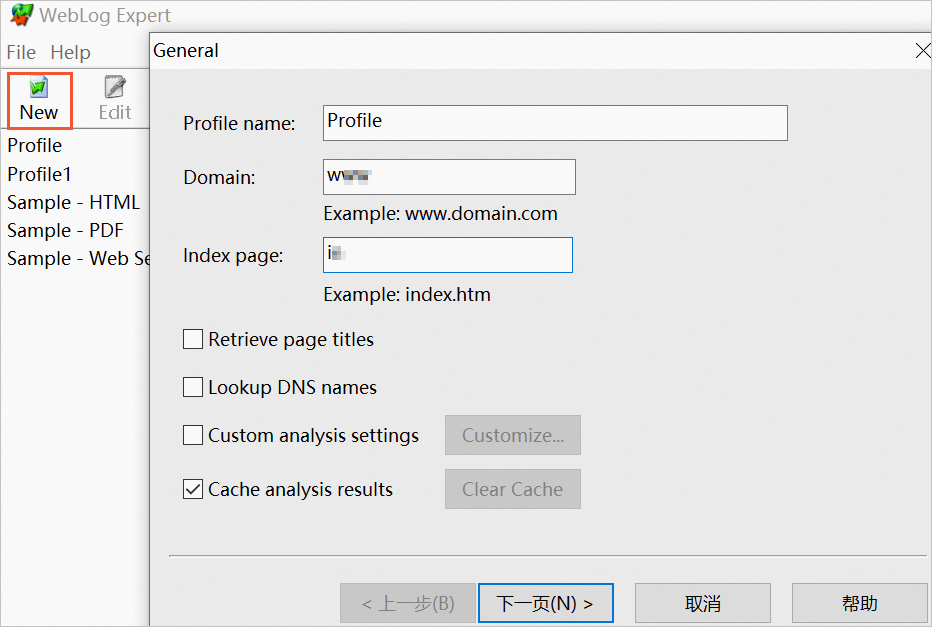
Start the WebLog Expert tool and click New. On the General page, configure the parameters, and then click Next.
-
On the Log Files page, click Browse... next to the Path setting, select the merged
logs.logfile, and then click Next.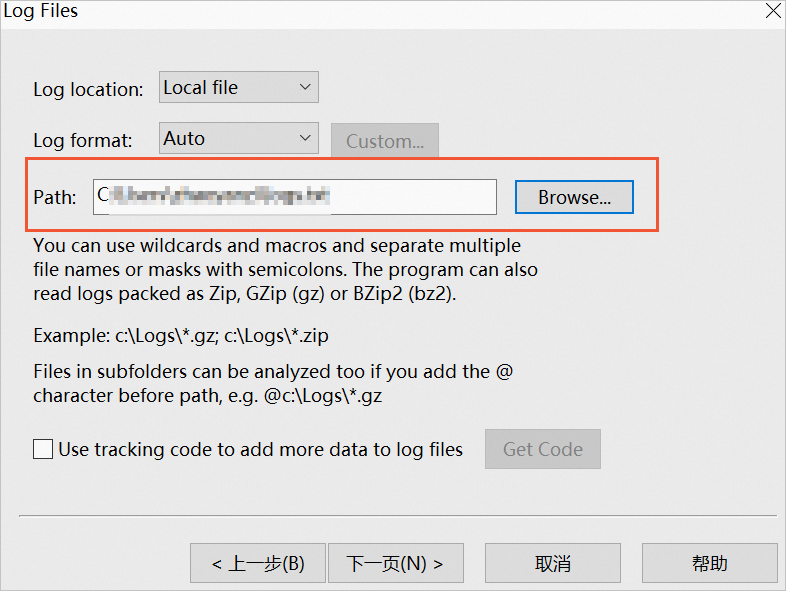
-
On the Time Range page, keep the default settings and click Next.
-
On the Tracking page, configure settings as needed and click Next. This page is empty by default.
-
On the Filters page, configure settings as needed and click Next. This page is empty by default.
-
On the Report page, set a path to save the report, and then click Finish.
-
Right-click the analysis task you created (for example, Profile), and then click Analyze.
After the analysis is complete, the software generates a report file in the Report folder by default. An example path is
file:///C:/ProgramData/WebLog%20Expert/Report/index.htm.
-
-
View the analysis results.
Open the analysis report in a browser. Click a parameter to view its results.
The following table describes the common parameters.
Parameter
Description
General statistics
Provides a summary of your website's traffic.
Activity statistics
Shows traffic activity over a specific period, such as by day or hour.
Access statistics
Provides a detailed analysis of the
access log, including requests for pages, images, and directories.Visitors
Provides statistics about visitor IP addresses.
Referrers
Shows statistics on visitor referral sources.
Browsers
Provides statistics on visitor browsers.
Errors
Provides statistics on site errors.