Scenario-based analysis
After you install the probe for an application, Cloud Monitor 2.0 starts monitoring it. The Scenario-based analysis page provides a unified view of slow and faulty traces, exceptions, and information about databases and NoSQL databases across all your applications.
Try the feature
Alibaba Cloud Playground provides a demo environment where you can experience the main features of Cloud Monitor 2.0.
Go to the Playground Demo. The workspace page is displayed by default.
In the navigation pane on the left, choose .
Slow and fault analysis
The Slow and fault analysis page displays error rate and average response time trends for all services, along with the top N slow and faulty interfaces for both provided and dependent services.
-
Click an interface name to view the trace information for that interface.
-
Click the
 icon on a panel to further analyze the current metric. Click the
 icon on a trend graph panel to set a time range for comparison.
Exception analysis
The Exception analysis page lets you filter and analyze exceptions by exception name, interface name, application name, and instance to identify and fix problematic code.
-
In the quick filter section, you can filter exceptions by Exception Name, Interface Name, Application Name, and Instance.
-
In the trend graph section, you can view the number of exceptions within a specified time range. The data is displayed in a stacked graph by exception name.
Click the
icon on a trend graph panel to further analyze the current metric. Click the icon on the panel to set a time range for comparison. -
In the exception list section, you can view information such as exception IDs, exception names, the applications that threw the exceptions, the number of occurrences, percentages, and exception stacks.
In the exception list, you can perform the following operations:
-
Click an application name to view the monitoring details for the target application.
-
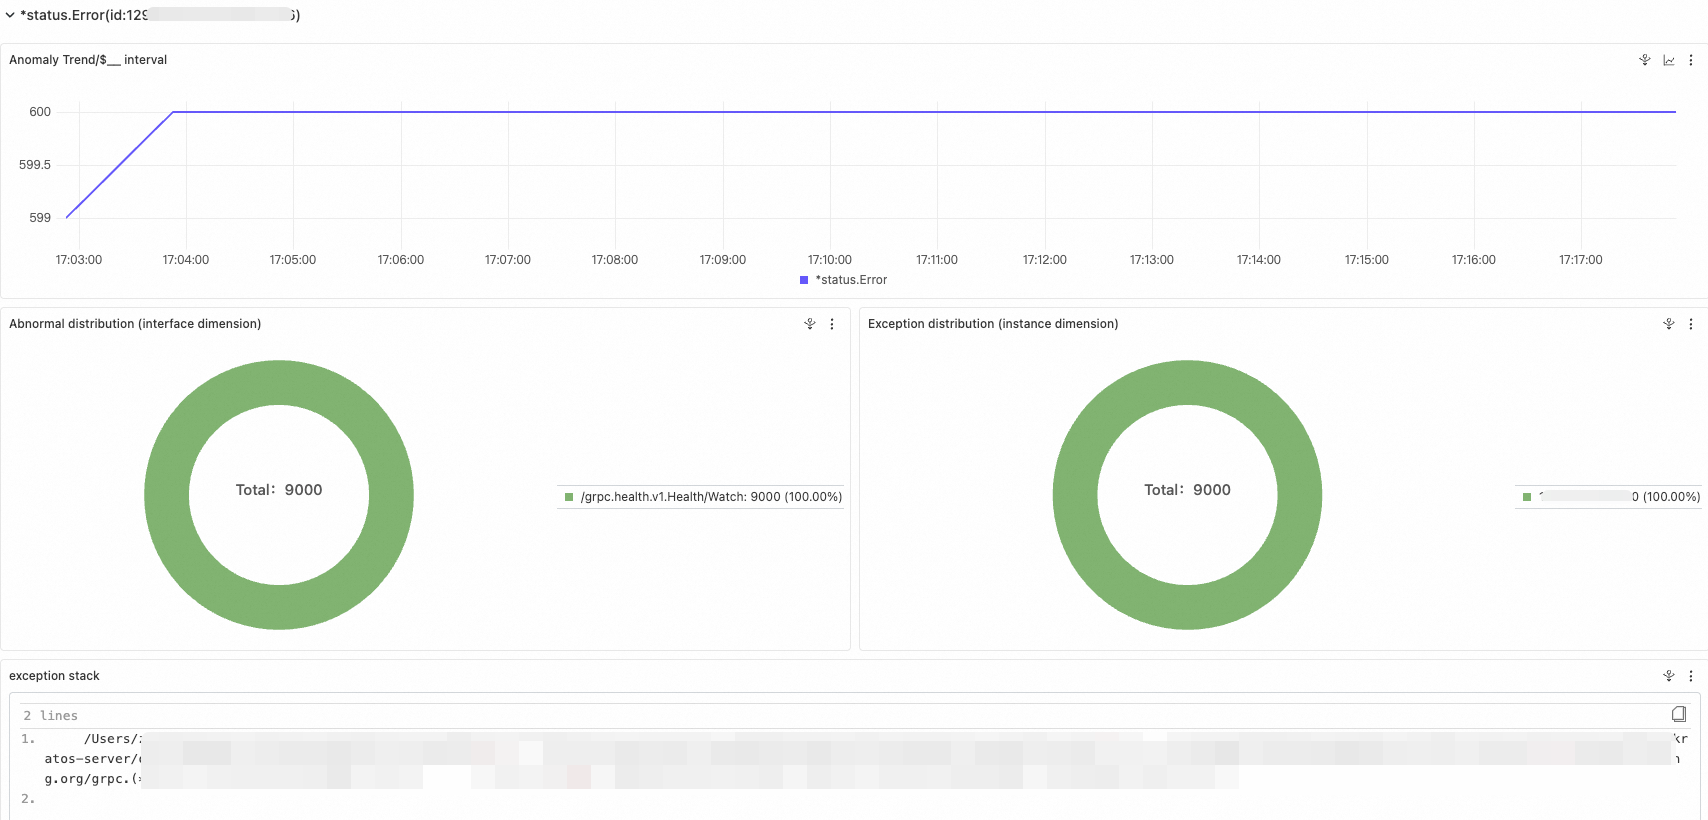
Click Overview in the Actions column. A panel appears on the right that shows an overview of the exception, including its count trend, distribution, and stack.
-
Click Trace in the Actions column to view the details of the corresponding trace. For more information, see Trace analysis.
-
Database analysis and NoSQL analysis
The Database analysis and NoSQL analysis tabs list all SQL and NoSQL requests across your applications, helping you identify statements that cause slow services.
-
In the quick filter section, you can filter databases by Database Name, Database Type, Application, and Instance.
-
In the trend graph section, you can view trend graphs for the number of requests, the number of slow requests, and the average response time of the database.
Click the
 icon on a trend graph panel to further analyze the current metric. Click the icon on the panel to set a time range for comparison.
-
In the database list section, you can view information such as database names, corresponding applications, SQL/NoSQL statements, request counts, average response times, and slow requests.
In the database list, you can perform the following operations:
-
Click a database name to view the call details for the target database.
-
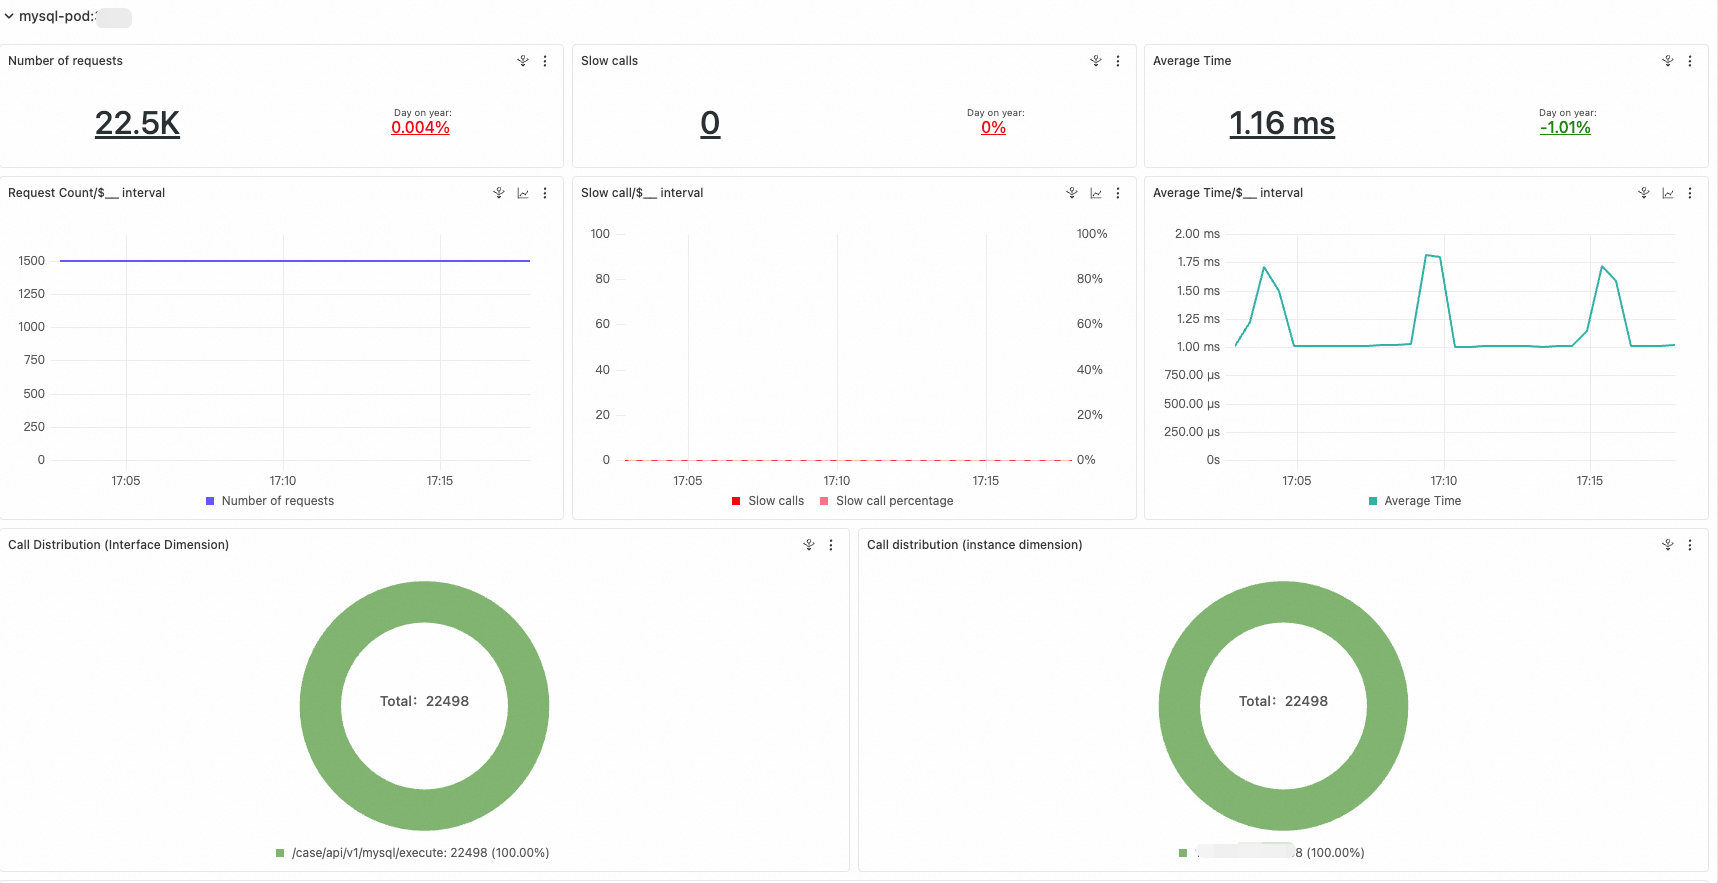
Click Overview in the Actions column to view basic information about the database. This includes the number of requests, number of slow calls, average response time, and call distribution.
-
Click Trace in the Actions column to view the complete code trace that contains the SQL or NoSQL execution logic. For more information, see Trace analysis.
-