Inspection and scoring
Database Autonomy Service (DAS) automatically inspects all connected database instances once per day and scores each one out of 100. When an incident occurs or you want to investigate a specific time window, you can also trigger a manual inspection over a custom time range.
Prerequisites
Before you begin, make sure you have:
A database instance using one of the supported engines:
ApsaraDB RDS for MySQL
Self-managed MySQL
PolarDB for MySQL
ApsaraDB MyBase for MySQL
Tair (Redis OSS-Compatible)
The instance connected to DAS and in the Normal Access state. For details, see Connect a database instance to DAS.
How it works
Each health score starts at 100. DAS evaluates metrics—CPU utilization, memory usage, slow SQL statements, and others—against predefined thresholds. When a metric crosses a threshold, DAS deducts points from the score. The lower the score, the more attention the instance needs.
Automatic inspections run once per day at a random time. Manual inspections let you target a specific time range for deeper analysis—useful after an incident or when you suspect a performance regression in a past window.
See Scoring rules for the full list of metrics and deduction formulas.
Enable automatic inspection
Log on to the DAS console.
In the left navigation pane, click Inspection and Scoring.
On the Instance Inspection and Scoring page, click Settings in the upper-right corner.
In the Configure Inspection and Scoring dialog box, select the engine type for your database instance, then click OK.
Run a manual inspection
On the Instance Inspection and Scoring page, click Start Inspection.
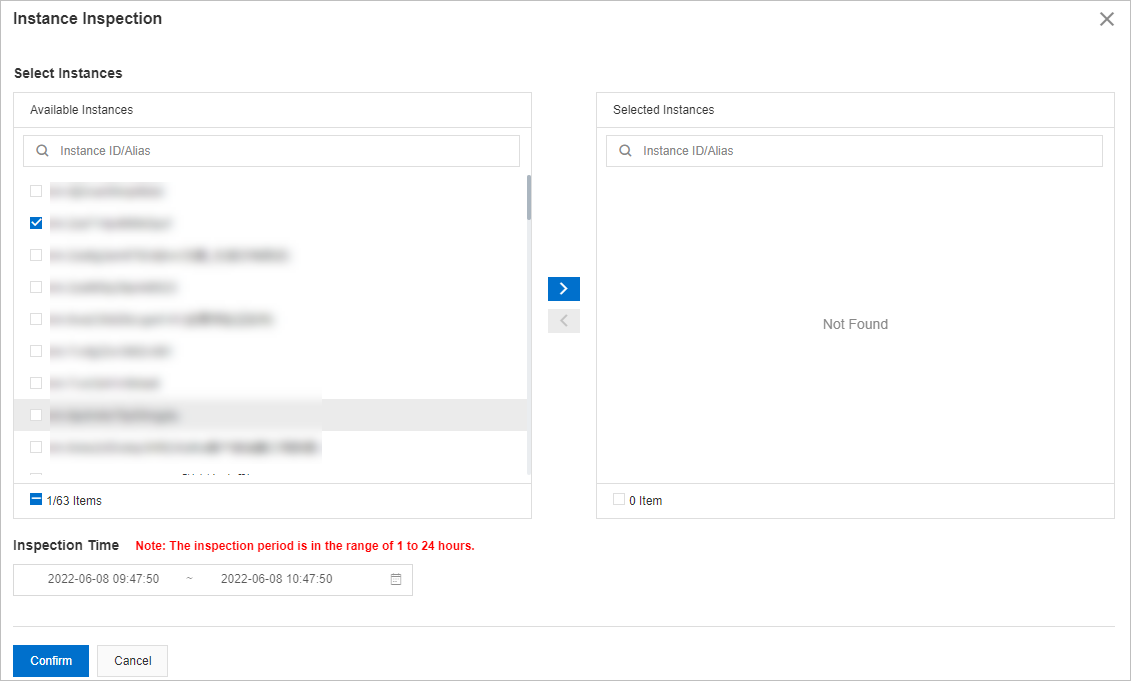
In the Instance Inspection dialog box, go to the Select Instances section. Select the instances you want to inspect, then click the
 icon to move them to the Selected Instances section.
In the Inspection Time section, set the start and end time for the inspection.
Note The start time cannot be later than the current time. The inspection window must be between 1 and 24 hours.Click Confirm.
View inspection results
After an inspection runs, go to the Instance Inspection and Scoring page to review results. The list shows each inspected instance with its health score, inspection time, and any deductions. Search by instance name or alias to filter to a specific instance or time range.
From the Actions column, you can:
Click Deduction Details to see which metrics triggered point deductions and by how much.
Click Report to open the Scoring Report panel with the full inspection report.
Click Delete to remove an inspection result.
Click the
 icon to download results to your computer.
Click an instance ID to view its performance history on the Performance Trends tab. For details, see Performance trends.
Scoring rules
Each instance starts with a score of 100. Points are deducted when metrics cross the thresholds below. Multiple conditions can apply simultaneously, so deductions are cumulative.
ApsaraDB RDS for MySQL, self-managed MySQL, and PolarDB for MySQL
| Metric | Description | Severity | Condition | Points deducted |
|---|---|---|---|---|
| CPU utilization (cpuUsage) | Average CPU utilization over the day. For multi-core instances, DAS averages utilization across all cores. | Major | 70% ≤ cpuUsage ≤ 80% | 1 + (cpuUsage − 0.7) × 20 |
| Critical | cpuUsage ≥ 80% | min[3 + (cpuUsage − 0.8) × 30, 10] | ||
| Memory usage (memUsage) | Average memory usage over the day. | Major | 80% ≤ memUsage ≤ 90% | 1 + (memUsage − 0.8) × 20 |
| Critical | memUsage > 90% | min[(memUsage − 0.9) × 50, 10] | ||
| Space usage | Storage usage = average used storage ÷ total storage × 100%. Not applicable to self-managed MySQL. | Available days | availableDays ≤ 30 | 15 − availableDays / 3 |
| Number of large tables. Not applicable to PolarDB for MySQL. | — | bigTableCount > 0 | min(bigTableCount, 15) | |
| Connection usage (connectionRate) | Connection usage = average connections ÷ maximum connections at a point in time × 100%. | Major | 70% ≤ connectionRate ≤ 80% | 1 |
| Critical | connectionRate > 80% | 3 | ||
| IOPS usage (iopsUsage) | IOPS usage = average IOPS ÷ maximum IOPS allowed × 100%. | Major | 70% < iopsUsage < 90% | 3 |
| Critical | iopsUsage > 90% | 5 | ||
| Active sessions (threadRunning) | Number of active sessions generated in the day. | Major | threadRunning > min(2 × cpuCores + 8, 64) | 3 |
| Critical | threadRunning > min(4 × cpuCores + 8, 96) | 9 | ||
| Slow SQL statements (slowSqlCount) | Number of slow SQL statements in the day. Click the count to view the five most frequently executed slow SQL statements. | Minor | 0 < slowSqlCount < 100 | 1 + (slowSqlCount − 10) / 30 |
| Major | 100 ≤ slowSqlCount < 500 | 4 + (slowSqlCount − 100) / 30 | ||
| Critical | slowSqlCount ≥ 500 | min[18 + (slowSqlCount − 50) / 30, 30] | ||
| SQL Security Audit | Number of high-risk SQL statements and SQL injection attacks detected. | High-risk SQL | riskSqlCount > 0 | min(riskSqlCount, 5) |
| SQL injection | sqlInjectionCount > 0 | min(sqlInjectionCount, 5) | ||
| Deadlock | Whether a deadlock occurred during the day. | Minor | Deadlock detected | 3 |
Tair (Redis OSS-Compatible)
| Metric | Description | Severity | Condition | Points deducted |
|---|---|---|---|---|
| CPU utilization (cpuUsage) | Average CPU utilization over the day. For multi-core instances, DAS averages utilization across all cores. | Major | 70% ≤ cpuUsage ≤ 80% | 1 + (cpuUsage − 0.7) × 20 |
| Critical | cpuUsage ≥ 80% | min[3 + (cpuUsage − 0.8) × 30, 10] | ||
| Memory usage (memUsage) | Average memory usage over the day. | Major | 80% ≤ memUsage ≤ 90% | 1 + (memUsage − 0.8) × 20 |
| Critical | memUsage > 90% | min[(memUsage − 0.9) × 50, 10] | ||
| Connection usage (connectionRate) | Connection usage = average connections ÷ maximum connections at a point in time × 100%. | Major | 70% ≤ connectionRate ≤ 80% | 1 |
| Critical | connectionRate > 80% | 3 | ||
| Traffic usage (FlowRate) | Traffic usage = average traffic ÷ maximum traffic allowed at a point in time × 100%. Applies to both inbound and outbound traffic. | Major | 80% ≤ FlowRate ≤ 85% | 1 |
| Critical | FlowRate > 85% | 3 | ||
| IOPS usage | — | Critical | iopsUsage > 90% | 5 |
| Hot keys (HotKey) | Whether hot key activity is detected. | Minor | Hot keys detected | 3 |
| Slow SQL statements (slowSqlCount) | Total number of slow SQL statements in the day. Click the count to view the five most frequently executed slow SQL statements. | Minor | 0 < slowSqlCount < 100 | 1 + (slowSqlCount − 10) / 30 |
| Major | 100 ≤ slowSqlCount < 500 | 4 + (slowSqlCount − 100) / 30 | ||
| Critical | slowSqlCount ≥ 500 | min[18 + (slowSqlCount − 50) / 30, 30] | ||
| Memory fragmentation ratio (HighMemoryFragment) | mem_fragmentation_ratio = used_memory_rss ÷ used_memory, where used_memory_rss is the physical memory the OS allocates to Redis (including memory fragments), and used_memory is the memory Redis requests to store data. For background, see Memory fragmentation. | Minor | HighMemoryFragment > 1.5 | min(HighMemoryFragment × 2, 5) |
API reference
| Operation | Description |
|---|---|
| GetInstanceInspections | Queries inspection results for database instances. |